Key Insights
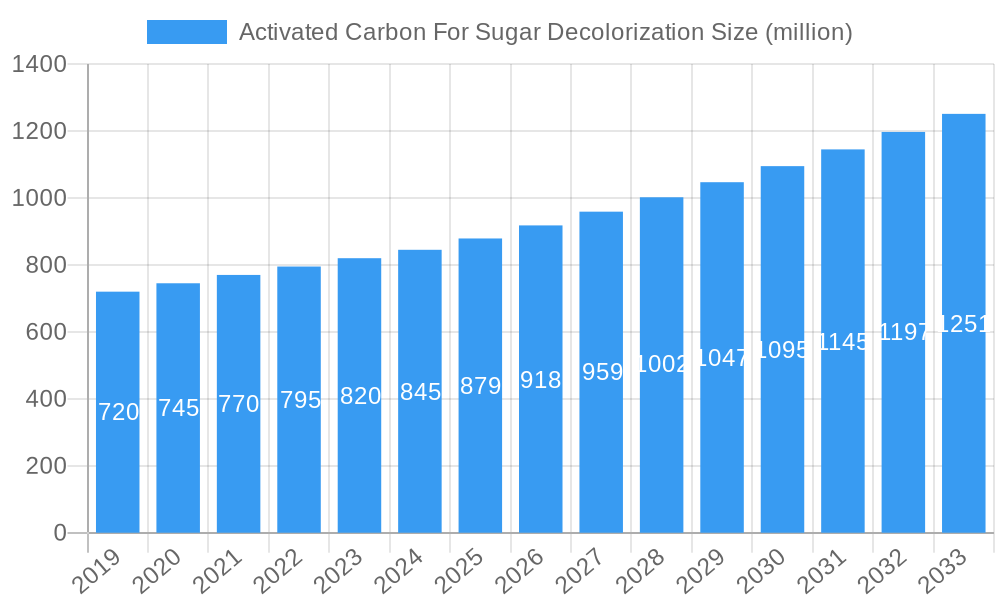
The global Activated Carbon for Sugar Decolorization market is projected for robust growth, reaching an estimated USD 879 million in 2025, with a Compound Annual Growth Rate (CAGR) of 4.5% anticipated from 2019 to 2033. This expansion is primarily driven by the increasing global demand for refined sugar products across various food and beverage industries, coupled with stringent quality standards that necessitate effective decolorization processes. The market's expansion is further fueled by a growing awareness among sugar producers regarding the economic and quality benefits offered by activated carbon, such as enhanced product purity and extended shelf life. Furthermore, advancements in activated carbon manufacturing technologies, leading to improved adsorption capacities and regeneration efficiencies, are contributing significantly to market momentum. The rising consumption of processed foods and beverages worldwide, particularly in emerging economies, directly translates into a higher demand for sugar, consequently boosting the need for sophisticated decolorization solutions.
Activated Carbon For Sugar Decolorization Market Size (In Million)
The market is segmented by application into Sucrose, Glucose, Starch Sugar, and Other Sugars, with Sucrose being the dominant segment due to its widespread use. By type, the market is divided into Particle and Powder forms, each offering distinct advantages for different industrial applications. Key players like Kuraray, Ingevity Corporation, and Cabot Corporation are at the forefront of innovation, developing specialized activated carbon grades tailored for specific sugar refining challenges. However, challenges such as the fluctuating raw material costs for activated carbon production and the availability of alternative decolorization agents pose potential restraints. Geographically, the Asia Pacific region is expected to lead market growth, driven by its substantial sugar production capacity and a rapidly expanding food and beverage sector in countries like China and India. North America and Europe remain significant markets, characterized by a strong focus on product quality and advanced manufacturing practices.
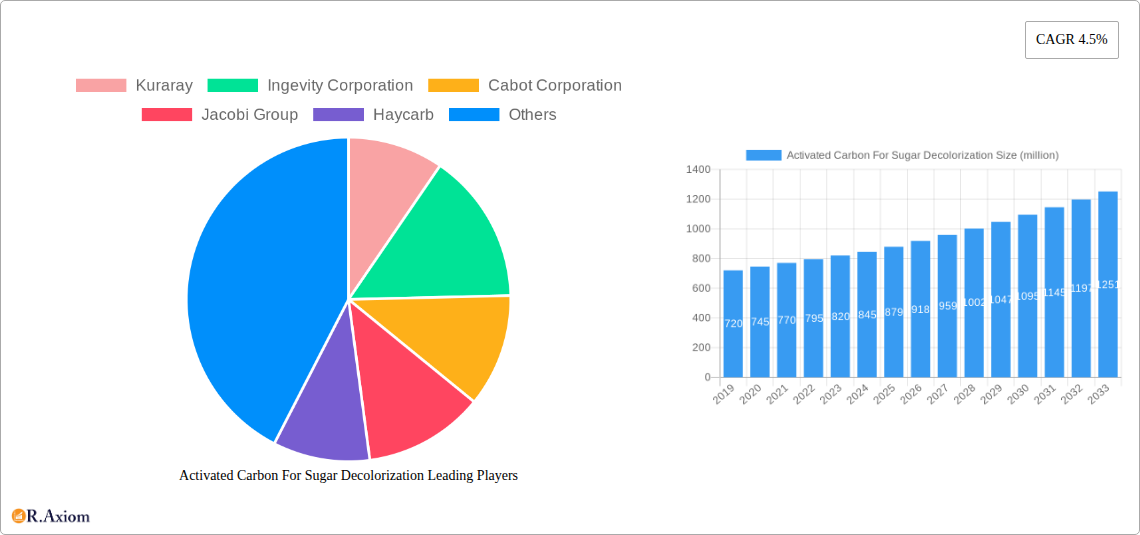
Activated Carbon For Sugar Decolorization Company Market Share
Activated Carbon For Sugar Decolorization Market Concentration & Innovation
The global Activated Carbon for Sugar Decolorization market exhibits a moderate concentration, with several key players vying for market share. Leading companies such as Kuraray, Ingevity Corporation, Cabot Corporation, Jacobi Group, and Haycarb are at the forefront of innovation, driving advancements in decolorization efficiency and sustainability. The market is characterized by continuous research and development focused on enhancing adsorption capacity, reducing regeneration costs, and developing eco-friendly production processes. Regulatory frameworks, particularly concerning food safety and environmental standards, play a significant role in shaping product development and market entry. While direct product substitutes are limited, advancements in alternative purification technologies, such as membrane filtration and ion exchange resins, pose a potential threat. End-user trends are shifting towards higher purity sugar products and increased demand for sustainable and cost-effective decolorization solutions. Mergers and acquisitions (M&A) activities, such as the acquisition of Calgon Carbon Corporation by Kuraray in 2018 for approximately $1,100 million, are indicative of the industry's consolidation and strategic expansion efforts to gain market dominance and access new technologies. This dynamic landscape fosters innovation and competitive advantage for companies that can effectively adapt to evolving industry demands.
Activated Carbon For Sugar Decolorization Industry Trends & Insights
The Activated Carbon for Sugar Decolorization industry is experiencing robust growth, driven by a confluence of factors that underscore its critical role in the food and beverage sector. The primary growth driver remains the escalating global demand for refined sugar across diverse applications, from food and beverages to pharmaceuticals. As consumer preferences lean towards visually appealing and high-quality sugar products, the need for efficient decolorization processes becomes paramount. The market is projected to witness a Compound Annual Growth Rate (CAGR) of approximately 6.5% during the forecast period of 2025–2033, reaching an estimated market size of $3,500 million by 2033. Technological disruptions are continuously reshaping the industry landscape. Innovations in manufacturing processes for activated carbon, including enhanced activation techniques and the utilization of novel raw materials, are leading to products with superior adsorption capabilities and longer lifespans. This translates to lower operational costs and reduced waste generation for sugar manufacturers. Furthermore, the development of specialized activated carbon grades tailored for specific sugar types, such as sucrose, glucose, and starch sugar, is enhancing their market penetration. Consumer preferences are increasingly influenced by health and sustainability concerns. This translates into a demand for activated carbon solutions that minimize the use of harsh chemicals and offer efficient regeneration capabilities, thereby reducing the environmental footprint of sugar production. Competitive dynamics are characterized by strategic partnerships between activated carbon manufacturers and sugar processors, alongside continuous efforts to optimize product portfolios and expand geographic reach. The market penetration of advanced activated carbon technologies is steadily increasing as sugar producers recognize the economic and quality benefits they offer. The industry is also witnessing a growing emphasis on circular economy principles, with a focus on the regeneration and reuse of spent activated carbon. This trend not only reduces waste but also contributes to cost savings for end-users, further solidifying the position of activated carbon as an indispensable purification agent.
Dominant Markets & Segments in Activated Carbon For Sugar Decolorization
The Activated Carbon for Sugar Decolorization market is strategically segmented to cater to the diverse needs of the sugar industry. The Sucrose segment stands out as the dominant application, driven by the sheer volume of sucrose production globally for food, beverage, and industrial uses. The demand for highly refined sucrose, characterized by its pure white color and absence of impurities, directly fuels the requirement for advanced decolorization solutions. Key drivers for the dominance of the sucrose segment include:
- Economic Policies: Favorable agricultural policies and subsidies supporting sugarcane and sugar beet cultivation in major producing nations like Brazil, India, and the European Union contribute significantly to sucrose output.
- Infrastructure: Robust agricultural supply chains and well-established sugar processing infrastructure in these regions ensure a consistent supply of raw material and efficient distribution of refined sugar.
- Consumer Demand: The widespread consumption of sugar in food and beverage products, particularly in developing economies experiencing rising disposable incomes, creates a sustained demand for refined sucrose.
In terms of product type, Particle activated carbon generally holds a larger market share due to its suitability for fixed-bed adsorption systems, commonly employed in large-scale sugar refineries. These systems offer efficient and continuous decolorization, crucial for high-volume production. However, Powder activated carbon also plays a vital role, particularly in batch processes or for specific applications where rapid contact time and ease of handling are preferred.
Geographically, Asia Pacific is emerging as a dominant region in the activated carbon for sugar decolorization market. This dominance is attributed to:
- Rapid Industrialization: Countries like China and India are witnessing significant growth in their sugar industries, driven by increasing domestic consumption and export opportunities.
- Government Initiatives: Proactive government policies aimed at boosting agricultural output and food processing sectors further stimulate demand for purification technologies.
- Cost-Effectiveness: The availability of abundant raw materials for activated carbon production and a competitive manufacturing landscape contribute to cost-effectiveness, making it an attractive market.
Within Asia Pacific, China is a particularly strong market, boasting a large number of activated carbon manufacturers and a substantial sugar processing industry. The Glucose and Starch Sugar segments, while smaller than sucrose, are experiencing steady growth, particularly with the increasing use of corn-based sweeteners in various food applications. Other Sugars, encompassing specialty sugars and sugar alcohols, represent a niche but growing segment with specific decolorization requirements. The competitive landscape across all segments is marked by intense innovation, with companies striving to offer customized solutions that optimize color removal, reduce impurity levels, and enhance overall sugar quality.
Activated Carbon For Sugar Decolorization Product Developments
Product developments in activated carbon for sugar decolorization are focused on enhancing purification efficiency and sustainability. Manufacturers are innovating through optimized pore structures and surface chemistry to improve adsorption capacity for color bodies and other impurities. This leads to higher yields and purer sugar products. Key technological advancements include the development of activated carbons derived from renewable biomass sources, offering an eco-friendlier alternative. Furthermore, specialized product grades are emerging, tailored for specific sugar types like sucrose, glucose, and starch sugar, each presenting unique decolorization challenges. These developments offer competitive advantages by reducing regeneration cycles, lowering operational costs, and meeting stringent food safety standards.
Report Scope & Segmentation Analysis
This report delves into the global Activated Carbon for Sugar Decolorization market, encompassing a comprehensive segmentation analysis. The Application segments include Sucrose, Glucose, Starch Sugar, and Other Sugars. The Type segments are Particle and Powder activated carbon.
Sucrose: This is the largest segment, driven by the extensive use of sucrose in food and beverages. Growth projections indicate a robust CAGR, with market sizes estimated to reach $2,800 million by 2033. Competitive dynamics are characterized by high purity demands and cost-efficiency pressures.
Glucose: This segment, crucial for various food and pharmaceutical applications, is projected to experience steady growth with an estimated market size of $400 million by 2033. Innovations focus on targeted impurity removal.
Starch Sugar: This segment, encompassing corn syrups and other starch derivatives, is expected to witness moderate growth, with market size projected around $250 million by 2033. Demand is influenced by confectionery and baking industries.
Other Sugars: This niche segment, including specialty sugars, is anticipated to grow at a healthy pace, reaching approximately $50 million by 2033, driven by specialized applications and emerging markets.
Particle Activated Carbon: This segment is expected to maintain a dominant share due to its suitability for continuous industrial processes, with market size projected to exceed $2,500 million by 2033.
Powder Activated Carbon: While smaller, this segment is projected for steady growth, reaching around $1,000 million by 2033, driven by its utility in batch processes and specific purification needs.
Key Drivers of Activated Carbon For Sugar Decolorization Growth
The growth of the Activated Carbon for Sugar Decolorization market is propelled by several key factors. The increasing global demand for refined sugar, driven by population growth and rising disposable incomes, is a primary catalyst. Consumers' preference for visually appealing, high-purity sugar products necessitates effective decolorization processes, thereby boosting demand for activated carbon. Technological advancements in activated carbon production, leading to enhanced adsorption capacities and improved regeneration efficiency, contribute to cost-effectiveness for sugar manufacturers. Furthermore, stricter environmental regulations and a growing focus on sustainable manufacturing practices are encouraging the adoption of activated carbon solutions with lower environmental footprints. The expansion of the food and beverage industry, particularly in emerging economies, also plays a significant role in driving market growth.
Challenges in the Activated Carbon For Sugar Decolorization Sector
The Activated Carbon for Sugar Decolorization sector faces several challenges that can impede its growth trajectory. Fluctuations in the price and availability of raw materials, such as coal and coconut shells, can impact production costs and profit margins for activated carbon manufacturers. The energy-intensive nature of the activation process also contributes to operational expenses. Regulatory hurdles related to food safety standards and environmental compliance can pose barriers to market entry and necessitate significant investment in research and development. Furthermore, competition from alternative purification technologies, although currently less dominant, presents a potential long-term threat. Intense price competition among manufacturers can also compress profit margins, requiring a constant focus on operational efficiency and product differentiation.
Emerging Opportunities in Activated Carbon For Sugar Decolorization
Emerging opportunities in the Activated Carbon for Sugar Decolorization market are ripe for innovation and strategic expansion. The growing trend towards natural and clean-label products is creating demand for activated carbon derived from sustainable and renewable sources, such as agricultural waste. Advancements in nanotechnology are paving the way for the development of highly efficient, nano-structured activated carbons with superior adsorption capabilities. The expanding use of sugar and its derivatives in pharmaceutical applications presents a lucrative opportunity, as these sectors often require ultra-high purity standards. Furthermore, the increasing focus on circular economy principles is driving demand for activated carbon regeneration services and the development of closed-loop systems, offering new revenue streams for market players. The development of smart activated carbons with real-time monitoring capabilities for process optimization is another area with significant potential.
Leading Players in the Activated Carbon For Sugar Decolorization Market
- Kuraray
- Ingevity Corporation
- Cabot Corporation
- Jacobi Group
- Haycarb
- Chemviron
- Boyce Carbon
- Calgon Carbon Corporation
- CPL Activated Carbons
- Fujian Yuanli Active Carbon
- Jiangsu Zhuxi Activated Carbon
- Shanghai Xinjinhu Activated Carbon
- Datong Jinsheng Haoda Coal Industry
- Zhengzhou Zhulin Activated Carbon Development
- Datong CRRC Coal Chemical
- Shanxi Huaqing Environmental Protection
Key Developments in Activated Carbon For Sugar Decolorization Industry
- 2018: Kuraray acquired Calgon Carbon Corporation for approximately $1,100 million, consolidating its position in the activated carbon market.
- 2020: Ingevity Corporation launched a new line of high-performance activated carbons for food and beverage applications, offering enhanced decolorization capabilities.
- 2021: Jacobi Group invested in expanding its production capacity for sustainable activated carbon solutions to meet growing market demand.
- 2022: Cabot Corporation announced strategic partnerships to develop innovative activated carbon formulations for the sugar industry.
- 2023: Haycarb introduced advanced regeneration technologies for activated carbon, focusing on environmental sustainability and cost reduction for sugar processors.
- 2024: Chemviron unveiled a new range of granular activated carbons specifically engineered for efficient sucrose decolorization.
Strategic Outlook for Activated Carbon For Sugar Decolorization Market
The strategic outlook for the Activated Carbon for Sugar Decolorization market is highly positive, driven by sustained global demand for refined sugar and an increasing emphasis on product quality and sustainability. Key growth catalysts include continuous technological innovation leading to higher efficiency and cost-effectiveness of activated carbon solutions. The growing awareness of environmental responsibility will further drive the adoption of eco-friendly and regenerable activated carbon products. The expansion of the food and beverage industry in emerging economies presents significant untapped market potential. Strategic collaborations, mergers, and acquisitions will likely continue to shape the competitive landscape, enabling companies to enhance their product portfolios, expand their global reach, and leverage economies of scale. The future will see a greater focus on customized solutions tailored to specific sugar types and processing requirements, alongside the integration of advanced digital technologies for process monitoring and optimization.
Activated Carbon For Sugar Decolorization Segmentation
-
1. Application
- 1.1. Sucrose
- 1.2. Glucose
- 1.3. Starch Sugar
- 1.4. Other Sugars
-
2. Type
- 2.1. Particle
- 2.2. Powder
Activated Carbon For Sugar Decolorization Segmentation By Geography
-
1. North America
- 1.1. United States
- 1.2. Canada
- 1.3. Mexico
-
2. South America
- 2.1. Brazil
- 2.2. Argentina
- 2.3. Rest of South America
-
3. Europe
- 3.1. United Kingdom
- 3.2. Germany
- 3.3. France
- 3.4. Italy
- 3.5. Spain
- 3.6. Russia
- 3.7. Benelux
- 3.8. Nordics
- 3.9. Rest of Europe
-
4. Middle East & Africa
- 4.1. Turkey
- 4.2. Israel
- 4.3. GCC
- 4.4. North Africa
- 4.5. South Africa
- 4.6. Rest of Middle East & Africa
-
5. Asia Pacific
- 5.1. China
- 5.2. India
- 5.3. Japan
- 5.4. South Korea
- 5.5. ASEAN
- 5.6. Oceania
- 5.7. Rest of Asia Pacific
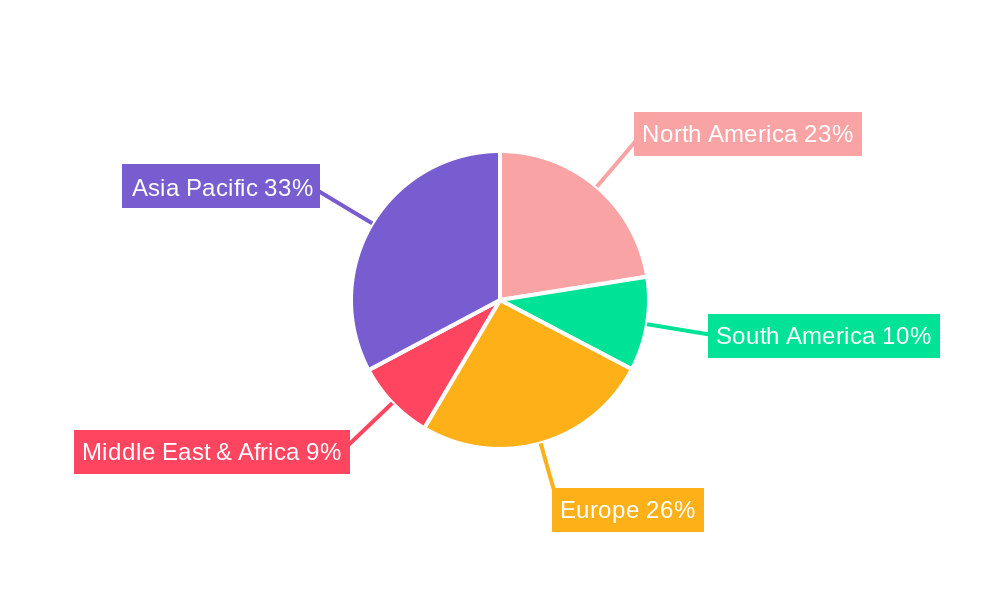
Activated Carbon For Sugar Decolorization Regional Market Share
Geographic Coverage of Activated Carbon For Sugar Decolorization
Activated Carbon For Sugar Decolorization REPORT HIGHLIGHTS
| Aspects | Details |
|---|---|
| Study Period | 2020-2034 |
| Base Year | 2025 |
| Estimated Year | 2026 |
| Forecast Period | 2026-2034 |
| Historical Period | 2020-2025 |
| Growth Rate | CAGR of 4.5% from 2020-2034 |
| Segmentation |
|
Table of Contents
- 1. Introduction
- 1.1. Research Scope
- 1.2. Market Segmentation
- 1.3. Research Objective
- 1.4. Definitions and Assumptions
- 2. Executive Summary
- 2.1. Market Snapshot
- 3. Market Dynamics
- 3.1. Market Drivers
- 3.2. Market Restrains
- 3.3. Market Trends
- 3.4. Market Opportunities
- 4. Market Factor Analysis
- 4.1. Porters Five Forces
- 4.1.1. Bargaining Power of Suppliers
- 4.1.2. Bargaining Power of Buyers
- 4.1.3. Threat of New Entrants
- 4.1.4. Threat of Substitutes
- 4.1.5. Competitive Rivalry
- 4.2. PESTEL analysis
- 4.3. BCG Analysis
- 4.3.1. Stars (High Growth, High Market Share)
- 4.3.2. Cash Cows (Low Growth, High Market Share)
- 4.3.3. Question Mark (High Growth, Low Market Share)
- 4.3.4. Dogs (Low Growth, Low Market Share)
- 4.4. Ansoff Matrix Analysis
- 4.5. Supply Chain Analysis
- 4.6. Regulatory Landscape
- 4.7. Current Market Potential and Opportunity Assessment (TAM–SAM–SOM Framework)
- 4.8. RAX Analyst Note
- 4.1. Porters Five Forces
- 5. Market Analysis, Insights and Forecast 2021-2033
- 5.1. Market Analysis, Insights and Forecast - by Application
- 5.1.1. Sucrose
- 5.1.2. Glucose
- 5.1.3. Starch Sugar
- 5.1.4. Other Sugars
- 5.2. Market Analysis, Insights and Forecast - by Type
- 5.2.1. Particle
- 5.2.2. Powder
- 5.3. Market Analysis, Insights and Forecast - by Region
- 5.3.1. North America
- 5.3.2. South America
- 5.3.3. Europe
- 5.3.4. Middle East & Africa
- 5.3.5. Asia Pacific
- 5.1. Market Analysis, Insights and Forecast - by Application
- 6. Global Activated Carbon For Sugar Decolorization Analysis, Insights and Forecast, 2021-2033
- 6.1. Market Analysis, Insights and Forecast - by Application
- 6.1.1. Sucrose
- 6.1.2. Glucose
- 6.1.3. Starch Sugar
- 6.1.4. Other Sugars
- 6.2. Market Analysis, Insights and Forecast - by Type
- 6.2.1. Particle
- 6.2.2. Powder
- 6.1. Market Analysis, Insights and Forecast - by Application
- 7. North America Activated Carbon For Sugar Decolorization Analysis, Insights and Forecast, 2020-2032
- 7.1. Market Analysis, Insights and Forecast - by Application
- 7.1.1. Sucrose
- 7.1.2. Glucose
- 7.1.3. Starch Sugar
- 7.1.4. Other Sugars
- 7.2. Market Analysis, Insights and Forecast - by Type
- 7.2.1. Particle
- 7.2.2. Powder
- 7.1. Market Analysis, Insights and Forecast - by Application
- 8. South America Activated Carbon For Sugar Decolorization Analysis, Insights and Forecast, 2020-2032
- 8.1. Market Analysis, Insights and Forecast - by Application
- 8.1.1. Sucrose
- 8.1.2. Glucose
- 8.1.3. Starch Sugar
- 8.1.4. Other Sugars
- 8.2. Market Analysis, Insights and Forecast - by Type
- 8.2.1. Particle
- 8.2.2. Powder
- 8.1. Market Analysis, Insights and Forecast - by Application
- 9. Europe Activated Carbon For Sugar Decolorization Analysis, Insights and Forecast, 2020-2032
- 9.1. Market Analysis, Insights and Forecast - by Application
- 9.1.1. Sucrose
- 9.1.2. Glucose
- 9.1.3. Starch Sugar
- 9.1.4. Other Sugars
- 9.2. Market Analysis, Insights and Forecast - by Type
- 9.2.1. Particle
- 9.2.2. Powder
- 9.1. Market Analysis, Insights and Forecast - by Application
- 10. Middle East & Africa Activated Carbon For Sugar Decolorization Analysis, Insights and Forecast, 2020-2032
- 10.1. Market Analysis, Insights and Forecast - by Application
- 10.1.1. Sucrose
- 10.1.2. Glucose
- 10.1.3. Starch Sugar
- 10.1.4. Other Sugars
- 10.2. Market Analysis, Insights and Forecast - by Type
- 10.2.1. Particle
- 10.2.2. Powder
- 10.1. Market Analysis, Insights and Forecast - by Application
- 11. Asia Pacific Activated Carbon For Sugar Decolorization Analysis, Insights and Forecast, 2020-2032
- 11.1. Market Analysis, Insights and Forecast - by Application
- 11.1.1. Sucrose
- 11.1.2. Glucose
- 11.1.3. Starch Sugar
- 11.1.4. Other Sugars
- 11.2. Market Analysis, Insights and Forecast - by Type
- 11.2.1. Particle
- 11.2.2. Powder
- 11.1. Market Analysis, Insights and Forecast - by Application
- 12. Competitive Analysis
- 12.1. Company Profiles
- 12.1.1 Kuraray
- 12.1.1.1. Company Overview
- 12.1.1.2. Products
- 12.1.1.3. Company Financials
- 12.1.1.4. SWOT Analysis
- 12.1.2 Ingevity Corporation
- 12.1.2.1. Company Overview
- 12.1.2.2. Products
- 12.1.2.3. Company Financials
- 12.1.2.4. SWOT Analysis
- 12.1.3 Cabot Corporation
- 12.1.3.1. Company Overview
- 12.1.3.2. Products
- 12.1.3.3. Company Financials
- 12.1.3.4. SWOT Analysis
- 12.1.4 Jacobi Group
- 12.1.4.1. Company Overview
- 12.1.4.2. Products
- 12.1.4.3. Company Financials
- 12.1.4.4. SWOT Analysis
- 12.1.5 Haycarb
- 12.1.5.1. Company Overview
- 12.1.5.2. Products
- 12.1.5.3. Company Financials
- 12.1.5.4. SWOT Analysis
- 12.1.6 Chemviron
- 12.1.6.1. Company Overview
- 12.1.6.2. Products
- 12.1.6.3. Company Financials
- 12.1.6.4. SWOT Analysis
- 12.1.7 Boyce Carbon
- 12.1.7.1. Company Overview
- 12.1.7.2. Products
- 12.1.7.3. Company Financials
- 12.1.7.4. SWOT Analysis
- 12.1.8 Calgon Carbon Corporation
- 12.1.8.1. Company Overview
- 12.1.8.2. Products
- 12.1.8.3. Company Financials
- 12.1.8.4. SWOT Analysis
- 12.1.9 CPL Activated Carbons
- 12.1.9.1. Company Overview
- 12.1.9.2. Products
- 12.1.9.3. Company Financials
- 12.1.9.4. SWOT Analysis
- 12.1.10 Fujian Yuanli Active Carbon
- 12.1.10.1. Company Overview
- 12.1.10.2. Products
- 12.1.10.3. Company Financials
- 12.1.10.4. SWOT Analysis
- 12.1.11 Jiangsu Zhuxi Activated Carbon
- 12.1.11.1. Company Overview
- 12.1.11.2. Products
- 12.1.11.3. Company Financials
- 12.1.11.4. SWOT Analysis
- 12.1.12 Shanghai Xinjinhu Activated Carbon
- 12.1.12.1. Company Overview
- 12.1.12.2. Products
- 12.1.12.3. Company Financials
- 12.1.12.4. SWOT Analysis
- 12.1.13 Datong Jinsheng Haoda Coal Industry
- 12.1.13.1. Company Overview
- 12.1.13.2. Products
- 12.1.13.3. Company Financials
- 12.1.13.4. SWOT Analysis
- 12.1.14 Zhengzhou Zhulin Activated Carbon Development
- 12.1.14.1. Company Overview
- 12.1.14.2. Products
- 12.1.14.3. Company Financials
- 12.1.14.4. SWOT Analysis
- 12.1.15 Datong CRRC Coal Chemical
- 12.1.15.1. Company Overview
- 12.1.15.2. Products
- 12.1.15.3. Company Financials
- 12.1.15.4. SWOT Analysis
- 12.1.16 Shanxi Huaqing Environmental Protection
- 12.1.16.1. Company Overview
- 12.1.16.2. Products
- 12.1.16.3. Company Financials
- 12.1.16.4. SWOT Analysis
- 12.1.1 Kuraray
- 12.2. Market Entropy
- 12.2.1 Company's Key Areas Served
- 12.2.2 Recent Developments
- 12.3. Company Market Share Analysis 2025
- 12.3.1 Top 5 Companies Market Share Analysis
- 12.3.2 Top 3 Companies Market Share Analysis
- 12.4. List of Potential Customers
- 13. Research Methodology
List of Figures
- Figure 1: Global Activated Carbon For Sugar Decolorization Revenue Breakdown (million, %) by Region 2025 & 2033
- Figure 2: Global Activated Carbon For Sugar Decolorization Volume Breakdown (K, %) by Region 2025 & 2033
- Figure 3: North America Activated Carbon For Sugar Decolorization Revenue (million), by Application 2025 & 2033
- Figure 4: North America Activated Carbon For Sugar Decolorization Volume (K), by Application 2025 & 2033
- Figure 5: North America Activated Carbon For Sugar Decolorization Revenue Share (%), by Application 2025 & 2033
- Figure 6: North America Activated Carbon For Sugar Decolorization Volume Share (%), by Application 2025 & 2033
- Figure 7: North America Activated Carbon For Sugar Decolorization Revenue (million), by Type 2025 & 2033
- Figure 8: North America Activated Carbon For Sugar Decolorization Volume (K), by Type 2025 & 2033
- Figure 9: North America Activated Carbon For Sugar Decolorization Revenue Share (%), by Type 2025 & 2033
- Figure 10: North America Activated Carbon For Sugar Decolorization Volume Share (%), by Type 2025 & 2033
- Figure 11: North America Activated Carbon For Sugar Decolorization Revenue (million), by Country 2025 & 2033
- Figure 12: North America Activated Carbon For Sugar Decolorization Volume (K), by Country 2025 & 2033
- Figure 13: North America Activated Carbon For Sugar Decolorization Revenue Share (%), by Country 2025 & 2033
- Figure 14: North America Activated Carbon For Sugar Decolorization Volume Share (%), by Country 2025 & 2033
- Figure 15: South America Activated Carbon For Sugar Decolorization Revenue (million), by Application 2025 & 2033
- Figure 16: South America Activated Carbon For Sugar Decolorization Volume (K), by Application 2025 & 2033
- Figure 17: South America Activated Carbon For Sugar Decolorization Revenue Share (%), by Application 2025 & 2033
- Figure 18: South America Activated Carbon For Sugar Decolorization Volume Share (%), by Application 2025 & 2033
- Figure 19: South America Activated Carbon For Sugar Decolorization Revenue (million), by Type 2025 & 2033
- Figure 20: South America Activated Carbon For Sugar Decolorization Volume (K), by Type 2025 & 2033
- Figure 21: South America Activated Carbon For Sugar Decolorization Revenue Share (%), by Type 2025 & 2033
- Figure 22: South America Activated Carbon For Sugar Decolorization Volume Share (%), by Type 2025 & 2033
- Figure 23: South America Activated Carbon For Sugar Decolorization Revenue (million), by Country 2025 & 2033
- Figure 24: South America Activated Carbon For Sugar Decolorization Volume (K), by Country 2025 & 2033
- Figure 25: South America Activated Carbon For Sugar Decolorization Revenue Share (%), by Country 2025 & 2033
- Figure 26: South America Activated Carbon For Sugar Decolorization Volume Share (%), by Country 2025 & 2033
- Figure 27: Europe Activated Carbon For Sugar Decolorization Revenue (million), by Application 2025 & 2033
- Figure 28: Europe Activated Carbon For Sugar Decolorization Volume (K), by Application 2025 & 2033
- Figure 29: Europe Activated Carbon For Sugar Decolorization Revenue Share (%), by Application 2025 & 2033
- Figure 30: Europe Activated Carbon For Sugar Decolorization Volume Share (%), by Application 2025 & 2033
- Figure 31: Europe Activated Carbon For Sugar Decolorization Revenue (million), by Type 2025 & 2033
- Figure 32: Europe Activated Carbon For Sugar Decolorization Volume (K), by Type 2025 & 2033
- Figure 33: Europe Activated Carbon For Sugar Decolorization Revenue Share (%), by Type 2025 & 2033
- Figure 34: Europe Activated Carbon For Sugar Decolorization Volume Share (%), by Type 2025 & 2033
- Figure 35: Europe Activated Carbon For Sugar Decolorization Revenue (million), by Country 2025 & 2033
- Figure 36: Europe Activated Carbon For Sugar Decolorization Volume (K), by Country 2025 & 2033
- Figure 37: Europe Activated Carbon For Sugar Decolorization Revenue Share (%), by Country 2025 & 2033
- Figure 38: Europe Activated Carbon For Sugar Decolorization Volume Share (%), by Country 2025 & 2033
- Figure 39: Middle East & Africa Activated Carbon For Sugar Decolorization Revenue (million), by Application 2025 & 2033
- Figure 40: Middle East & Africa Activated Carbon For Sugar Decolorization Volume (K), by Application 2025 & 2033
- Figure 41: Middle East & Africa Activated Carbon For Sugar Decolorization Revenue Share (%), by Application 2025 & 2033
- Figure 42: Middle East & Africa Activated Carbon For Sugar Decolorization Volume Share (%), by Application 2025 & 2033
- Figure 43: Middle East & Africa Activated Carbon For Sugar Decolorization Revenue (million), by Type 2025 & 2033
- Figure 44: Middle East & Africa Activated Carbon For Sugar Decolorization Volume (K), by Type 2025 & 2033
- Figure 45: Middle East & Africa Activated Carbon For Sugar Decolorization Revenue Share (%), by Type 2025 & 2033
- Figure 46: Middle East & Africa Activated Carbon For Sugar Decolorization Volume Share (%), by Type 2025 & 2033
- Figure 47: Middle East & Africa Activated Carbon For Sugar Decolorization Revenue (million), by Country 2025 & 2033
- Figure 48: Middle East & Africa Activated Carbon For Sugar Decolorization Volume (K), by Country 2025 & 2033
- Figure 49: Middle East & Africa Activated Carbon For Sugar Decolorization Revenue Share (%), by Country 2025 & 2033
- Figure 50: Middle East & Africa Activated Carbon For Sugar Decolorization Volume Share (%), by Country 2025 & 2033
- Figure 51: Asia Pacific Activated Carbon For Sugar Decolorization Revenue (million), by Application 2025 & 2033
- Figure 52: Asia Pacific Activated Carbon For Sugar Decolorization Volume (K), by Application 2025 & 2033
- Figure 53: Asia Pacific Activated Carbon For Sugar Decolorization Revenue Share (%), by Application 2025 & 2033
- Figure 54: Asia Pacific Activated Carbon For Sugar Decolorization Volume Share (%), by Application 2025 & 2033
- Figure 55: Asia Pacific Activated Carbon For Sugar Decolorization Revenue (million), by Type 2025 & 2033
- Figure 56: Asia Pacific Activated Carbon For Sugar Decolorization Volume (K), by Type 2025 & 2033
- Figure 57: Asia Pacific Activated Carbon For Sugar Decolorization Revenue Share (%), by Type 2025 & 2033
- Figure 58: Asia Pacific Activated Carbon For Sugar Decolorization Volume Share (%), by Type 2025 & 2033
- Figure 59: Asia Pacific Activated Carbon For Sugar Decolorization Revenue (million), by Country 2025 & 2033
- Figure 60: Asia Pacific Activated Carbon For Sugar Decolorization Volume (K), by Country 2025 & 2033
- Figure 61: Asia Pacific Activated Carbon For Sugar Decolorization Revenue Share (%), by Country 2025 & 2033
- Figure 62: Asia Pacific Activated Carbon For Sugar Decolorization Volume Share (%), by Country 2025 & 2033
List of Tables
- Table 1: Global Activated Carbon For Sugar Decolorization Revenue million Forecast, by Application 2020 & 2033
- Table 2: Global Activated Carbon For Sugar Decolorization Volume K Forecast, by Application 2020 & 2033
- Table 3: Global Activated Carbon For Sugar Decolorization Revenue million Forecast, by Type 2020 & 2033
- Table 4: Global Activated Carbon For Sugar Decolorization Volume K Forecast, by Type 2020 & 2033
- Table 5: Global Activated Carbon For Sugar Decolorization Revenue million Forecast, by Region 2020 & 2033
- Table 6: Global Activated Carbon For Sugar Decolorization Volume K Forecast, by Region 2020 & 2033
- Table 7: Global Activated Carbon For Sugar Decolorization Revenue million Forecast, by Application 2020 & 2033
- Table 8: Global Activated Carbon For Sugar Decolorization Volume K Forecast, by Application 2020 & 2033
- Table 9: Global Activated Carbon For Sugar Decolorization Revenue million Forecast, by Type 2020 & 2033
- Table 10: Global Activated Carbon For Sugar Decolorization Volume K Forecast, by Type 2020 & 2033
- Table 11: Global Activated Carbon For Sugar Decolorization Revenue million Forecast, by Country 2020 & 2033
- Table 12: Global Activated Carbon For Sugar Decolorization Volume K Forecast, by Country 2020 & 2033
- Table 13: United States Activated Carbon For Sugar Decolorization Revenue (million) Forecast, by Application 2020 & 2033
- Table 14: United States Activated Carbon For Sugar Decolorization Volume (K) Forecast, by Application 2020 & 2033
- Table 15: Canada Activated Carbon For Sugar Decolorization Revenue (million) Forecast, by Application 2020 & 2033
- Table 16: Canada Activated Carbon For Sugar Decolorization Volume (K) Forecast, by Application 2020 & 2033
- Table 17: Mexico Activated Carbon For Sugar Decolorization Revenue (million) Forecast, by Application 2020 & 2033
- Table 18: Mexico Activated Carbon For Sugar Decolorization Volume (K) Forecast, by Application 2020 & 2033
- Table 19: Global Activated Carbon For Sugar Decolorization Revenue million Forecast, by Application 2020 & 2033
- Table 20: Global Activated Carbon For Sugar Decolorization Volume K Forecast, by Application 2020 & 2033
- Table 21: Global Activated Carbon For Sugar Decolorization Revenue million Forecast, by Type 2020 & 2033
- Table 22: Global Activated Carbon For Sugar Decolorization Volume K Forecast, by Type 2020 & 2033
- Table 23: Global Activated Carbon For Sugar Decolorization Revenue million Forecast, by Country 2020 & 2033
- Table 24: Global Activated Carbon For Sugar Decolorization Volume K Forecast, by Country 2020 & 2033
- Table 25: Brazil Activated Carbon For Sugar Decolorization Revenue (million) Forecast, by Application 2020 & 2033
- Table 26: Brazil Activated Carbon For Sugar Decolorization Volume (K) Forecast, by Application 2020 & 2033
- Table 27: Argentina Activated Carbon For Sugar Decolorization Revenue (million) Forecast, by Application 2020 & 2033
- Table 28: Argentina Activated Carbon For Sugar Decolorization Volume (K) Forecast, by Application 2020 & 2033
- Table 29: Rest of South America Activated Carbon For Sugar Decolorization Revenue (million) Forecast, by Application 2020 & 2033
- Table 30: Rest of South America Activated Carbon For Sugar Decolorization Volume (K) Forecast, by Application 2020 & 2033
- Table 31: Global Activated Carbon For Sugar Decolorization Revenue million Forecast, by Application 2020 & 2033
- Table 32: Global Activated Carbon For Sugar Decolorization Volume K Forecast, by Application 2020 & 2033
- Table 33: Global Activated Carbon For Sugar Decolorization Revenue million Forecast, by Type 2020 & 2033
- Table 34: Global Activated Carbon For Sugar Decolorization Volume K Forecast, by Type 2020 & 2033
- Table 35: Global Activated Carbon For Sugar Decolorization Revenue million Forecast, by Country 2020 & 2033
- Table 36: Global Activated Carbon For Sugar Decolorization Volume K Forecast, by Country 2020 & 2033
- Table 37: United Kingdom Activated Carbon For Sugar Decolorization Revenue (million) Forecast, by Application 2020 & 2033
- Table 38: United Kingdom Activated Carbon For Sugar Decolorization Volume (K) Forecast, by Application 2020 & 2033
- Table 39: Germany Activated Carbon For Sugar Decolorization Revenue (million) Forecast, by Application 2020 & 2033
- Table 40: Germany Activated Carbon For Sugar Decolorization Volume (K) Forecast, by Application 2020 & 2033
- Table 41: France Activated Carbon For Sugar Decolorization Revenue (million) Forecast, by Application 2020 & 2033
- Table 42: France Activated Carbon For Sugar Decolorization Volume (K) Forecast, by Application 2020 & 2033
- Table 43: Italy Activated Carbon For Sugar Decolorization Revenue (million) Forecast, by Application 2020 & 2033
- Table 44: Italy Activated Carbon For Sugar Decolorization Volume (K) Forecast, by Application 2020 & 2033
- Table 45: Spain Activated Carbon For Sugar Decolorization Revenue (million) Forecast, by Application 2020 & 2033
- Table 46: Spain Activated Carbon For Sugar Decolorization Volume (K) Forecast, by Application 2020 & 2033
- Table 47: Russia Activated Carbon For Sugar Decolorization Revenue (million) Forecast, by Application 2020 & 2033
- Table 48: Russia Activated Carbon For Sugar Decolorization Volume (K) Forecast, by Application 2020 & 2033
- Table 49: Benelux Activated Carbon For Sugar Decolorization Revenue (million) Forecast, by Application 2020 & 2033
- Table 50: Benelux Activated Carbon For Sugar Decolorization Volume (K) Forecast, by Application 2020 & 2033
- Table 51: Nordics Activated Carbon For Sugar Decolorization Revenue (million) Forecast, by Application 2020 & 2033
- Table 52: Nordics Activated Carbon For Sugar Decolorization Volume (K) Forecast, by Application 2020 & 2033
- Table 53: Rest of Europe Activated Carbon For Sugar Decolorization Revenue (million) Forecast, by Application 2020 & 2033
- Table 54: Rest of Europe Activated Carbon For Sugar Decolorization Volume (K) Forecast, by Application 2020 & 2033
- Table 55: Global Activated Carbon For Sugar Decolorization Revenue million Forecast, by Application 2020 & 2033
- Table 56: Global Activated Carbon For Sugar Decolorization Volume K Forecast, by Application 2020 & 2033
- Table 57: Global Activated Carbon For Sugar Decolorization Revenue million Forecast, by Type 2020 & 2033
- Table 58: Global Activated Carbon For Sugar Decolorization Volume K Forecast, by Type 2020 & 2033
- Table 59: Global Activated Carbon For Sugar Decolorization Revenue million Forecast, by Country 2020 & 2033
- Table 60: Global Activated Carbon For Sugar Decolorization Volume K Forecast, by Country 2020 & 2033
- Table 61: Turkey Activated Carbon For Sugar Decolorization Revenue (million) Forecast, by Application 2020 & 2033
- Table 62: Turkey Activated Carbon For Sugar Decolorization Volume (K) Forecast, by Application 2020 & 2033
- Table 63: Israel Activated Carbon For Sugar Decolorization Revenue (million) Forecast, by Application 2020 & 2033
- Table 64: Israel Activated Carbon For Sugar Decolorization Volume (K) Forecast, by Application 2020 & 2033
- Table 65: GCC Activated Carbon For Sugar Decolorization Revenue (million) Forecast, by Application 2020 & 2033
- Table 66: GCC Activated Carbon For Sugar Decolorization Volume (K) Forecast, by Application 2020 & 2033
- Table 67: North Africa Activated Carbon For Sugar Decolorization Revenue (million) Forecast, by Application 2020 & 2033
- Table 68: North Africa Activated Carbon For Sugar Decolorization Volume (K) Forecast, by Application 2020 & 2033
- Table 69: South Africa Activated Carbon For Sugar Decolorization Revenue (million) Forecast, by Application 2020 & 2033
- Table 70: South Africa Activated Carbon For Sugar Decolorization Volume (K) Forecast, by Application 2020 & 2033
- Table 71: Rest of Middle East & Africa Activated Carbon For Sugar Decolorization Revenue (million) Forecast, by Application 2020 & 2033
- Table 72: Rest of Middle East & Africa Activated Carbon For Sugar Decolorization Volume (K) Forecast, by Application 2020 & 2033
- Table 73: Global Activated Carbon For Sugar Decolorization Revenue million Forecast, by Application 2020 & 2033
- Table 74: Global Activated Carbon For Sugar Decolorization Volume K Forecast, by Application 2020 & 2033
- Table 75: Global Activated Carbon For Sugar Decolorization Revenue million Forecast, by Type 2020 & 2033
- Table 76: Global Activated Carbon For Sugar Decolorization Volume K Forecast, by Type 2020 & 2033
- Table 77: Global Activated Carbon For Sugar Decolorization Revenue million Forecast, by Country 2020 & 2033
- Table 78: Global Activated Carbon For Sugar Decolorization Volume K Forecast, by Country 2020 & 2033
- Table 79: China Activated Carbon For Sugar Decolorization Revenue (million) Forecast, by Application 2020 & 2033
- Table 80: China Activated Carbon For Sugar Decolorization Volume (K) Forecast, by Application 2020 & 2033
- Table 81: India Activated Carbon For Sugar Decolorization Revenue (million) Forecast, by Application 2020 & 2033
- Table 82: India Activated Carbon For Sugar Decolorization Volume (K) Forecast, by Application 2020 & 2033
- Table 83: Japan Activated Carbon For Sugar Decolorization Revenue (million) Forecast, by Application 2020 & 2033
- Table 84: Japan Activated Carbon For Sugar Decolorization Volume (K) Forecast, by Application 2020 & 2033
- Table 85: South Korea Activated Carbon For Sugar Decolorization Revenue (million) Forecast, by Application 2020 & 2033
- Table 86: South Korea Activated Carbon For Sugar Decolorization Volume (K) Forecast, by Application 2020 & 2033
- Table 87: ASEAN Activated Carbon For Sugar Decolorization Revenue (million) Forecast, by Application 2020 & 2033
- Table 88: ASEAN Activated Carbon For Sugar Decolorization Volume (K) Forecast, by Application 2020 & 2033
- Table 89: Oceania Activated Carbon For Sugar Decolorization Revenue (million) Forecast, by Application 2020 & 2033
- Table 90: Oceania Activated Carbon For Sugar Decolorization Volume (K) Forecast, by Application 2020 & 2033
- Table 91: Rest of Asia Pacific Activated Carbon For Sugar Decolorization Revenue (million) Forecast, by Application 2020 & 2033
- Table 92: Rest of Asia Pacific Activated Carbon For Sugar Decolorization Volume (K) Forecast, by Application 2020 & 2033
Frequently Asked Questions
1. What is the projected Compound Annual Growth Rate (CAGR) of the Activated Carbon For Sugar Decolorization?
The projected CAGR is approximately 4.5%.
2. Which companies are prominent players in the Activated Carbon For Sugar Decolorization?
Key companies in the market include Kuraray, Ingevity Corporation, Cabot Corporation, Jacobi Group, Haycarb, Chemviron, Boyce Carbon, Calgon Carbon Corporation, CPL Activated Carbons, Fujian Yuanli Active Carbon, Jiangsu Zhuxi Activated Carbon, Shanghai Xinjinhu Activated Carbon, Datong Jinsheng Haoda Coal Industry, Zhengzhou Zhulin Activated Carbon Development, Datong CRRC Coal Chemical, Shanxi Huaqing Environmental Protection.
3. What are the main segments of the Activated Carbon For Sugar Decolorization?
The market segments include Application, Type.
4. Can you provide details about the market size?
The market size is estimated to be USD 879 million as of 2022.
5. What are some drivers contributing to market growth?
N/A
6. What are the notable trends driving market growth?
N/A
7. Are there any restraints impacting market growth?
N/A
8. Can you provide examples of recent developments in the market?
N/A
9. What pricing options are available for accessing the report?
Pricing options include single-user, multi-user, and enterprise licenses priced at USD 3950.00, USD 5925.00, and USD 7900.00 respectively.
10. Is the market size provided in terms of value or volume?
The market size is provided in terms of value, measured in million and volume, measured in K.
11. Are there any specific market keywords associated with the report?
Yes, the market keyword associated with the report is "Activated Carbon For Sugar Decolorization," which aids in identifying and referencing the specific market segment covered.
12. How do I determine which pricing option suits my needs best?
The pricing options vary based on user requirements and access needs. Individual users may opt for single-user licenses, while businesses requiring broader access may choose multi-user or enterprise licenses for cost-effective access to the report.
13. Are there any additional resources or data provided in the Activated Carbon For Sugar Decolorization report?
While the report offers comprehensive insights, it's advisable to review the specific contents or supplementary materials provided to ascertain if additional resources or data are available.
14. How can I stay updated on further developments or reports in the Activated Carbon For Sugar Decolorization?
To stay informed about further developments, trends, and reports in the Activated Carbon For Sugar Decolorization, consider subscribing to industry newsletters, following relevant companies and organizations, or regularly checking reputable industry news sources and publications.
Methodology
Step 1 - Identification of Relevant Samples Size from Population Database


Step 2 - Approaches for Defining Global Market Size (Value, Volume* & Price*)

Note*: In applicable scenarios
Step 3 - Data Sources
Primary Research
- Web Analytics
- Survey Reports
- Research Institute
- Latest Research Reports
- Opinion Leaders
Secondary Research
- Annual Reports
- White Paper
- Latest Press Release
- Industry Association
- Paid Database
- Investor Presentations

Step 4 - Data Triangulation
Involves using different sources of information in order to increase the validity of a study
These sources are likely to be stakeholders in a program - participants, other researchers, program staff, other community members, and so on.
Then we put all data in single framework & apply various statistical tools to find out the dynamic on the market.
During the analysis stage, feedback from the stakeholder groups would be compared to determine areas of agreement as well as areas of divergence

