
Key Insights
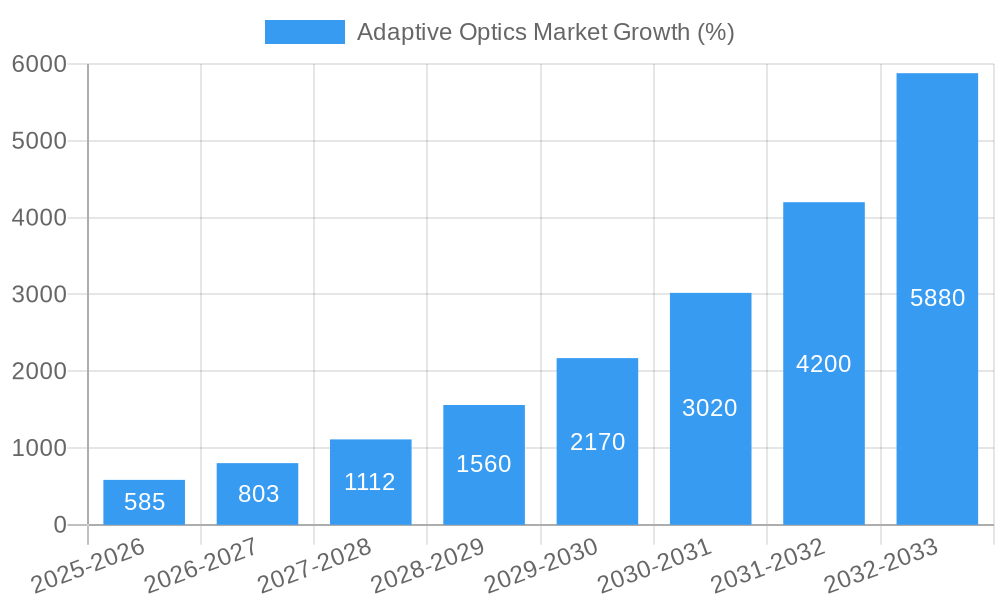
The Adaptive Optics market is experiencing robust growth, projected at a CAGR of 38.90% from 2025 to 2033. This significant expansion is driven by increasing demand across diverse sectors. The military and defense industry utilizes adaptive optics for enhanced targeting and surveillance systems, while the medical sector benefits from improved imaging technologies for ophthalmology and other diagnostic procedures. Industrial applications, such as laser micromachining and precision manufacturing, are also contributing to market growth. Further fueling this expansion is the rising adoption of adaptive optics in consumer electronics, particularly for advanced camera systems and virtual/augmented reality devices, and the burgeoning field of astronomy, where it enables sharper telescopic images. However, the high cost of adaptive optics systems and the complexity of their integration into existing infrastructure present challenges to market penetration. Nevertheless, ongoing technological advancements, such as the development of more compact and cost-effective components, are mitigating these restraints. The market is segmented by end-user industry, with the military & defense, medical, and industrial sectors currently dominating. Geographically, North America and Europe are leading the market, but the Asia-Pacific region is expected to witness substantial growth in the coming years due to increasing investments in research and development and technological advancements in these regions.
The competitive landscape is characterized by a mix of established players and emerging companies. Key players are continuously investing in research and development to enhance product capabilities and expand market reach. Strategic partnerships, mergers, and acquisitions are also common strategies employed to consolidate market share and gain access to new technologies. The forecast period of 2025-2033 presents significant opportunities for growth, with market expansion driven by technological innovations and the increasing demand for high-resolution imaging and precision applications across various sectors. The market is poised for substantial expansion, driven by consistent technological innovation and the diverse applications of adaptive optics across numerous sectors. Ongoing research and development efforts will further propel the market's trajectory, attracting further investment and fostering competition.
Adaptive Optics Market: A Comprehensive Report (2019-2033)
This in-depth report provides a comprehensive analysis of the Adaptive Optics Market, offering invaluable insights for stakeholders across the industry. Covering the period from 2019 to 2033, with a focus on 2025, this report meticulously examines market dynamics, technological advancements, and competitive landscapes, enabling informed strategic decision-making. The study period encompasses the historical period (2019-2024), the base year (2025), and the forecast period (2025-2033). The report value is in Million.
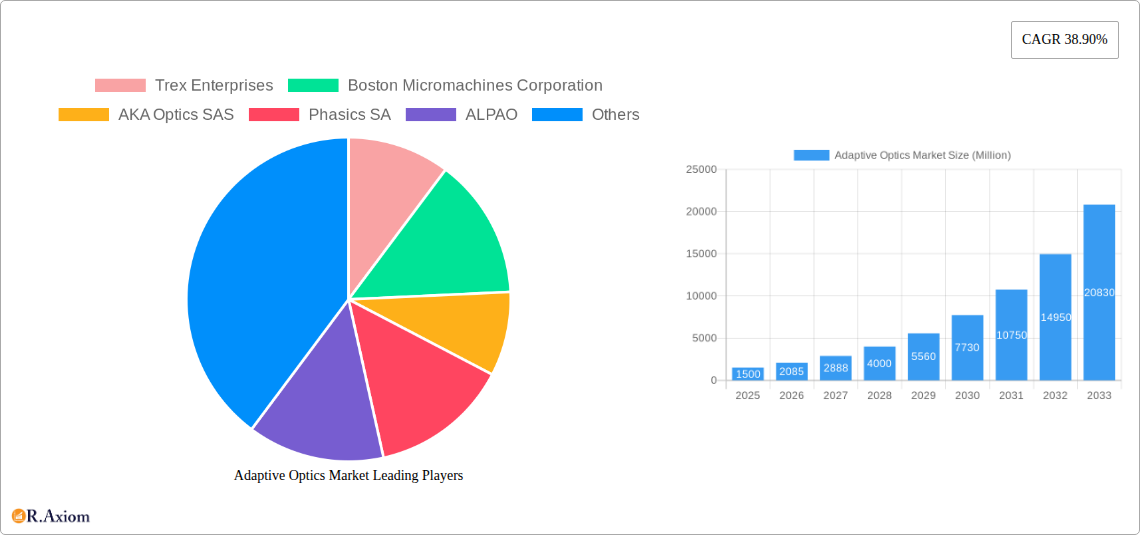
Adaptive Optics Market Market Concentration & Innovation
The Adaptive Optics market exhibits a moderately concentrated landscape, with several key players holding significant market share. Trex Enterprises, Boston Micromachines Corporation, and Northrop Grumman Corporation are among the established players, commanding a combined xx% market share in 2025. However, the market is witnessing increasing innovation, driven by advancements in micro-optics, deformable mirrors, and wavefront sensors. This innovation is fueled by substantial R&D investments from both established players and emerging companies, leading to the development of more compact, efficient, and cost-effective adaptive optics systems. Regulatory frameworks, while generally supportive of technological advancement, vary across regions, influencing market penetration. Product substitutes, such as traditional optical systems, are becoming less competitive due to the superior performance and versatility of adaptive optics, particularly in high-precision applications. Mergers and acquisitions (M&A) activity remains significant, with deal values exceeding xx Million in 2024, suggesting continued consolidation within the market. End-user trends indicate a growing demand for adaptive optics across diverse sectors, driven by applications requiring high-resolution imaging and precise beam control.
- Market Concentration: Top 5 players hold xx% market share (2025).
- M&A Activity: Deal value exceeding xx Million in 2024.
- Innovation Drivers: Advancements in micro-optics, deformable mirrors, and wavefront sensors.
- Regulatory Landscape: Varies by region, influencing market penetration.
Adaptive Optics Market Industry Trends & Insights
The Adaptive Optics market is experiencing robust growth, with a projected CAGR of xx% from 2025 to 2033. This growth is primarily fueled by increasing demand from the astronomy, military & defense, and medical sectors. Technological disruptions, such as the development of novel materials and manufacturing techniques, are driving down costs and enhancing performance. Consumer preferences are shifting toward higher-resolution imaging and improved optical performance, leading to increased adoption of adaptive optics technologies in consumer electronics. Competitive dynamics are characterized by both intense rivalry among established players and the emergence of new entrants focusing on niche applications. Market penetration is highest in the military and defense sector, with significant potential for growth in the medical and consumer electronics sectors. The increasing demand for high-resolution imaging and precision beam control across several industries is expected to propel the growth of the Adaptive Optics market in the coming years.
Dominant Markets & Segments in Adaptive Optics Market
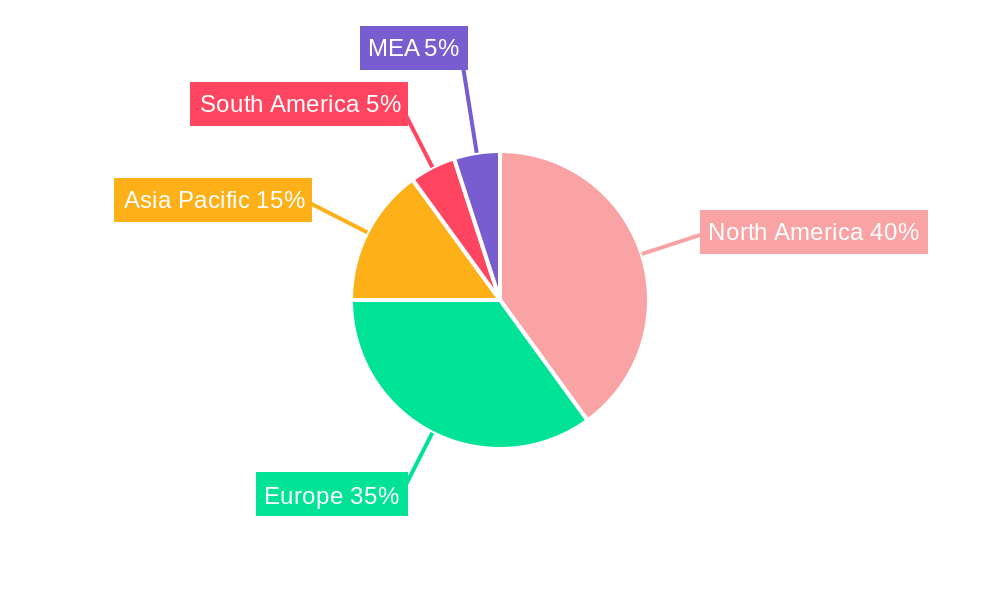
The North American region currently holds the dominant position in the Adaptive Optics market, driven by substantial R&D investments and the presence of major players. Within the end-user segments, the Military & Defence sector exhibits the highest market share, driven by applications in high-resolution imaging, targeting, and surveillance systems. The medical sector is also a key growth driver, fueled by applications in ophthalmology and microscopy. Other significant segments include Astronomy and Industrial applications.
- North America Dominance: Driven by high R&D investment and strong player presence.
- Military & Defence: Highest market share due to applications in high-resolution imaging and surveillance.
- Medical Sector: Significant growth driven by applications in ophthalmology and microscopy.
- Astronomy: Strong demand for high-resolution imaging in astronomical observations.
Adaptive Optics Market Product Developments
Recent years have witnessed significant advancements in adaptive optics technology, including the development of lighter, more compact, and cost-effective systems. These innovations have broadened the applications of adaptive optics across various industries, leading to increased market adoption. Key developments include improvements in deformable mirror technology, wavefront sensor design, and control algorithms. The integration of adaptive optics into existing optical systems is also gaining traction, enhancing overall system performance and functionality. These developments are directly addressing market needs for higher resolution, improved image quality, and enhanced precision in diverse applications.
Report Scope & Segmentation Analysis
This report segments the Adaptive Optics market by end-user industry:
- Military & Defence: This segment is characterized by high growth due to demand for advanced imaging and targeting systems. The market size is projected to reach xx Million by 2033.
- Medical: Driven by advancements in ophthalmology and microscopy, this segment is expected to experience substantial growth, reaching xx Million by 2033.
- Industrial: This segment encompasses applications in various industrial processes, with a projected market size of xx Million by 2033.
- Consumer Electronics: While still nascent, this segment shows significant potential for growth, particularly in high-end cameras and displays.
- Astronomy: A key driver for advanced adaptive optics systems, this segment is expected to reach xx Million by 2033.
- Other End-user Industries: This includes various applications across other sectors, with a projected market size of xx Million by 2033.
Key Drivers of Adaptive Optics Market Growth
Several factors drive the growth of the Adaptive Optics market: advancements in micro-optics and MEMS technology leading to smaller, cheaper systems; increasing demand for high-resolution imaging across diverse industries; government funding for research and development in related areas, particularly in defence and astronomy; and the growing need for precise beam control in laser-based applications.
Challenges in the Adaptive Optics Market Sector
The Adaptive Optics market faces challenges including the high initial cost of implementation, complexities in system integration, and the potential for performance degradation due to environmental factors. Supply chain disruptions, especially concerning specialized components, may also impact market growth.
Emerging Opportunities in Adaptive Optics Market
Emerging opportunities lie in the application of adaptive optics in novel areas, such as augmented reality/virtual reality displays, microscopy for medical diagnosis, and free-space optical communication. Further miniaturization and cost reduction will open up new market segments.
Leading Players in the Adaptive Optics Market Market
- Trex Enterprises
- Boston Micromachines Corporation
- AKA Optics SAS
- Phasics SA
- ALPAO
- Imagine Optics Inc
- CILAS Ariane Group
- Iris AO Inc
- Thorlabs Inc
- Active Optical Systems
- Optos Plc
- Northrop Grumman Corporation
- Flexible Optical B V
Key Developments in Adaptive Optics Market Industry
- January 2023: Trex Enterprises announced the launch of a new high-performance deformable mirror.
- March 2024: Boston Micromachines Corporation secured a major contract for adaptive optics systems from a leading defense contractor.
- June 2025: A partnership was formed between ALPAO and Imagine Optics Inc. for the development of integrated adaptive optics solutions.
Strategic Outlook for Adaptive Optics Market Market
The Adaptive Optics market holds immense potential for future growth, driven by continuous technological advancements and expanding applications across diverse sectors. Further cost reductions, improved integration capabilities, and the development of innovative applications will unlock new market opportunities and propel the market towards significant expansion in the coming years.
Adaptive Optics Market Segmentation
-
1. End-user Industry
- 1.1. Military & Defence
- 1.2. Medical
- 1.3. Industrial
- 1.4. Consumer Electronics
- 1.5. Astronomy
- 1.6. Other End-user Industries
Adaptive Optics Market Segmentation By Geography
- 1. North America
- 2. Europe
- 3. Asia Pacific
- 4. Rest of the World
Adaptive Optics Market REPORT HIGHLIGHTS
| Aspects | Details |
|---|---|
| Study Period | 2019-2033 |
| Base Year | 2024 |
| Estimated Year | 2025 |
| Forecast Period | 2025-2033 |
| Historical Period | 2019-2024 |
| Growth Rate | CAGR of 38.90% from 2019-2033 |
| Segmentation |
|
Table of Contents
- 1. Introduction
- 1.1. Research Scope
- 1.2. Market Segmentation
- 1.3. Research Methodology
- 1.4. Definitions and Assumptions
- 2. Executive Summary
- 2.1. Introduction
- 3. Market Dynamics
- 3.1. Introduction
- 3.2. Market Drivers
- 3.2.1. ; Adoption of Adaptive Optics in Ophthalmology and Retinal Imaging; Increased Government Funding
- 3.3. Market Restrains
- 3.3.1. ; Complex Designing Techniques and High Initial Costs
- 3.4. Market Trends
- 3.4.1. Application in the Field of Astronomy is Expected to Grow Significantly
- 4. Market Factor Analysis
- 4.1. Porters Five Forces
- 4.2. Supply/Value Chain
- 4.3. PESTEL analysis
- 4.4. Market Entropy
- 4.5. Patent/Trademark Analysis
- 5. Global Adaptive Optics Market Analysis, Insights and Forecast, 2019-2031
- 5.1. Market Analysis, Insights and Forecast - by End-user Industry
- 5.1.1. Military & Defence
- 5.1.2. Medical
- 5.1.3. Industrial
- 5.1.4. Consumer Electronics
- 5.1.5. Astronomy
- 5.1.6. Other End-user Industries
- 5.2. Market Analysis, Insights and Forecast - by Region
- 5.2.1. North America
- 5.2.2. Europe
- 5.2.3. Asia Pacific
- 5.2.4. Rest of the World
- 5.1. Market Analysis, Insights and Forecast - by End-user Industry
- 6. North America Adaptive Optics Market Analysis, Insights and Forecast, 2019-2031
- 6.1. Market Analysis, Insights and Forecast - by End-user Industry
- 6.1.1. Military & Defence
- 6.1.2. Medical
- 6.1.3. Industrial
- 6.1.4. Consumer Electronics
- 6.1.5. Astronomy
- 6.1.6. Other End-user Industries
- 6.1. Market Analysis, Insights and Forecast - by End-user Industry
- 7. Europe Adaptive Optics Market Analysis, Insights and Forecast, 2019-2031
- 7.1. Market Analysis, Insights and Forecast - by End-user Industry
- 7.1.1. Military & Defence
- 7.1.2. Medical
- 7.1.3. Industrial
- 7.1.4. Consumer Electronics
- 7.1.5. Astronomy
- 7.1.6. Other End-user Industries
- 7.1. Market Analysis, Insights and Forecast - by End-user Industry
- 8. Asia Pacific Adaptive Optics Market Analysis, Insights and Forecast, 2019-2031
- 8.1. Market Analysis, Insights and Forecast - by End-user Industry
- 8.1.1. Military & Defence
- 8.1.2. Medical
- 8.1.3. Industrial
- 8.1.4. Consumer Electronics
- 8.1.5. Astronomy
- 8.1.6. Other End-user Industries
- 8.1. Market Analysis, Insights and Forecast - by End-user Industry
- 9. Rest of the World Adaptive Optics Market Analysis, Insights and Forecast, 2019-2031
- 9.1. Market Analysis, Insights and Forecast - by End-user Industry
- 9.1.1. Military & Defence
- 9.1.2. Medical
- 9.1.3. Industrial
- 9.1.4. Consumer Electronics
- 9.1.5. Astronomy
- 9.1.6. Other End-user Industries
- 9.1. Market Analysis, Insights and Forecast - by End-user Industry
- 10. North America Adaptive Optics Market Analysis, Insights and Forecast, 2019-2031
- 10.1. Market Analysis, Insights and Forecast - By Country/Sub-region
- 10.1.1 United States
- 10.1.2 Canada
- 10.1.3 Mexico
- 11. Europe Adaptive Optics Market Analysis, Insights and Forecast, 2019-2031
- 11.1. Market Analysis, Insights and Forecast - By Country/Sub-region
- 11.1.1 Germany
- 11.1.2 United Kingdom
- 11.1.3 France
- 11.1.4 Spain
- 11.1.5 Italy
- 11.1.6 Spain
- 11.1.7 Belgium
- 11.1.8 Netherland
- 11.1.9 Nordics
- 11.1.10 Rest of Europe
- 12. Asia Pacific Adaptive Optics Market Analysis, Insights and Forecast, 2019-2031
- 12.1. Market Analysis, Insights and Forecast - By Country/Sub-region
- 12.1.1 China
- 12.1.2 Japan
- 12.1.3 India
- 12.1.4 South Korea
- 12.1.5 Southeast Asia
- 12.1.6 Australia
- 12.1.7 Indonesia
- 12.1.8 Phillipes
- 12.1.9 Singapore
- 12.1.10 Thailandc
- 12.1.11 Rest of Asia Pacific
- 13. South America Adaptive Optics Market Analysis, Insights and Forecast, 2019-2031
- 13.1. Market Analysis, Insights and Forecast - By Country/Sub-region
- 13.1.1 Brazil
- 13.1.2 Argentina
- 13.1.3 Peru
- 13.1.4 Chile
- 13.1.5 Colombia
- 13.1.6 Ecuador
- 13.1.7 Venezuela
- 13.1.8 Rest of South America
- 14. North America Adaptive Optics Market Analysis, Insights and Forecast, 2019-2031
- 14.1. Market Analysis, Insights and Forecast - By Country/Sub-region
- 14.1.1 United States
- 14.1.2 Canada
- 14.1.3 Mexico
- 15. MEA Adaptive Optics Market Analysis, Insights and Forecast, 2019-2031
- 15.1. Market Analysis, Insights and Forecast - By Country/Sub-region
- 15.1.1 United Arab Emirates
- 15.1.2 Saudi Arabia
- 15.1.3 South Africa
- 15.1.4 Rest of Middle East and Africa
- 16. Competitive Analysis
- 16.1. Global Market Share Analysis 2024
- 16.2. Company Profiles
- 16.2.1 Trex Enterprises
- 16.2.1.1. Overview
- 16.2.1.2. Products
- 16.2.1.3. SWOT Analysis
- 16.2.1.4. Recent Developments
- 16.2.1.5. Financials (Based on Availability)
- 16.2.2 Boston Micromachines Corporation
- 16.2.2.1. Overview
- 16.2.2.2. Products
- 16.2.2.3. SWOT Analysis
- 16.2.2.4. Recent Developments
- 16.2.2.5. Financials (Based on Availability)
- 16.2.3 AKA Optics SAS
- 16.2.3.1. Overview
- 16.2.3.2. Products
- 16.2.3.3. SWOT Analysis
- 16.2.3.4. Recent Developments
- 16.2.3.5. Financials (Based on Availability)
- 16.2.4 Phasics SA
- 16.2.4.1. Overview
- 16.2.4.2. Products
- 16.2.4.3. SWOT Analysis
- 16.2.4.4. Recent Developments
- 16.2.4.5. Financials (Based on Availability)
- 16.2.5 ALPAO
- 16.2.5.1. Overview
- 16.2.5.2. Products
- 16.2.5.3. SWOT Analysis
- 16.2.5.4. Recent Developments
- 16.2.5.5. Financials (Based on Availability)
- 16.2.6 Imagine Optics Inc
- 16.2.6.1. Overview
- 16.2.6.2. Products
- 16.2.6.3. SWOT Analysis
- 16.2.6.4. Recent Developments
- 16.2.6.5. Financials (Based on Availability)
- 16.2.7 CILAS Ariane Group
- 16.2.7.1. Overview
- 16.2.7.2. Products
- 16.2.7.3. SWOT Analysis
- 16.2.7.4. Recent Developments
- 16.2.7.5. Financials (Based on Availability)
- 16.2.8 Iris AO Inc
- 16.2.8.1. Overview
- 16.2.8.2. Products
- 16.2.8.3. SWOT Analysis
- 16.2.8.4. Recent Developments
- 16.2.8.5. Financials (Based on Availability)
- 16.2.9 Thorlabs Inc
- 16.2.9.1. Overview
- 16.2.9.2. Products
- 16.2.9.3. SWOT Analysis
- 16.2.9.4. Recent Developments
- 16.2.9.5. Financials (Based on Availability)
- 16.2.10 Active Optical Systems
- 16.2.10.1. Overview
- 16.2.10.2. Products
- 16.2.10.3. SWOT Analysis
- 16.2.10.4. Recent Developments
- 16.2.10.5. Financials (Based on Availability)
- 16.2.11 Optos Plc
- 16.2.11.1. Overview
- 16.2.11.2. Products
- 16.2.11.3. SWOT Analysis
- 16.2.11.4. Recent Developments
- 16.2.11.5. Financials (Based on Availability)
- 16.2.12 Northrop Grumman Corporation
- 16.2.12.1. Overview
- 16.2.12.2. Products
- 16.2.12.3. SWOT Analysis
- 16.2.12.4. Recent Developments
- 16.2.12.5. Financials (Based on Availability)
- 16.2.13 Flexible Optical B V
- 16.2.13.1. Overview
- 16.2.13.2. Products
- 16.2.13.3. SWOT Analysis
- 16.2.13.4. Recent Developments
- 16.2.13.5. Financials (Based on Availability)
- 16.2.1 Trex Enterprises
List of Figures
- Figure 1: Global Adaptive Optics Market Revenue Breakdown (Million, %) by Region 2024 & 2032
- Figure 2: North America Adaptive Optics Market Revenue (Million), by Country 2024 & 2032
- Figure 3: North America Adaptive Optics Market Revenue Share (%), by Country 2024 & 2032
- Figure 4: Europe Adaptive Optics Market Revenue (Million), by Country 2024 & 2032
- Figure 5: Europe Adaptive Optics Market Revenue Share (%), by Country 2024 & 2032
- Figure 6: Asia Pacific Adaptive Optics Market Revenue (Million), by Country 2024 & 2032
- Figure 7: Asia Pacific Adaptive Optics Market Revenue Share (%), by Country 2024 & 2032
- Figure 8: South America Adaptive Optics Market Revenue (Million), by Country 2024 & 2032
- Figure 9: South America Adaptive Optics Market Revenue Share (%), by Country 2024 & 2032
- Figure 10: North America Adaptive Optics Market Revenue (Million), by Country 2024 & 2032
- Figure 11: North America Adaptive Optics Market Revenue Share (%), by Country 2024 & 2032
- Figure 12: MEA Adaptive Optics Market Revenue (Million), by Country 2024 & 2032
- Figure 13: MEA Adaptive Optics Market Revenue Share (%), by Country 2024 & 2032
- Figure 14: North America Adaptive Optics Market Revenue (Million), by End-user Industry 2024 & 2032
- Figure 15: North America Adaptive Optics Market Revenue Share (%), by End-user Industry 2024 & 2032
- Figure 16: North America Adaptive Optics Market Revenue (Million), by Country 2024 & 2032
- Figure 17: North America Adaptive Optics Market Revenue Share (%), by Country 2024 & 2032
- Figure 18: Europe Adaptive Optics Market Revenue (Million), by End-user Industry 2024 & 2032
- Figure 19: Europe Adaptive Optics Market Revenue Share (%), by End-user Industry 2024 & 2032
- Figure 20: Europe Adaptive Optics Market Revenue (Million), by Country 2024 & 2032
- Figure 21: Europe Adaptive Optics Market Revenue Share (%), by Country 2024 & 2032
- Figure 22: Asia Pacific Adaptive Optics Market Revenue (Million), by End-user Industry 2024 & 2032
- Figure 23: Asia Pacific Adaptive Optics Market Revenue Share (%), by End-user Industry 2024 & 2032
- Figure 24: Asia Pacific Adaptive Optics Market Revenue (Million), by Country 2024 & 2032
- Figure 25: Asia Pacific Adaptive Optics Market Revenue Share (%), by Country 2024 & 2032
- Figure 26: Rest of the World Adaptive Optics Market Revenue (Million), by End-user Industry 2024 & 2032
- Figure 27: Rest of the World Adaptive Optics Market Revenue Share (%), by End-user Industry 2024 & 2032
- Figure 28: Rest of the World Adaptive Optics Market Revenue (Million), by Country 2024 & 2032
- Figure 29: Rest of the World Adaptive Optics Market Revenue Share (%), by Country 2024 & 2032
List of Tables
- Table 1: Global Adaptive Optics Market Revenue Million Forecast, by Region 2019 & 2032
- Table 2: Global Adaptive Optics Market Revenue Million Forecast, by End-user Industry 2019 & 2032
- Table 3: Global Adaptive Optics Market Revenue Million Forecast, by Region 2019 & 2032
- Table 4: Global Adaptive Optics Market Revenue Million Forecast, by Country 2019 & 2032
- Table 5: United States Adaptive Optics Market Revenue (Million) Forecast, by Application 2019 & 2032
- Table 6: Canada Adaptive Optics Market Revenue (Million) Forecast, by Application 2019 & 2032
- Table 7: Mexico Adaptive Optics Market Revenue (Million) Forecast, by Application 2019 & 2032
- Table 8: Global Adaptive Optics Market Revenue Million Forecast, by Country 2019 & 2032
- Table 9: Germany Adaptive Optics Market Revenue (Million) Forecast, by Application 2019 & 2032
- Table 10: United Kingdom Adaptive Optics Market Revenue (Million) Forecast, by Application 2019 & 2032
- Table 11: France Adaptive Optics Market Revenue (Million) Forecast, by Application 2019 & 2032
- Table 12: Spain Adaptive Optics Market Revenue (Million) Forecast, by Application 2019 & 2032
- Table 13: Italy Adaptive Optics Market Revenue (Million) Forecast, by Application 2019 & 2032
- Table 14: Spain Adaptive Optics Market Revenue (Million) Forecast, by Application 2019 & 2032
- Table 15: Belgium Adaptive Optics Market Revenue (Million) Forecast, by Application 2019 & 2032
- Table 16: Netherland Adaptive Optics Market Revenue (Million) Forecast, by Application 2019 & 2032
- Table 17: Nordics Adaptive Optics Market Revenue (Million) Forecast, by Application 2019 & 2032
- Table 18: Rest of Europe Adaptive Optics Market Revenue (Million) Forecast, by Application 2019 & 2032
- Table 19: Global Adaptive Optics Market Revenue Million Forecast, by Country 2019 & 2032
- Table 20: China Adaptive Optics Market Revenue (Million) Forecast, by Application 2019 & 2032
- Table 21: Japan Adaptive Optics Market Revenue (Million) Forecast, by Application 2019 & 2032
- Table 22: India Adaptive Optics Market Revenue (Million) Forecast, by Application 2019 & 2032
- Table 23: South Korea Adaptive Optics Market Revenue (Million) Forecast, by Application 2019 & 2032
- Table 24: Southeast Asia Adaptive Optics Market Revenue (Million) Forecast, by Application 2019 & 2032
- Table 25: Australia Adaptive Optics Market Revenue (Million) Forecast, by Application 2019 & 2032
- Table 26: Indonesia Adaptive Optics Market Revenue (Million) Forecast, by Application 2019 & 2032
- Table 27: Phillipes Adaptive Optics Market Revenue (Million) Forecast, by Application 2019 & 2032
- Table 28: Singapore Adaptive Optics Market Revenue (Million) Forecast, by Application 2019 & 2032
- Table 29: Thailandc Adaptive Optics Market Revenue (Million) Forecast, by Application 2019 & 2032
- Table 30: Rest of Asia Pacific Adaptive Optics Market Revenue (Million) Forecast, by Application 2019 & 2032
- Table 31: Global Adaptive Optics Market Revenue Million Forecast, by Country 2019 & 2032
- Table 32: Brazil Adaptive Optics Market Revenue (Million) Forecast, by Application 2019 & 2032
- Table 33: Argentina Adaptive Optics Market Revenue (Million) Forecast, by Application 2019 & 2032
- Table 34: Peru Adaptive Optics Market Revenue (Million) Forecast, by Application 2019 & 2032
- Table 35: Chile Adaptive Optics Market Revenue (Million) Forecast, by Application 2019 & 2032
- Table 36: Colombia Adaptive Optics Market Revenue (Million) Forecast, by Application 2019 & 2032
- Table 37: Ecuador Adaptive Optics Market Revenue (Million) Forecast, by Application 2019 & 2032
- Table 38: Venezuela Adaptive Optics Market Revenue (Million) Forecast, by Application 2019 & 2032
- Table 39: Rest of South America Adaptive Optics Market Revenue (Million) Forecast, by Application 2019 & 2032
- Table 40: Global Adaptive Optics Market Revenue Million Forecast, by Country 2019 & 2032
- Table 41: United States Adaptive Optics Market Revenue (Million) Forecast, by Application 2019 & 2032
- Table 42: Canada Adaptive Optics Market Revenue (Million) Forecast, by Application 2019 & 2032
- Table 43: Mexico Adaptive Optics Market Revenue (Million) Forecast, by Application 2019 & 2032
- Table 44: Global Adaptive Optics Market Revenue Million Forecast, by Country 2019 & 2032
- Table 45: United Arab Emirates Adaptive Optics Market Revenue (Million) Forecast, by Application 2019 & 2032
- Table 46: Saudi Arabia Adaptive Optics Market Revenue (Million) Forecast, by Application 2019 & 2032
- Table 47: South Africa Adaptive Optics Market Revenue (Million) Forecast, by Application 2019 & 2032
- Table 48: Rest of Middle East and Africa Adaptive Optics Market Revenue (Million) Forecast, by Application 2019 & 2032
- Table 49: Global Adaptive Optics Market Revenue Million Forecast, by End-user Industry 2019 & 2032
- Table 50: Global Adaptive Optics Market Revenue Million Forecast, by Country 2019 & 2032
- Table 51: Global Adaptive Optics Market Revenue Million Forecast, by End-user Industry 2019 & 2032
- Table 52: Global Adaptive Optics Market Revenue Million Forecast, by Country 2019 & 2032
- Table 53: Global Adaptive Optics Market Revenue Million Forecast, by End-user Industry 2019 & 2032
- Table 54: Global Adaptive Optics Market Revenue Million Forecast, by Country 2019 & 2032
- Table 55: Global Adaptive Optics Market Revenue Million Forecast, by End-user Industry 2019 & 2032
- Table 56: Global Adaptive Optics Market Revenue Million Forecast, by Country 2019 & 2032
Frequently Asked Questions
1. What is the projected Compound Annual Growth Rate (CAGR) of the Adaptive Optics Market?
The projected CAGR is approximately 38.90%.
2. Which companies are prominent players in the Adaptive Optics Market?
Key companies in the market include Trex Enterprises, Boston Micromachines Corporation, AKA Optics SAS, Phasics SA, ALPAO, Imagine Optics Inc, CILAS Ariane Group, Iris AO Inc, Thorlabs Inc, Active Optical Systems, Optos Plc, Northrop Grumman Corporation, Flexible Optical B V.
3. What are the main segments of the Adaptive Optics Market?
The market segments include End-user Industry.
4. Can you provide details about the market size?
The market size is estimated to be USD XX Million as of 2022.
5. What are some drivers contributing to market growth?
; Adoption of Adaptive Optics in Ophthalmology and Retinal Imaging; Increased Government Funding.
6. What are the notable trends driving market growth?
Application in the Field of Astronomy is Expected to Grow Significantly.
7. Are there any restraints impacting market growth?
; Complex Designing Techniques and High Initial Costs.
8. Can you provide examples of recent developments in the market?
N/A
9. What pricing options are available for accessing the report?
Pricing options include single-user, multi-user, and enterprise licenses priced at USD 4750, USD 5250, and USD 8750 respectively.
10. Is the market size provided in terms of value or volume?
The market size is provided in terms of value, measured in Million.
11. Are there any specific market keywords associated with the report?
Yes, the market keyword associated with the report is "Adaptive Optics Market," which aids in identifying and referencing the specific market segment covered.
12. How do I determine which pricing option suits my needs best?
The pricing options vary based on user requirements and access needs. Individual users may opt for single-user licenses, while businesses requiring broader access may choose multi-user or enterprise licenses for cost-effective access to the report.
13. Are there any additional resources or data provided in the Adaptive Optics Market report?
While the report offers comprehensive insights, it's advisable to review the specific contents or supplementary materials provided to ascertain if additional resources or data are available.
14. How can I stay updated on further developments or reports in the Adaptive Optics Market?
To stay informed about further developments, trends, and reports in the Adaptive Optics Market, consider subscribing to industry newsletters, following relevant companies and organizations, or regularly checking reputable industry news sources and publications.
Methodology
Step 1 - Identification of Relevant Samples Size from Population Database


Step 2 - Approaches for Defining Global Market Size (Value, Volume* & Price*)

Note*: In applicable scenarios
Step 3 - Data Sources
Primary Research
- Web Analytics
- Survey Reports
- Research Institute
- Latest Research Reports
- Opinion Leaders
Secondary Research
- Annual Reports
- White Paper
- Latest Press Release
- Industry Association
- Paid Database
- Investor Presentations

Step 4 - Data Triangulation
Involves using different sources of information in order to increase the validity of a study
These sources are likely to be stakeholders in a program - participants, other researchers, program staff, other community members, and so on.
Then we put all data in single framework & apply various statistical tools to find out the dynamic on the market.
During the analysis stage, feedback from the stakeholder groups would be compared to determine areas of agreement as well as areas of divergence


