
Key Insights
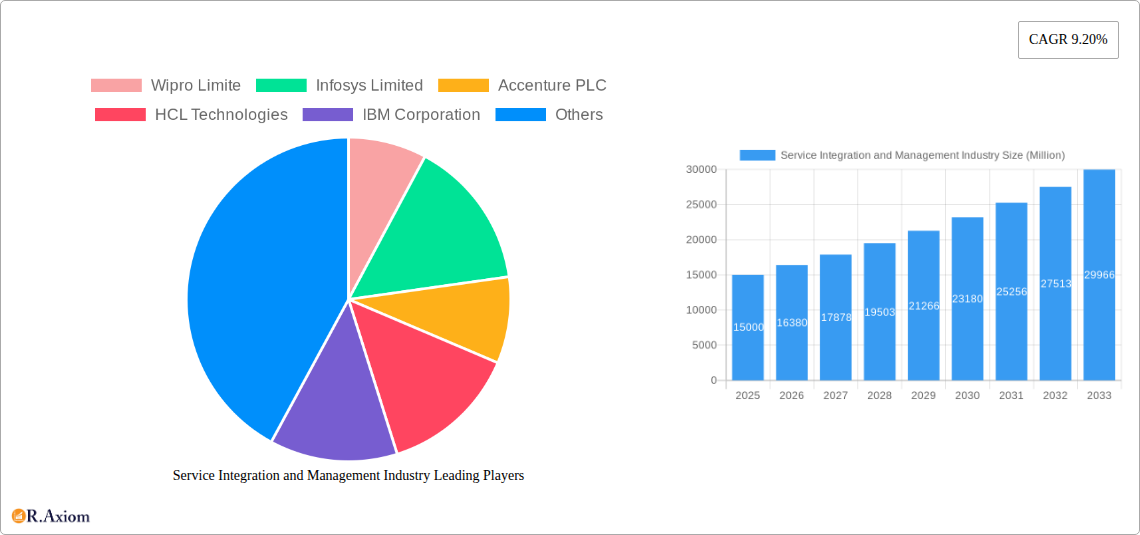
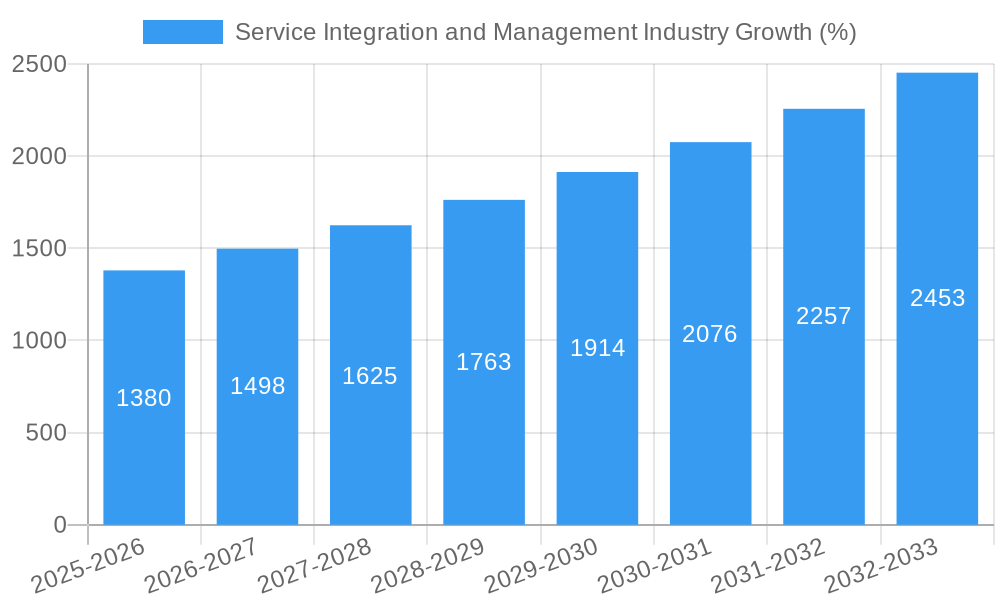
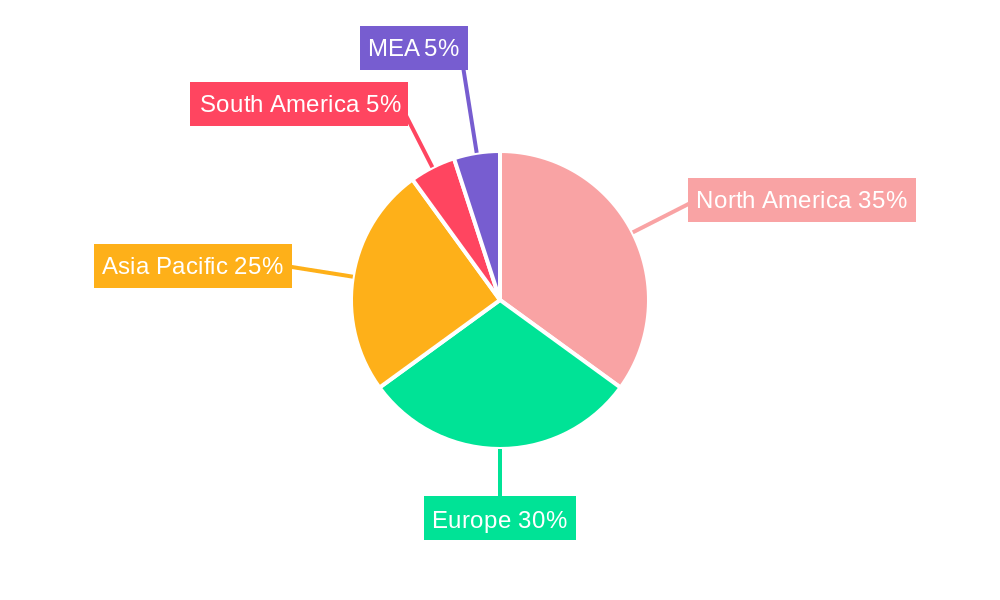
The Service Integration and Management (SIAM) market is experiencing robust growth, projected at a Compound Annual Growth Rate (CAGR) of 9.20% from 2025 to 2033. This expansion is driven by the increasing complexity of IT infrastructures, the rising adoption of cloud computing and hybrid models, and the growing need for improved service delivery and cost optimization across organizations. Businesses are increasingly outsourcing their IT management to focus on core competencies, leading to a surge in demand for SIAM solutions that streamline IT operations and improve collaboration between internal IT teams and external service providers. The market is segmented by component (solutions and services), organization size (SMEs and large enterprises), and end-user industry (BFSI, IT & Telecom, Healthcare, Retail, and others). Large enterprises currently dominate the market due to their greater resources and need for sophisticated IT management, but the SME segment shows significant growth potential as these businesses increasingly adopt advanced technologies. Geographically, North America and Europe are currently the leading markets, but the Asia-Pacific region is expected to witness substantial growth fueled by the increasing digitalization and adoption of cloud-based services.
The competitive landscape is characterized by a mix of established players and emerging providers. Major players like Wipro, Infosys, Accenture, HCL Technologies, IBM, Capgemini, HPE, Fujitsu, Mindtree, and Atos are actively investing in innovation and expanding their service portfolios to cater to evolving market demands. Strategic partnerships and acquisitions are prevalent as companies strive to enhance their service offerings and gain a competitive edge. While the market faces challenges such as integration complexities and the need for skilled professionals, the overall growth outlook remains positive. The increasing adoption of automation and artificial intelligence (AI) in SIAM is expected to further accelerate market expansion in the coming years, driving increased efficiency and reduced operational costs for businesses. Future growth will largely depend on the rate of digital transformation across diverse sectors and ongoing investment in advanced technologies aimed at optimizing IT service management.
This comprehensive report provides an in-depth analysis of the Service Integration and Management (SIAM) industry, offering actionable insights for stakeholders across the value chain. With a study period spanning 2019-2033, a base year of 2025, and a forecast period of 2025-2033, this report leverages historical data (2019-2024) to project future market trends and opportunities. The report covers key market segments, competitive dynamics, and emerging technologies, providing a holistic view of the SIAM landscape. The market size is estimated at xx Million for 2025, with a projected CAGR of xx% during the forecast period.
Service Integration and Management Industry Market Concentration & Innovation
The SIAM industry exhibits a moderately concentrated market structure, with a few major players holding significant market share. Companies like Wipro Limited, Infosys Limited, Accenture PLC, HCL Technologies, IBM Corporation, Capgemini SE, and Hewlett Packard Enterprise (HPE) dominate the landscape, collectively accounting for an estimated xx% of the global market in 2025. However, the market also features several smaller, specialized players contributing to innovation and competition.
- Market Share: Accenture PLC holds the largest market share, estimated at xx%, followed by IBM Corporation at xx% and Infosys Limited at xx%.
- Innovation Drivers: Cloud computing, automation, AI, and the increasing adoption of digital transformation initiatives are key drivers of innovation in the SIAM space.
- Regulatory Frameworks: Compliance requirements (e.g., GDPR, HIPAA) are influencing SIAM adoption and driving demand for secure and compliant solutions.
- Product Substitutes: While direct substitutes are limited, organizations may opt for in-house IT management or smaller, specialized service providers depending on their specific needs.
- End-User Trends: Growing demand for improved IT service efficiency, reduced operational costs, and enhanced service quality are pushing adoption of SIAM solutions.
- M&A Activities: The SIAM industry has witnessed significant M&A activity in recent years, with deals focused on expanding service portfolios, gaining market share, and acquiring specialized technologies. The total value of M&A deals during the historical period is estimated at xx Million.
Service Integration and Management Industry Industry Trends & Insights
The SIAM market is experiencing robust growth, driven by the increasing complexity of IT environments, the growing adoption of cloud technologies, and the rising need for efficient IT service management. The market is undergoing significant transformation due to technological disruptions, changing consumer preferences, and intense competitive dynamics. Several factors are contributing to market expansion, including the rise of hybrid cloud environments, increasing adoption of AI-powered automation, and the need to improve IT agility. This leads to a higher demand for integrated service management solutions that provide end-to-end visibility, control, and optimization across diverse IT landscapes. The CAGR for the period 2025-2033 is projected at xx%, with a market penetration rate reaching xx% by 2033.
Dominant Markets & Segments in Service Integration and Management Industry
The SIAM market exhibits varied growth across different segments and geographies.
By Component: The Solutions segment currently holds a larger market share than the Services segment, driven by the increasing demand for comprehensive SIAM platforms. However, the Services segment is expected to experience faster growth during the forecast period due to the rising need for customized SIAM implementations and managed services.
By Organization Size: Large enterprises dominate the market due to their complex IT infrastructures and higher budgets for IT management. However, SMEs are increasingly adopting SIAM solutions due to the increasing availability of cost-effective solutions and the benefits of improved IT efficiency.
By End-user Industry: The BFSI (Banking, Financial Services, and Insurance) sector currently holds the largest market share, followed by the IT and Telecom sector and Healthcare. BFSI’s stringent regulatory compliance requirements and high reliance on technology drive significant adoption. The Healthcare sector is experiencing rapid growth due to the increasing adoption of digital health initiatives and the need for secure and reliable IT infrastructure.
Key Drivers (by Segment):
- BFSI: Stringent regulatory compliance, high reliance on technology, need for enhanced security.
- IT & Telecom: Complex IT infrastructure, need for improved service efficiency, high demand for innovation.
- Healthcare: Increasing adoption of digital health initiatives, need for secure and reliable IT infrastructure, regulatory compliance.
- Large Enterprises: Complex IT environments, high IT budgets, need for improved IT efficiency.
Service Integration and Management Industry Product Developments
Recent product innovations focus on AI-driven automation, integrated dashboards for improved visibility, and enhanced security features to address the evolving needs of organizations. These advancements offer significant competitive advantages by increasing efficiency, reducing costs, and enhancing the overall user experience, leading to improved market fit and increased adoption rates. The integration of cloud-based platforms and the incorporation of advanced analytics capabilities are key features driving market adoption.
Report Scope & Segmentation Analysis
This report segments the SIAM market by Component (Solutions, Services), Organization Size (SMEs, Large Enterprises), and End-user Industry (BFSI, IT & Telecom, Healthcare, Retail, Other). Each segment's growth projections, market sizes, and competitive dynamics are detailed within the full report. The market is expected to grow significantly due to the rising demand for efficient and cost-effective IT service management solutions. Competitive dynamics are shaped by the presence of both established players and emerging niche providers.
Key Drivers of Service Integration and Management Industry Growth
The growth of the SIAM industry is fueled by several key factors:
- Technological advancements: Cloud computing, automation, AI, and big data analytics are transforming IT service management, leading to higher efficiency and cost savings.
- Economic factors: The increasing focus on cost optimization and improved operational efficiency within organizations drives the adoption of SIAM solutions.
- Regulatory compliance: Stringent regulations across industries mandate improved IT security and compliance, which SIAM solutions effectively address.
Challenges in the Service Integration and Management Industry Sector
Several challenges hinder the growth of the SIAM industry:
- Integration complexities: Integrating diverse IT systems and services can be complex and time-consuming.
- Skills gap: Finding and retaining skilled professionals with expertise in SIAM solutions remains a challenge.
- High initial investment: Implementing SIAM solutions requires significant upfront investment, potentially deterring some organizations. This has resulted in a xx Million loss in potential revenue during the historical period.
Emerging Opportunities in Service Integration and Management Industry
Several emerging opportunities exist for growth in the SIAM industry:
- Expansion into new markets: Untapped markets in developing economies present significant growth potential.
- Adoption of new technologies: Emerging technologies like IoT and blockchain offer opportunities for innovation and enhanced service capabilities.
- Focus on customer experience: Improved customer service and user experience are key differentiators in a competitive market.
Leading Players in the Service Integration and Management Industry Market
- Wipro Limited
- Infosys Limited
- Accenture PLC
- HCL Technologies
- IBM Corporation
- Capgemini SE
- Hewlett Packard Enterprise (HPE)
- Fujitsu Limited
- Mindtree Limited
- AtoS SE
Key Developments in Service Integration and Management Industry Industry
August 2021: Perspecta Enterprise Solutions LLC, in collaboration with Capgemini Government Solutions LLC, was awarded a USD 2 billion BPA for the Military Health System Enterprise Information Technology Services Integrator (EITSI). This contract significantly impacts the government sector's SIAM market, showcasing the increasing adoption of multi-sourcing strategies for large-scale IT transformation projects.
March 2020: Infosys and IBM partnered to accelerate digital transformation for businesses using IBM cloud services. This partnership is a key development, highlighting the increasing reliance on cloud-based solutions and collaborative efforts to drive digital transformation within the BFSI and healthcare sectors.
Strategic Outlook for Service Integration and Management Industry Market
The SIAM market is poised for continued growth, driven by the increasing need for efficient and secure IT service management. Future growth will be fueled by the adoption of advanced technologies, expansion into new markets, and a focus on customer experience. The rising demand for integrated solutions, coupled with the ongoing digital transformation efforts across various sectors, presents significant opportunities for both established players and new entrants in the market. The market is expected to reach xx Million by 2033, offering substantial growth potential for industry stakeholders.
Service Integration and Management Industry Segmentation
-
1. Component
-
1.1. Solutions
- 1.1.1. Business Solutions
- 1.1.2. Technology Solutions
- 1.2. Services
-
1.1. Solutions
-
2. Organization Size
- 2.1. Small and Medium Enterprises
- 2.2. Large Enterprises
-
3. End user Industry
- 3.1. BFSI
- 3.2. IT and Telecom
- 3.3. Healthcare
- 3.4. Retail
- 3.5. Other End-user Industries
Service Integration and Management Industry Segmentation By Geography
- 1. North America
- 2. Europe
- 3. Asia Pacific
- 4. Rest of the World
Service Integration and Management Industry REPORT HIGHLIGHTS
| Aspects | Details |
|---|---|
| Study Period | 2019-2033 |
| Base Year | 2024 |
| Estimated Year | 2025 |
| Forecast Period | 2025-2033 |
| Historical Period | 2019-2024 |
| Growth Rate | CAGR of 9.20% from 2019-2033 |
| Segmentation |
|
Table of Contents
- 1. Introduction
- 1.1. Research Scope
- 1.2. Market Segmentation
- 1.3. Research Methodology
- 1.4. Definitions and Assumptions
- 2. Executive Summary
- 2.1. Introduction
- 3. Market Dynamics
- 3.1. Introduction
- 3.2. Market Drivers
- 3.2.1. Increasing Complexities of Service Management; Increasing Demand for Multi-Vendor Outsourcing
- 3.3. Market Restrains
- 3.3.1. Lack of Uniform SLAs and Regulatory Compliances
- 3.4. Market Trends
- 3.4.1. Cloud Technology to witness significant growth
- 4. Market Factor Analysis
- 4.1. Porters Five Forces
- 4.2. Supply/Value Chain
- 4.3. PESTEL analysis
- 4.4. Market Entropy
- 4.5. Patent/Trademark Analysis
- 5. Global Service Integration and Management Industry Analysis, Insights and Forecast, 2019-2031
- 5.1. Market Analysis, Insights and Forecast - by Component
- 5.1.1. Solutions
- 5.1.1.1. Business Solutions
- 5.1.1.2. Technology Solutions
- 5.1.2. Services
- 5.1.1. Solutions
- 5.2. Market Analysis, Insights and Forecast - by Organization Size
- 5.2.1. Small and Medium Enterprises
- 5.2.2. Large Enterprises
- 5.3. Market Analysis, Insights and Forecast - by End user Industry
- 5.3.1. BFSI
- 5.3.2. IT and Telecom
- 5.3.3. Healthcare
- 5.3.4. Retail
- 5.3.5. Other End-user Industries
- 5.4. Market Analysis, Insights and Forecast - by Region
- 5.4.1. North America
- 5.4.2. Europe
- 5.4.3. Asia Pacific
- 5.4.4. Rest of the World
- 5.1. Market Analysis, Insights and Forecast - by Component
- 6. North America Service Integration and Management Industry Analysis, Insights and Forecast, 2019-2031
- 6.1. Market Analysis, Insights and Forecast - by Component
- 6.1.1. Solutions
- 6.1.1.1. Business Solutions
- 6.1.1.2. Technology Solutions
- 6.1.2. Services
- 6.1.1. Solutions
- 6.2. Market Analysis, Insights and Forecast - by Organization Size
- 6.2.1. Small and Medium Enterprises
- 6.2.2. Large Enterprises
- 6.3. Market Analysis, Insights and Forecast - by End user Industry
- 6.3.1. BFSI
- 6.3.2. IT and Telecom
- 6.3.3. Healthcare
- 6.3.4. Retail
- 6.3.5. Other End-user Industries
- 6.1. Market Analysis, Insights and Forecast - by Component
- 7. Europe Service Integration and Management Industry Analysis, Insights and Forecast, 2019-2031
- 7.1. Market Analysis, Insights and Forecast - by Component
- 7.1.1. Solutions
- 7.1.1.1. Business Solutions
- 7.1.1.2. Technology Solutions
- 7.1.2. Services
- 7.1.1. Solutions
- 7.2. Market Analysis, Insights and Forecast - by Organization Size
- 7.2.1. Small and Medium Enterprises
- 7.2.2. Large Enterprises
- 7.3. Market Analysis, Insights and Forecast - by End user Industry
- 7.3.1. BFSI
- 7.3.2. IT and Telecom
- 7.3.3. Healthcare
- 7.3.4. Retail
- 7.3.5. Other End-user Industries
- 7.1. Market Analysis, Insights and Forecast - by Component
- 8. Asia Pacific Service Integration and Management Industry Analysis, Insights and Forecast, 2019-2031
- 8.1. Market Analysis, Insights and Forecast - by Component
- 8.1.1. Solutions
- 8.1.1.1. Business Solutions
- 8.1.1.2. Technology Solutions
- 8.1.2. Services
- 8.1.1. Solutions
- 8.2. Market Analysis, Insights and Forecast - by Organization Size
- 8.2.1. Small and Medium Enterprises
- 8.2.2. Large Enterprises
- 8.3. Market Analysis, Insights and Forecast - by End user Industry
- 8.3.1. BFSI
- 8.3.2. IT and Telecom
- 8.3.3. Healthcare
- 8.3.4. Retail
- 8.3.5. Other End-user Industries
- 8.1. Market Analysis, Insights and Forecast - by Component
- 9. Rest of the World Service Integration and Management Industry Analysis, Insights and Forecast, 2019-2031
- 9.1. Market Analysis, Insights and Forecast - by Component
- 9.1.1. Solutions
- 9.1.1.1. Business Solutions
- 9.1.1.2. Technology Solutions
- 9.1.2. Services
- 9.1.1. Solutions
- 9.2. Market Analysis, Insights and Forecast - by Organization Size
- 9.2.1. Small and Medium Enterprises
- 9.2.2. Large Enterprises
- 9.3. Market Analysis, Insights and Forecast - by End user Industry
- 9.3.1. BFSI
- 9.3.2. IT and Telecom
- 9.3.3. Healthcare
- 9.3.4. Retail
- 9.3.5. Other End-user Industries
- 9.1. Market Analysis, Insights and Forecast - by Component
- 10. North America Service Integration and Management Industry Analysis, Insights and Forecast, 2019-2031
- 10.1. Market Analysis, Insights and Forecast - By Country/Sub-region
- 10.1.1 United States
- 10.1.2 Canada
- 10.1.3 Mexico
- 11. Europe Service Integration and Management Industry Analysis, Insights and Forecast, 2019-2031
- 11.1. Market Analysis, Insights and Forecast - By Country/Sub-region
- 11.1.1 Germany
- 11.1.2 United Kingdom
- 11.1.3 France
- 11.1.4 Spain
- 11.1.5 Italy
- 11.1.6 Spain
- 11.1.7 Belgium
- 11.1.8 Netherland
- 11.1.9 Nordics
- 11.1.10 Rest of Europe
- 12. Asia Pacific Service Integration and Management Industry Analysis, Insights and Forecast, 2019-2031
- 12.1. Market Analysis, Insights and Forecast - By Country/Sub-region
- 12.1.1 China
- 12.1.2 Japan
- 12.1.3 India
- 12.1.4 South Korea
- 12.1.5 Southeast Asia
- 12.1.6 Australia
- 12.1.7 Indonesia
- 12.1.8 Phillipes
- 12.1.9 Singapore
- 12.1.10 Thailandc
- 12.1.11 Rest of Asia Pacific
- 13. South America Service Integration and Management Industry Analysis, Insights and Forecast, 2019-2031
- 13.1. Market Analysis, Insights and Forecast - By Country/Sub-region
- 13.1.1 Brazil
- 13.1.2 Argentina
- 13.1.3 Peru
- 13.1.4 Chile
- 13.1.5 Colombia
- 13.1.6 Ecuador
- 13.1.7 Venezuela
- 13.1.8 Rest of South America
- 14. North America Service Integration and Management Industry Analysis, Insights and Forecast, 2019-2031
- 14.1. Market Analysis, Insights and Forecast - By Country/Sub-region
- 14.1.1 United States
- 14.1.2 Canada
- 14.1.3 Mexico
- 15. MEA Service Integration and Management Industry Analysis, Insights and Forecast, 2019-2031
- 15.1. Market Analysis, Insights and Forecast - By Country/Sub-region
- 15.1.1 United Arab Emirates
- 15.1.2 Saudi Arabia
- 15.1.3 South Africa
- 15.1.4 Rest of Middle East and Africa
- 16. Competitive Analysis
- 16.1. Global Market Share Analysis 2024
- 16.2. Company Profiles
- 16.2.1 Wipro Limite
- 16.2.1.1. Overview
- 16.2.1.2. Products
- 16.2.1.3. SWOT Analysis
- 16.2.1.4. Recent Developments
- 16.2.1.5. Financials (Based on Availability)
- 16.2.2 Infosys Limited
- 16.2.2.1. Overview
- 16.2.2.2. Products
- 16.2.2.3. SWOT Analysis
- 16.2.2.4. Recent Developments
- 16.2.2.5. Financials (Based on Availability)
- 16.2.3 Accenture PLC
- 16.2.3.1. Overview
- 16.2.3.2. Products
- 16.2.3.3. SWOT Analysis
- 16.2.3.4. Recent Developments
- 16.2.3.5. Financials (Based on Availability)
- 16.2.4 HCL Technologies
- 16.2.4.1. Overview
- 16.2.4.2. Products
- 16.2.4.3. SWOT Analysis
- 16.2.4.4. Recent Developments
- 16.2.4.5. Financials (Based on Availability)
- 16.2.5 IBM Corporation
- 16.2.5.1. Overview
- 16.2.5.2. Products
- 16.2.5.3. SWOT Analysis
- 16.2.5.4. Recent Developments
- 16.2.5.5. Financials (Based on Availability)
- 16.2.6 Capgemini SE
- 16.2.6.1. Overview
- 16.2.6.2. Products
- 16.2.6.3. SWOT Analysis
- 16.2.6.4. Recent Developments
- 16.2.6.5. Financials (Based on Availability)
- 16.2.7 Hewlett Packard Enterprise (HPE)
- 16.2.7.1. Overview
- 16.2.7.2. Products
- 16.2.7.3. SWOT Analysis
- 16.2.7.4. Recent Developments
- 16.2.7.5. Financials (Based on Availability)
- 16.2.8 Fujitsu Limited
- 16.2.8.1. Overview
- 16.2.8.2. Products
- 16.2.8.3. SWOT Analysis
- 16.2.8.4. Recent Developments
- 16.2.8.5. Financials (Based on Availability)
- 16.2.9 Mindtree Limited
- 16.2.9.1. Overview
- 16.2.9.2. Products
- 16.2.9.3. SWOT Analysis
- 16.2.9.4. Recent Developments
- 16.2.9.5. Financials (Based on Availability)
- 16.2.10 AtoS SE
- 16.2.10.1. Overview
- 16.2.10.2. Products
- 16.2.10.3. SWOT Analysis
- 16.2.10.4. Recent Developments
- 16.2.10.5. Financials (Based on Availability)
- 16.2.1 Wipro Limite
List of Figures
- Figure 1: Global Service Integration and Management Industry Revenue Breakdown (Million, %) by Region 2024 & 2032
- Figure 2: North America Service Integration and Management Industry Revenue (Million), by Country 2024 & 2032
- Figure 3: North America Service Integration and Management Industry Revenue Share (%), by Country 2024 & 2032
- Figure 4: Europe Service Integration and Management Industry Revenue (Million), by Country 2024 & 2032
- Figure 5: Europe Service Integration and Management Industry Revenue Share (%), by Country 2024 & 2032
- Figure 6: Asia Pacific Service Integration and Management Industry Revenue (Million), by Country 2024 & 2032
- Figure 7: Asia Pacific Service Integration and Management Industry Revenue Share (%), by Country 2024 & 2032
- Figure 8: South America Service Integration and Management Industry Revenue (Million), by Country 2024 & 2032
- Figure 9: South America Service Integration and Management Industry Revenue Share (%), by Country 2024 & 2032
- Figure 10: North America Service Integration and Management Industry Revenue (Million), by Country 2024 & 2032
- Figure 11: North America Service Integration and Management Industry Revenue Share (%), by Country 2024 & 2032
- Figure 12: MEA Service Integration and Management Industry Revenue (Million), by Country 2024 & 2032
- Figure 13: MEA Service Integration and Management Industry Revenue Share (%), by Country 2024 & 2032
- Figure 14: North America Service Integration and Management Industry Revenue (Million), by Component 2024 & 2032
- Figure 15: North America Service Integration and Management Industry Revenue Share (%), by Component 2024 & 2032
- Figure 16: North America Service Integration and Management Industry Revenue (Million), by Organization Size 2024 & 2032
- Figure 17: North America Service Integration and Management Industry Revenue Share (%), by Organization Size 2024 & 2032
- Figure 18: North America Service Integration and Management Industry Revenue (Million), by End user Industry 2024 & 2032
- Figure 19: North America Service Integration and Management Industry Revenue Share (%), by End user Industry 2024 & 2032
- Figure 20: North America Service Integration and Management Industry Revenue (Million), by Country 2024 & 2032
- Figure 21: North America Service Integration and Management Industry Revenue Share (%), by Country 2024 & 2032
- Figure 22: Europe Service Integration and Management Industry Revenue (Million), by Component 2024 & 2032
- Figure 23: Europe Service Integration and Management Industry Revenue Share (%), by Component 2024 & 2032
- Figure 24: Europe Service Integration and Management Industry Revenue (Million), by Organization Size 2024 & 2032
- Figure 25: Europe Service Integration and Management Industry Revenue Share (%), by Organization Size 2024 & 2032
- Figure 26: Europe Service Integration and Management Industry Revenue (Million), by End user Industry 2024 & 2032
- Figure 27: Europe Service Integration and Management Industry Revenue Share (%), by End user Industry 2024 & 2032
- Figure 28: Europe Service Integration and Management Industry Revenue (Million), by Country 2024 & 2032
- Figure 29: Europe Service Integration and Management Industry Revenue Share (%), by Country 2024 & 2032
- Figure 30: Asia Pacific Service Integration and Management Industry Revenue (Million), by Component 2024 & 2032
- Figure 31: Asia Pacific Service Integration and Management Industry Revenue Share (%), by Component 2024 & 2032
- Figure 32: Asia Pacific Service Integration and Management Industry Revenue (Million), by Organization Size 2024 & 2032
- Figure 33: Asia Pacific Service Integration and Management Industry Revenue Share (%), by Organization Size 2024 & 2032
- Figure 34: Asia Pacific Service Integration and Management Industry Revenue (Million), by End user Industry 2024 & 2032
- Figure 35: Asia Pacific Service Integration and Management Industry Revenue Share (%), by End user Industry 2024 & 2032
- Figure 36: Asia Pacific Service Integration and Management Industry Revenue (Million), by Country 2024 & 2032
- Figure 37: Asia Pacific Service Integration and Management Industry Revenue Share (%), by Country 2024 & 2032
- Figure 38: Rest of the World Service Integration and Management Industry Revenue (Million), by Component 2024 & 2032
- Figure 39: Rest of the World Service Integration and Management Industry Revenue Share (%), by Component 2024 & 2032
- Figure 40: Rest of the World Service Integration and Management Industry Revenue (Million), by Organization Size 2024 & 2032
- Figure 41: Rest of the World Service Integration and Management Industry Revenue Share (%), by Organization Size 2024 & 2032
- Figure 42: Rest of the World Service Integration and Management Industry Revenue (Million), by End user Industry 2024 & 2032
- Figure 43: Rest of the World Service Integration and Management Industry Revenue Share (%), by End user Industry 2024 & 2032
- Figure 44: Rest of the World Service Integration and Management Industry Revenue (Million), by Country 2024 & 2032
- Figure 45: Rest of the World Service Integration and Management Industry Revenue Share (%), by Country 2024 & 2032
List of Tables
- Table 1: Global Service Integration and Management Industry Revenue Million Forecast, by Region 2019 & 2032
- Table 2: Global Service Integration and Management Industry Revenue Million Forecast, by Component 2019 & 2032
- Table 3: Global Service Integration and Management Industry Revenue Million Forecast, by Organization Size 2019 & 2032
- Table 4: Global Service Integration and Management Industry Revenue Million Forecast, by End user Industry 2019 & 2032
- Table 5: Global Service Integration and Management Industry Revenue Million Forecast, by Region 2019 & 2032
- Table 6: Global Service Integration and Management Industry Revenue Million Forecast, by Country 2019 & 2032
- Table 7: United States Service Integration and Management Industry Revenue (Million) Forecast, by Application 2019 & 2032
- Table 8: Canada Service Integration and Management Industry Revenue (Million) Forecast, by Application 2019 & 2032
- Table 9: Mexico Service Integration and Management Industry Revenue (Million) Forecast, by Application 2019 & 2032
- Table 10: Global Service Integration and Management Industry Revenue Million Forecast, by Country 2019 & 2032
- Table 11: Germany Service Integration and Management Industry Revenue (Million) Forecast, by Application 2019 & 2032
- Table 12: United Kingdom Service Integration and Management Industry Revenue (Million) Forecast, by Application 2019 & 2032
- Table 13: France Service Integration and Management Industry Revenue (Million) Forecast, by Application 2019 & 2032
- Table 14: Spain Service Integration and Management Industry Revenue (Million) Forecast, by Application 2019 & 2032
- Table 15: Italy Service Integration and Management Industry Revenue (Million) Forecast, by Application 2019 & 2032
- Table 16: Spain Service Integration and Management Industry Revenue (Million) Forecast, by Application 2019 & 2032
- Table 17: Belgium Service Integration and Management Industry Revenue (Million) Forecast, by Application 2019 & 2032
- Table 18: Netherland Service Integration and Management Industry Revenue (Million) Forecast, by Application 2019 & 2032
- Table 19: Nordics Service Integration and Management Industry Revenue (Million) Forecast, by Application 2019 & 2032
- Table 20: Rest of Europe Service Integration and Management Industry Revenue (Million) Forecast, by Application 2019 & 2032
- Table 21: Global Service Integration and Management Industry Revenue Million Forecast, by Country 2019 & 2032
- Table 22: China Service Integration and Management Industry Revenue (Million) Forecast, by Application 2019 & 2032
- Table 23: Japan Service Integration and Management Industry Revenue (Million) Forecast, by Application 2019 & 2032
- Table 24: India Service Integration and Management Industry Revenue (Million) Forecast, by Application 2019 & 2032
- Table 25: South Korea Service Integration and Management Industry Revenue (Million) Forecast, by Application 2019 & 2032
- Table 26: Southeast Asia Service Integration and Management Industry Revenue (Million) Forecast, by Application 2019 & 2032
- Table 27: Australia Service Integration and Management Industry Revenue (Million) Forecast, by Application 2019 & 2032
- Table 28: Indonesia Service Integration and Management Industry Revenue (Million) Forecast, by Application 2019 & 2032
- Table 29: Phillipes Service Integration and Management Industry Revenue (Million) Forecast, by Application 2019 & 2032
- Table 30: Singapore Service Integration and Management Industry Revenue (Million) Forecast, by Application 2019 & 2032
- Table 31: Thailandc Service Integration and Management Industry Revenue (Million) Forecast, by Application 2019 & 2032
- Table 32: Rest of Asia Pacific Service Integration and Management Industry Revenue (Million) Forecast, by Application 2019 & 2032
- Table 33: Global Service Integration and Management Industry Revenue Million Forecast, by Country 2019 & 2032
- Table 34: Brazil Service Integration and Management Industry Revenue (Million) Forecast, by Application 2019 & 2032
- Table 35: Argentina Service Integration and Management Industry Revenue (Million) Forecast, by Application 2019 & 2032
- Table 36: Peru Service Integration and Management Industry Revenue (Million) Forecast, by Application 2019 & 2032
- Table 37: Chile Service Integration and Management Industry Revenue (Million) Forecast, by Application 2019 & 2032
- Table 38: Colombia Service Integration and Management Industry Revenue (Million) Forecast, by Application 2019 & 2032
- Table 39: Ecuador Service Integration and Management Industry Revenue (Million) Forecast, by Application 2019 & 2032
- Table 40: Venezuela Service Integration and Management Industry Revenue (Million) Forecast, by Application 2019 & 2032
- Table 41: Rest of South America Service Integration and Management Industry Revenue (Million) Forecast, by Application 2019 & 2032
- Table 42: Global Service Integration and Management Industry Revenue Million Forecast, by Country 2019 & 2032
- Table 43: United States Service Integration and Management Industry Revenue (Million) Forecast, by Application 2019 & 2032
- Table 44: Canada Service Integration and Management Industry Revenue (Million) Forecast, by Application 2019 & 2032
- Table 45: Mexico Service Integration and Management Industry Revenue (Million) Forecast, by Application 2019 & 2032
- Table 46: Global Service Integration and Management Industry Revenue Million Forecast, by Country 2019 & 2032
- Table 47: United Arab Emirates Service Integration and Management Industry Revenue (Million) Forecast, by Application 2019 & 2032
- Table 48: Saudi Arabia Service Integration and Management Industry Revenue (Million) Forecast, by Application 2019 & 2032
- Table 49: South Africa Service Integration and Management Industry Revenue (Million) Forecast, by Application 2019 & 2032
- Table 50: Rest of Middle East and Africa Service Integration and Management Industry Revenue (Million) Forecast, by Application 2019 & 2032
- Table 51: Global Service Integration and Management Industry Revenue Million Forecast, by Component 2019 & 2032
- Table 52: Global Service Integration and Management Industry Revenue Million Forecast, by Organization Size 2019 & 2032
- Table 53: Global Service Integration and Management Industry Revenue Million Forecast, by End user Industry 2019 & 2032
- Table 54: Global Service Integration and Management Industry Revenue Million Forecast, by Country 2019 & 2032
- Table 55: Global Service Integration and Management Industry Revenue Million Forecast, by Component 2019 & 2032
- Table 56: Global Service Integration and Management Industry Revenue Million Forecast, by Organization Size 2019 & 2032
- Table 57: Global Service Integration and Management Industry Revenue Million Forecast, by End user Industry 2019 & 2032
- Table 58: Global Service Integration and Management Industry Revenue Million Forecast, by Country 2019 & 2032
- Table 59: Global Service Integration and Management Industry Revenue Million Forecast, by Component 2019 & 2032
- Table 60: Global Service Integration and Management Industry Revenue Million Forecast, by Organization Size 2019 & 2032
- Table 61: Global Service Integration and Management Industry Revenue Million Forecast, by End user Industry 2019 & 2032
- Table 62: Global Service Integration and Management Industry Revenue Million Forecast, by Country 2019 & 2032
- Table 63: Global Service Integration and Management Industry Revenue Million Forecast, by Component 2019 & 2032
- Table 64: Global Service Integration and Management Industry Revenue Million Forecast, by Organization Size 2019 & 2032
- Table 65: Global Service Integration and Management Industry Revenue Million Forecast, by End user Industry 2019 & 2032
- Table 66: Global Service Integration and Management Industry Revenue Million Forecast, by Country 2019 & 2032
Frequently Asked Questions
1. What is the projected Compound Annual Growth Rate (CAGR) of the Service Integration and Management Industry?
The projected CAGR is approximately 9.20%.
2. Which companies are prominent players in the Service Integration and Management Industry?
Key companies in the market include Wipro Limite, Infosys Limited, Accenture PLC, HCL Technologies, IBM Corporation, Capgemini SE, Hewlett Packard Enterprise (HPE), Fujitsu Limited, Mindtree Limited, AtoS SE.
3. What are the main segments of the Service Integration and Management Industry?
The market segments include Component, Organization Size, End user Industry.
4. Can you provide details about the market size?
The market size is estimated to be USD XX Million as of 2022.
5. What are some drivers contributing to market growth?
Increasing Complexities of Service Management; Increasing Demand for Multi-Vendor Outsourcing.
6. What are the notable trends driving market growth?
Cloud Technology to witness significant growth.
7. Are there any restraints impacting market growth?
Lack of Uniform SLAs and Regulatory Compliances.
8. Can you provide examples of recent developments in the market?
August 2021 - Perspecta Enterprise Solutions LLC, as contractor team arrangement (CTA) lead with Capgemini Government Solutions LLC, as a CTA member, was awarded a single award, firm-fixed-price, blanket purchase agreement (BPA) with an ordering ceiling of USD 2 billion. BPA HT001521A0002 represents the Military Health System Enterprise Information Technology Services Integrator (EITSI). The EITSI would use a multisourcing services integrator approach to coordinate, integrate, and manage the Defense Health Agency's (DHA) IT transformation to consolidate services and reduce costs.
9. What pricing options are available for accessing the report?
Pricing options include single-user, multi-user, and enterprise licenses priced at USD 4750, USD 5250, and USD 8750 respectively.
10. Is the market size provided in terms of value or volume?
The market size is provided in terms of value, measured in Million.
11. Are there any specific market keywords associated with the report?
Yes, the market keyword associated with the report is "Service Integration and Management Industry," which aids in identifying and referencing the specific market segment covered.
12. How do I determine which pricing option suits my needs best?
The pricing options vary based on user requirements and access needs. Individual users may opt for single-user licenses, while businesses requiring broader access may choose multi-user or enterprise licenses for cost-effective access to the report.
13. Are there any additional resources or data provided in the Service Integration and Management Industry report?
While the report offers comprehensive insights, it's advisable to review the specific contents or supplementary materials provided to ascertain if additional resources or data are available.
14. How can I stay updated on further developments or reports in the Service Integration and Management Industry?
To stay informed about further developments, trends, and reports in the Service Integration and Management Industry, consider subscribing to industry newsletters, following relevant companies and organizations, or regularly checking reputable industry news sources and publications.
Methodology
Step 1 - Identification of Relevant Samples Size from Population Database


Step 2 - Approaches for Defining Global Market Size (Value, Volume* & Price*)

Note*: In applicable scenarios
Step 3 - Data Sources
Primary Research
- Web Analytics
- Survey Reports
- Research Institute
- Latest Research Reports
- Opinion Leaders
Secondary Research
- Annual Reports
- White Paper
- Latest Press Release
- Industry Association
- Paid Database
- Investor Presentations

Step 4 - Data Triangulation
Involves using different sources of information in order to increase the validity of a study
These sources are likely to be stakeholders in a program - participants, other researchers, program staff, other community members, and so on.
Then we put all data in single framework & apply various statistical tools to find out the dynamic on the market.
During the analysis stage, feedback from the stakeholder groups would be compared to determine areas of agreement as well as areas of divergence


