Key Insights
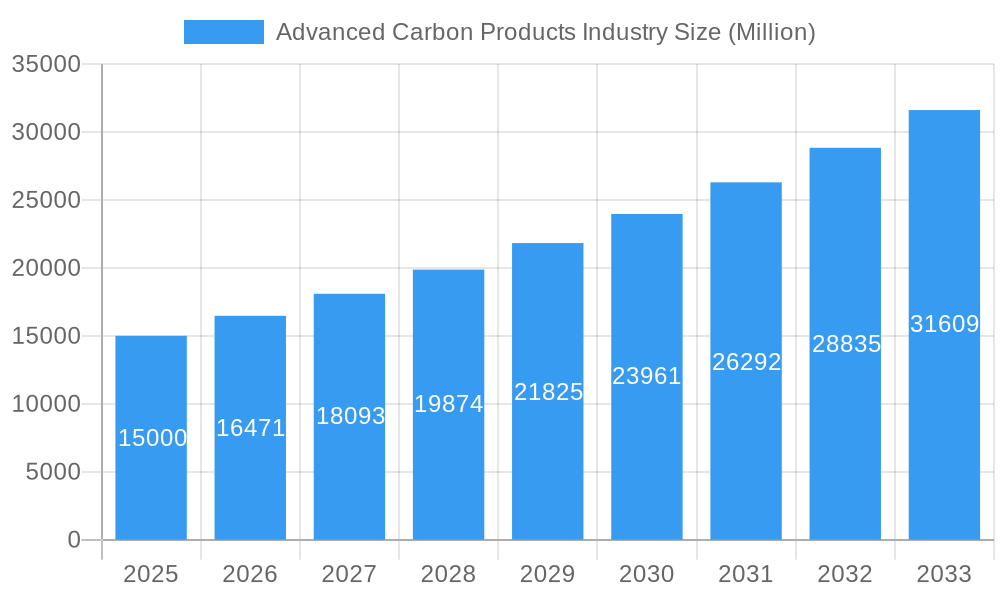
The advanced carbon products market, encompassing materials like carbon fibers, graphene, and carbon nanotubes, is experiencing robust growth, projected to maintain a Compound Annual Growth Rate (CAGR) of 9.82% from 2025 to 2033. This expansion is driven by several key factors. Firstly, the increasing demand for lightweight yet high-strength materials in the aerospace and automotive sectors is fueling significant adoption. Electric vehicles (EVs), with their need for lighter components to extend battery range, are a particularly strong driver. Secondly, the electronics industry's pursuit of improved performance and miniaturization is creating a substantial market for advanced carbon materials in applications such as semiconductors and energy storage. The rising integration of carbon-based materials in renewable energy technologies, including solar panels and wind turbine components, further contributes to market expansion. Finally, growing awareness of sustainability and the inherent recyclability of some carbon materials are positioning them as environmentally friendly alternatives to traditional materials.
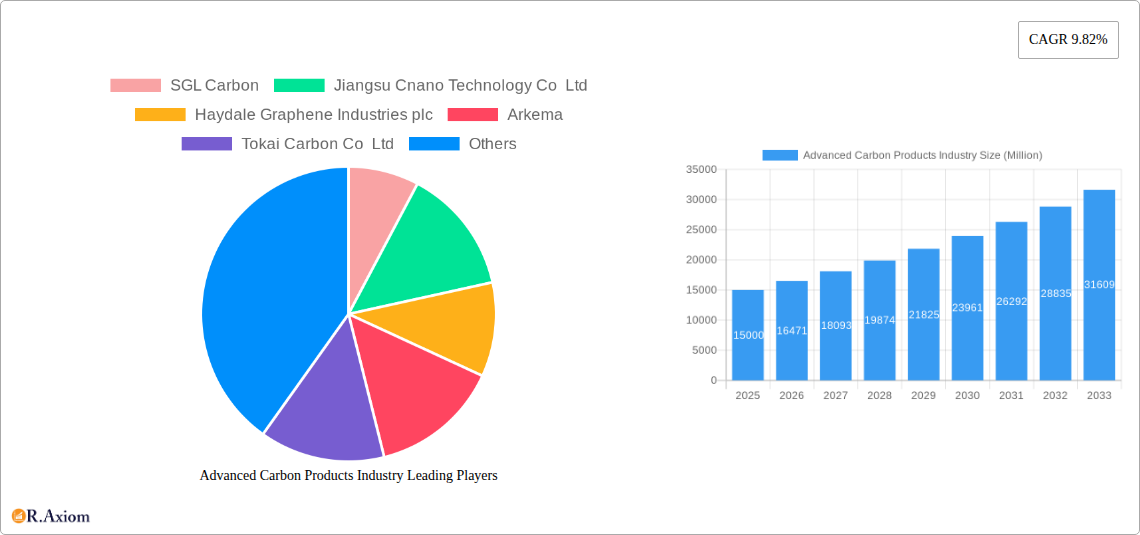
Advanced Carbon Products Industry Market Size (In Billion)
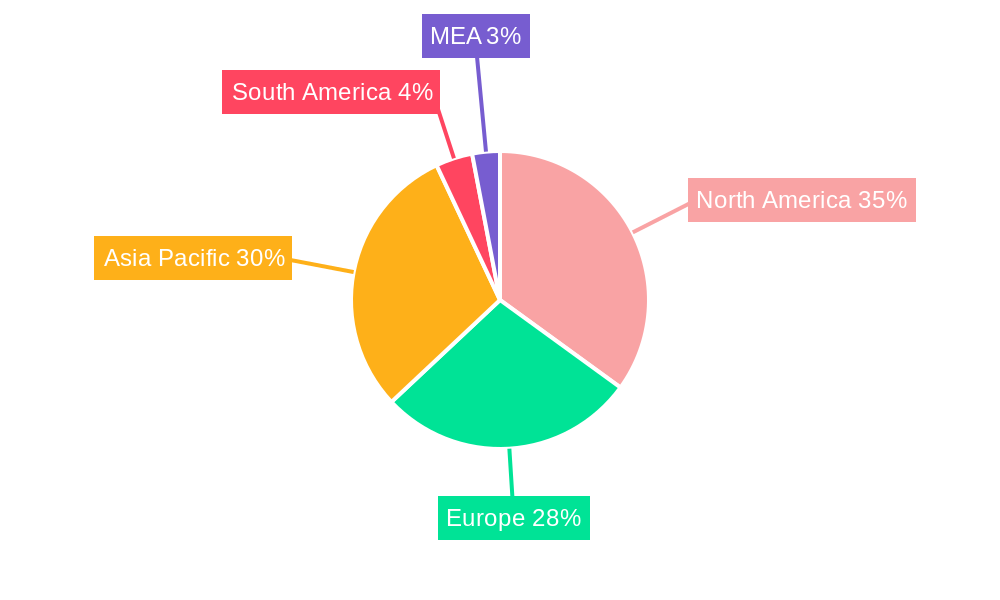
However, market growth is not without its challenges. High production costs, particularly for materials like graphene and carbon nanotubes, represent a significant restraint. Furthermore, the complex manufacturing processes and the need for specialized equipment can hinder widespread adoption. The market also faces challenges related to consistent quality control and standardization across different materials and manufacturers. Despite these restraints, the overall outlook for the advanced carbon products market remains positive, with continued innovation and technological advancements expected to mitigate some of these obstacles and unlock new applications across diverse industries. The market segmentation by product type and application highlights diverse growth opportunities, with significant potential across regions like North America and Asia-Pacific, driven by strong technological advancements and substantial investments in research and development.
Advanced Carbon Products Industry Company Market Share
Advanced Carbon Products Industry: A Comprehensive Market Report (2019-2033)
This in-depth report provides a comprehensive analysis of the Advanced Carbon Products industry, offering actionable insights for stakeholders across the value chain. The study period covers 2019-2033, with 2025 serving as the base and estimated year. The forecast period spans 2025-2033, while the historical period encompasses 2019-2024. The report analyzes key market segments, competitive dynamics, and future growth potential, providing a detailed understanding of this rapidly evolving sector. The total market size in 2025 is estimated at $XX Million.
Advanced Carbon Products Industry Market Concentration & Innovation
This section analyzes the market concentration, identifying key players and their market share. We examine innovation drivers, including R&D investments and technological advancements, alongside regulatory frameworks impacting the industry. Furthermore, the report assesses the influence of product substitutes, end-user trends (e.g., lightweighting in automotive), and mergers & acquisitions (M&A) activities on market dynamics.
- Market Concentration: The market is characterized by a mix of large multinational corporations and specialized smaller companies. The top five players hold an estimated XX% market share in 2025.
- Innovation Drivers: Significant investments in nanotechnology, advanced materials research, and sustainable manufacturing processes are driving innovation.
- Regulatory Frameworks: Government regulations focusing on sustainability and carbon emissions are significantly influencing product development and market adoption.
- Product Substitutes: Competition comes from alternative materials with similar properties, such as advanced polymers and composites. The report analyzes the competitive landscape and threat from substitutes.
- End-User Trends: The increasing demand for lightweight, high-strength materials across various sectors, particularly aerospace and automotive, fuels market growth.
- M&A Activities: The report analyzes significant M&A deals during the historical period, including deal values (estimated at $XX Million in total) and their impact on market consolidation and innovation. Examples include acquisitions aimed at expanding product portfolios or accessing new technologies.
Advanced Carbon Products Industry Industry Trends & Insights
The Advanced Carbon Products industry is experiencing dynamic growth, propelled by several pivotal trends. A primary driver is the escalating demand from key application sectors, most notably the burgeoning electric vehicle (EV) market, which necessitates lightweight yet robust materials. Concurrently, rapid technological advancements, such as the innovative development and integration of high-performance graphene-based composites, are unlocking new performance potentials. Evolving consumer preferences towards sustainable and high-performance solutions further bolster this demand. The competitive landscape is characterized by evolving pricing strategies, a strong emphasis on product differentiation through unique material properties, and continuous technological innovation aimed at enhancing performance and reducing costs. The Compound Annual Growth Rate (CAGR) for the forecast period is projected at XX%, with market penetration in critical applications like aerospace and defense anticipated to reach XX% by 2033.
Dominant Markets & Segments in Advanced Carbon Products Industry
This section provides a detailed overview of the leading geographical regions, countries, and product/application segments that are currently defining the Advanced Carbon Products market. It further elucidates the underlying factors contributing to their dominance and outlines the growth trajectories for emerging segments.
- Leading Regions/Countries: The Asia-Pacific region is projected to maintain its market leadership. This is attributed to its robust manufacturing infrastructure, substantial governmental support for advanced materials development, and significant investments in renewable energy and electric vehicle production, which are major end-users of advanced carbon products. Other key regions include North America and Europe, driven by their strong aerospace and automotive sectors respectively.
- Dominant Product Types: Carbon fibers continue to hold a leading position due to their established demand in the aerospace and automotive industries. However, graphene and carbon nanotubes are exhibiting exceptionally rapid growth. This surge is fueled by their unique, superior properties, such as exceptional strength, conductivity, and thermal management capabilities, leading to their expanding application in cutting-edge technologies.
- Dominant Applications: The aerospace and defense sector remains a primary consumer, leveraging the lightweight and high-strength attributes of advanced carbon products for critical components. The automotive industry, especially with the rise of electric vehicles, is a significant growth area. The electronics and energy storage sectors are also witnessing increased adoption, driven by the demand for improved performance and miniaturization.
Key Drivers for Dominant Segments:
- Aerospace & Defense: The relentless pursuit of fuel efficiency and enhanced performance necessitates the use of lightweight, high-strength materials for aircraft structures, components, and defense systems.
- Automotive: The global shift towards electric vehicles and the increasing demand for high-performance and fuel-efficient internal combustion engine vehicles are driving the adoption of carbon fiber reinforced polymers (CFRP) for weight reduction and improved safety.
- Electronics: The growing need for advanced functionalities, improved thermal management, and higher conductivity in electronic devices, along with the development of next-generation batteries and supercapacitors, fuels the demand for carbon nanotubes and graphene.
Advanced Carbon Products Industry Product Developments
Innovations in the Advanced Carbon Products industry are continuously pushing the boundaries of material performance and cost-effectiveness. Recent breakthroughs include significant advancements in carbon fiber manufacturing processes, leading to enhanced strength-to-weight ratios and considerable cost reductions, making these materials more accessible. Furthermore, the development of novel graphene-based composites is yielding materials with superior electrical conductivity and exceptional thermal management capabilities. These cutting-edge developments are strategically designed to meet the escalating demand for high-performance materials across a diverse range of applications, thereby intensifying market competitiveness and fostering new opportunities.
Report Scope & Segmentation Analysis
The report segments the Advanced Carbon Products market by:
Product Type:
- Carbon Fibers: Market size, growth projections, competitive landscape.
- Special Graphite: Market size, growth projections, competitive landscape.
- Carbon Nanotubes: Market size, growth projections, competitive landscape.
- Graphene: Market size, growth projections, competitive landscape.
- Carbon Foams: Market size, growth projections, competitive landscape.
- Others (Fullerenes, DLC, NCD): Market size, growth projections, competitive landscape.
Application:
- Aerospace & Defence: Market size, growth projections, competitive landscape.
- Electronics: Market size, growth projections, competitive landscape.
- Sports: Market size, growth projections, competitive landscape.
- Automotive: Market size, growth projections, competitive landscape.
- Construction: Market size, growth projections, competitive landscape.
- Energy: Market size, growth projections, competitive landscape.
- Others: Market size, growth projections, competitive landscape.
Key Drivers of Advanced Carbon Products Industry Growth
The robust growth of the Advanced Carbon Products industry is underpinned by several powerful catalysts. Paramount among these are ongoing technological advancements, which are consistently leading to the development of materials with improved intrinsic properties and more efficient, cost-effective production methods. This is complemented by strong and sustained demand from critical application sectors, including aerospace, automotive, and electronics, where these advanced materials are indispensable. Moreover, supportive government policies that champion the adoption of sustainable materials and substantial investments in renewable energy infrastructure are further stimulating market expansion and innovation.
Challenges in the Advanced Carbon Products Industry Sector
Challenges include high production costs for some advanced materials, the availability of raw materials, and competition from alternative materials. Supply chain disruptions and regulatory hurdles can also impact market growth. For example, fluctuations in the price of precursor materials can significantly affect production costs.
Emerging Opportunities in Advanced Carbon Products Industry
Emerging opportunities include the increasing adoption of carbon-based materials in energy storage, biomedical applications, and water purification. The development of new manufacturing processes and the exploration of novel applications further expands market potential.
Leading Players in the Advanced Carbon Products Industry Market
- SGL Carbon
- Jiangsu Cnano Technology Co Ltd
- Haydale Graphene Industries plc
- Arkema
- Tokai Carbon Co Ltd
- Solvay
- Antolin
- POCO
- Perpetuus Advanced Materials PLC
- FutureCarbon GmbH
- Shenzhen Sanshun Nano New Materials Co Ltd
- GrafTech International
- Nanocyl SA
- Grupo Graphenano
- Graphenea Inc
- Arry International Group Limited
- Ningbo Morsh Technology
- Hyperion Catalysis International
- XG Sciences Inc
- The Sixth Element (Changzhou) Materials Technology Co Ltd
- Nano-C
- Nippon Graphite Fiber Co Ltd
- Global Graphene Group
- Toyo Tanso Co Ltd
- CFOAM LLC
- TORAY INDUSTRIES INC
- Mitsubishi Chemical Carbon Fiber and Composites Inc
- Thomas Swan & Co Ltd
- Hexcel Corporation
- Formosa Plastics Corporation
- TEIJIN LIMITED
- Graphite India Limited
- SHOWA DENKO K K
Key Developments in Advanced Carbon Products Industry Industry
- 2022 Q4: Company X launched a new high-strength carbon fiber, enhancing its market position.
- 2023 Q1: Major M&A activity between Company Y and Company Z expanded market share significantly.
- 2023 Q3: A new graphene-based battery technology was unveiled, expected to revolutionize energy storage.
- Further key developments to be included based on data analysis.
Strategic Outlook for Advanced Carbon Products Industry Market
The Advanced Carbon Products industry is poised for a period of significant and sustained growth. This expansion will be fueled by continuous technological innovation and the ever-increasing demand from a wide spectrum of applications. The market is expected to witness an acceleration in consolidation through strategic mergers and acquisitions (M&A) as companies seek to gain market share and enhance their technological portfolios. A key trend shaping the future market potential will be the growing emphasis on sustainable manufacturing practices and the development of bio-based or recyclable carbon materials. The overarching focus on lightweighting for efficiency and the demand for materials offering superior performance characteristics will continue to define and drive the industry's trajectory for years to come.
Advanced Carbon Products Industry Segmentation
-
1. Product Type
- 1.1. Carbon Fibers
- 1.2. Special Graphite
- 1.3. Carbon Nanotubes
- 1.4. Graphene
- 1.5. Carbon Foams (Includes Carbon Nanofoams)
- 1.6. Others (
-
2. Application
- 2.1. Aerospace and Defence
- 2.2. Electronics
- 2.3. Sports
- 2.4. Automotive
- 2.5. Construction
- 2.6. Energy
- 2.7. Others
Advanced Carbon Products Industry Segmentation By Geography
-
1. Asia Pacific
- 1.1. China
- 1.2. India
- 1.3. Japan
- 1.4. South Korea
- 1.5. Rest of Asia Pacific
-
2. North America
- 2.1. United States
- 2.2. Canada
- 2.3. Mexico
-
3. Europe
- 3.1. Germany
- 3.2. United Kingdom
- 3.3. France
- 3.4. Italy
- 3.5. Spain
- 3.6. Russia
- 3.7. Rest of Europe
-
4. South America
- 4.1. Brazil
- 4.2. Argentina
- 4.3. Rest of South America
-
5. Middle East and Africa
- 5.1. Saudi Arabia
- 5.2. United Arab Emirates
- 5.3. South Africa
- 5.4. Rest of Middle East and Africa
Advanced Carbon Products Industry Regional Market Share
Geographic Coverage of Advanced Carbon Products Industry
Advanced Carbon Products Industry REPORT HIGHLIGHTS
| Aspects | Details |
|---|---|
| Study Period | 2020-2034 |
| Base Year | 2025 |
| Estimated Year | 2026 |
| Forecast Period | 2026-2034 |
| Historical Period | 2020-2025 |
| Growth Rate | CAGR of 9.82% from 2020-2034 |
| Segmentation |
|
Table of Contents
- 1. Introduction
- 1.1. Research Scope
- 1.2. Market Segmentation
- 1.3. Research Objective
- 1.4. Definitions and Assumptions
- 2. Executive Summary
- 2.1. Market Snapshot
- 3. Market Dynamics
- 3.1. Market Drivers
- 3.2. Market Restrains
- 3.3. Market Trends
- 3.4. Market Opportunities
- 4. Market Factor Analysis
- 4.1. Porters Five Forces
- 4.1.1. Bargaining Power of Suppliers
- 4.1.2. Bargaining Power of Buyers
- 4.1.3. Threat of New Entrants
- 4.1.4. Threat of Substitutes
- 4.1.5. Competitive Rivalry
- 4.2. PESTEL analysis
- 4.3. BCG Analysis
- 4.3.1. Stars (High Growth, High Market Share)
- 4.3.2. Cash Cows (Low Growth, High Market Share)
- 4.3.3. Question Mark (High Growth, Low Market Share)
- 4.3.4. Dogs (Low Growth, Low Market Share)
- 4.4. Ansoff Matrix Analysis
- 4.5. Supply Chain Analysis
- 4.6. Regulatory Landscape
- 4.7. Current Market Potential and Opportunity Assessment (TAM–SAM–SOM Framework)
- 4.8. RAX Analyst Note
- 4.1. Porters Five Forces
- 5. Market Analysis, Insights and Forecast 2021-2033
- 5.1. Market Analysis, Insights and Forecast - by Product Type
- 5.1.1. Carbon Fibers
- 5.1.2. Special Graphite
- 5.1.3. Carbon Nanotubes
- 5.1.4. Graphene
- 5.1.5. Carbon Foams (Includes Carbon Nanofoams)
- 5.1.6. Others (
- 5.2. Market Analysis, Insights and Forecast - by Application
- 5.2.1. Aerospace and Defence
- 5.2.2. Electronics
- 5.2.3. Sports
- 5.2.4. Automotive
- 5.2.5. Construction
- 5.2.6. Energy
- 5.2.7. Others
- 5.3. Market Analysis, Insights and Forecast - by Region
- 5.3.1. Asia Pacific
- 5.3.2. North America
- 5.3.3. Europe
- 5.3.4. South America
- 5.3.5. Middle East and Africa
- 5.1. Market Analysis, Insights and Forecast - by Product Type
- 6. Global Advanced Carbon Products Industry Analysis, Insights and Forecast, 2021-2033
- 6.1. Market Analysis, Insights and Forecast - by Product Type
- 6.1.1. Carbon Fibers
- 6.1.2. Special Graphite
- 6.1.3. Carbon Nanotubes
- 6.1.4. Graphene
- 6.1.5. Carbon Foams (Includes Carbon Nanofoams)
- 6.1.6. Others (
- 6.2. Market Analysis, Insights and Forecast - by Application
- 6.2.1. Aerospace and Defence
- 6.2.2. Electronics
- 6.2.3. Sports
- 6.2.4. Automotive
- 6.2.5. Construction
- 6.2.6. Energy
- 6.2.7. Others
- 6.1. Market Analysis, Insights and Forecast - by Product Type
- 7. Asia Pacific Advanced Carbon Products Industry Analysis, Insights and Forecast, 2020-2032
- 7.1. Market Analysis, Insights and Forecast - by Product Type
- 7.1.1. Carbon Fibers
- 7.1.2. Special Graphite
- 7.1.3. Carbon Nanotubes
- 7.1.4. Graphene
- 7.1.5. Carbon Foams (Includes Carbon Nanofoams)
- 7.1.6. Others (
- 7.2. Market Analysis, Insights and Forecast - by Application
- 7.2.1. Aerospace and Defence
- 7.2.2. Electronics
- 7.2.3. Sports
- 7.2.4. Automotive
- 7.2.5. Construction
- 7.2.6. Energy
- 7.2.7. Others
- 7.1. Market Analysis, Insights and Forecast - by Product Type
- 8. North America Advanced Carbon Products Industry Analysis, Insights and Forecast, 2020-2032
- 8.1. Market Analysis, Insights and Forecast - by Product Type
- 8.1.1. Carbon Fibers
- 8.1.2. Special Graphite
- 8.1.3. Carbon Nanotubes
- 8.1.4. Graphene
- 8.1.5. Carbon Foams (Includes Carbon Nanofoams)
- 8.1.6. Others (
- 8.2. Market Analysis, Insights and Forecast - by Application
- 8.2.1. Aerospace and Defence
- 8.2.2. Electronics
- 8.2.3. Sports
- 8.2.4. Automotive
- 8.2.5. Construction
- 8.2.6. Energy
- 8.2.7. Others
- 8.1. Market Analysis, Insights and Forecast - by Product Type
- 9. Europe Advanced Carbon Products Industry Analysis, Insights and Forecast, 2020-2032
- 9.1. Market Analysis, Insights and Forecast - by Product Type
- 9.1.1. Carbon Fibers
- 9.1.2. Special Graphite
- 9.1.3. Carbon Nanotubes
- 9.1.4. Graphene
- 9.1.5. Carbon Foams (Includes Carbon Nanofoams)
- 9.1.6. Others (
- 9.2. Market Analysis, Insights and Forecast - by Application
- 9.2.1. Aerospace and Defence
- 9.2.2. Electronics
- 9.2.3. Sports
- 9.2.4. Automotive
- 9.2.5. Construction
- 9.2.6. Energy
- 9.2.7. Others
- 9.1. Market Analysis, Insights and Forecast - by Product Type
- 10. South America Advanced Carbon Products Industry Analysis, Insights and Forecast, 2020-2032
- 10.1. Market Analysis, Insights and Forecast - by Product Type
- 10.1.1. Carbon Fibers
- 10.1.2. Special Graphite
- 10.1.3. Carbon Nanotubes
- 10.1.4. Graphene
- 10.1.5. Carbon Foams (Includes Carbon Nanofoams)
- 10.1.6. Others (
- 10.2. Market Analysis, Insights and Forecast - by Application
- 10.2.1. Aerospace and Defence
- 10.2.2. Electronics
- 10.2.3. Sports
- 10.2.4. Automotive
- 10.2.5. Construction
- 10.2.6. Energy
- 10.2.7. Others
- 10.1. Market Analysis, Insights and Forecast - by Product Type
- 11. Middle East and Africa Advanced Carbon Products Industry Analysis, Insights and Forecast, 2020-2032
- 11.1. Market Analysis, Insights and Forecast - by Product Type
- 11.1.1. Carbon Fibers
- 11.1.2. Special Graphite
- 11.1.3. Carbon Nanotubes
- 11.1.4. Graphene
- 11.1.5. Carbon Foams (Includes Carbon Nanofoams)
- 11.1.6. Others (
- 11.2. Market Analysis, Insights and Forecast - by Application
- 11.2.1. Aerospace and Defence
- 11.2.2. Electronics
- 11.2.3. Sports
- 11.2.4. Automotive
- 11.2.5. Construction
- 11.2.6. Energy
- 11.2.7. Others
- 11.1. Market Analysis, Insights and Forecast - by Product Type
- 12. Competitive Analysis
- 12.1. Company Profiles
- 12.1.1 SGL Carbon
- 12.1.1.1. Company Overview
- 12.1.1.2. Products
- 12.1.1.3. Company Financials
- 12.1.1.4. SWOT Analysis
- 12.1.2 Jiangsu Cnano Technology Co Ltd
- 12.1.2.1. Company Overview
- 12.1.2.2. Products
- 12.1.2.3. Company Financials
- 12.1.2.4. SWOT Analysis
- 12.1.3 Haydale Graphene Industries plc
- 12.1.3.1. Company Overview
- 12.1.3.2. Products
- 12.1.3.3. Company Financials
- 12.1.3.4. SWOT Analysis
- 12.1.4 Arkema
- 12.1.4.1. Company Overview
- 12.1.4.2. Products
- 12.1.4.3. Company Financials
- 12.1.4.4. SWOT Analysis
- 12.1.5 Tokai Carbon Co Ltd
- 12.1.5.1. Company Overview
- 12.1.5.2. Products
- 12.1.5.3. Company Financials
- 12.1.5.4. SWOT Analysis
- 12.1.6 Solvay
- 12.1.6.1. Company Overview
- 12.1.6.2. Products
- 12.1.6.3. Company Financials
- 12.1.6.4. SWOT Analysis
- 12.1.7 Antolin
- 12.1.7.1. Company Overview
- 12.1.7.2. Products
- 12.1.7.3. Company Financials
- 12.1.7.4. SWOT Analysis
- 12.1.8 POCO
- 12.1.8.1. Company Overview
- 12.1.8.2. Products
- 12.1.8.3. Company Financials
- 12.1.8.4. SWOT Analysis
- 12.1.9 Perpetuus Advanced Materials PLC
- 12.1.9.1. Company Overview
- 12.1.9.2. Products
- 12.1.9.3. Company Financials
- 12.1.9.4. SWOT Analysis
- 12.1.10 FutureCarbon GmbH
- 12.1.10.1. Company Overview
- 12.1.10.2. Products
- 12.1.10.3. Company Financials
- 12.1.10.4. SWOT Analysis
- 12.1.11 Shenzhen Sanshun Nano New Materials Co Ltd
- 12.1.11.1. Company Overview
- 12.1.11.2. Products
- 12.1.11.3. Company Financials
- 12.1.11.4. SWOT Analysis
- 12.1.12 GrafTech International
- 12.1.12.1. Company Overview
- 12.1.12.2. Products
- 12.1.12.3. Company Financials
- 12.1.12.4. SWOT Analysis
- 12.1.13 Nanocyl SA
- 12.1.13.1. Company Overview
- 12.1.13.2. Products
- 12.1.13.3. Company Financials
- 12.1.13.4. SWOT Analysis
- 12.1.14 Grupo Graphenano
- 12.1.14.1. Company Overview
- 12.1.14.2. Products
- 12.1.14.3. Company Financials
- 12.1.14.4. SWOT Analysis
- 12.1.15 Graphenea Inc
- 12.1.15.1. Company Overview
- 12.1.15.2. Products
- 12.1.15.3. Company Financials
- 12.1.15.4. SWOT Analysis
- 12.1.16 Arry International Group Limited
- 12.1.16.1. Company Overview
- 12.1.16.2. Products
- 12.1.16.3. Company Financials
- 12.1.16.4. SWOT Analysis
- 12.1.17 Ningbo Morsh Technology
- 12.1.17.1. Company Overview
- 12.1.17.2. Products
- 12.1.17.3. Company Financials
- 12.1.17.4. SWOT Analysis
- 12.1.18 Hyperion Catalysis International
- 12.1.18.1. Company Overview
- 12.1.18.2. Products
- 12.1.18.3. Company Financials
- 12.1.18.4. SWOT Analysis
- 12.1.19 XG Sciences Inc
- 12.1.19.1. Company Overview
- 12.1.19.2. Products
- 12.1.19.3. Company Financials
- 12.1.19.4. SWOT Analysis
- 12.1.20 The Sixth Element (Changzhou) Materials Technology Co Ltd
- 12.1.20.1. Company Overview
- 12.1.20.2. Products
- 12.1.20.3. Company Financials
- 12.1.20.4. SWOT Analysis
- 12.1.21 Nano-C
- 12.1.21.1. Company Overview
- 12.1.21.2. Products
- 12.1.21.3. Company Financials
- 12.1.21.4. SWOT Analysis
- 12.1.22 Nippon Graphite Fiber Co Ltd
- 12.1.22.1. Company Overview
- 12.1.22.2. Products
- 12.1.22.3. Company Financials
- 12.1.22.4. SWOT Analysis
- 12.1.23 Global Graphene Group
- 12.1.23.1. Company Overview
- 12.1.23.2. Products
- 12.1.23.3. Company Financials
- 12.1.23.4. SWOT Analysis
- 12.1.24 Toyo Tanso Co Ltd
- 12.1.24.1. Company Overview
- 12.1.24.2. Products
- 12.1.24.3. Company Financials
- 12.1.24.4. SWOT Analysis
- 12.1.25 CFOAM LLC
- 12.1.25.1. Company Overview
- 12.1.25.2. Products
- 12.1.25.3. Company Financials
- 12.1.25.4. SWOT Analysis
- 12.1.26 TORAY INDUSTRIES INC
- 12.1.26.1. Company Overview
- 12.1.26.2. Products
- 12.1.26.3. Company Financials
- 12.1.26.4. SWOT Analysis
- 12.1.27 Mitsubishi Chemical Carbon Fiber and Composites Inc
- 12.1.27.1. Company Overview
- 12.1.27.2. Products
- 12.1.27.3. Company Financials
- 12.1.27.4. SWOT Analysis
- 12.1.28 Thomas Swan & Co Ltd
- 12.1.28.1. Company Overview
- 12.1.28.2. Products
- 12.1.28.3. Company Financials
- 12.1.28.4. SWOT Analysis
- 12.1.29 Hexcel Corporation
- 12.1.29.1. Company Overview
- 12.1.29.2. Products
- 12.1.29.3. Company Financials
- 12.1.29.4. SWOT Analysis
- 12.1.30 Formosa Plastics Corporation
- 12.1.30.1. Company Overview
- 12.1.30.2. Products
- 12.1.30.3. Company Financials
- 12.1.30.4. SWOT Analysis
- 12.1.31 TEIJIN LIMITED
- 12.1.31.1. Company Overview
- 12.1.31.2. Products
- 12.1.31.3. Company Financials
- 12.1.31.4. SWOT Analysis
- 12.1.32 Graphite India Limited
- 12.1.32.1. Company Overview
- 12.1.32.2. Products
- 12.1.32.3. Company Financials
- 12.1.32.4. SWOT Analysis
- 12.1.33 SHOWA DENKO K K
- 12.1.33.1. Company Overview
- 12.1.33.2. Products
- 12.1.33.3. Company Financials
- 12.1.33.4. SWOT Analysis
- 12.1.1 SGL Carbon
- 12.2. Market Entropy
- 12.2.1 Company's Key Areas Served
- 12.2.2 Recent Developments
- 12.3. Company Market Share Analysis 2025
- 12.3.1 Top 5 Companies Market Share Analysis
- 12.3.2 Top 3 Companies Market Share Analysis
- 12.4. List of Potential Customers
- 13. Research Methodology
List of Figures
- Figure 1: Global Advanced Carbon Products Industry Revenue Breakdown (Million, %) by Region 2025 & 2033
- Figure 2: Global Advanced Carbon Products Industry Volume Breakdown (K Tons, %) by Region 2025 & 2033
- Figure 3: Asia Pacific Advanced Carbon Products Industry Revenue (Million), by Product Type 2025 & 2033
- Figure 4: Asia Pacific Advanced Carbon Products Industry Volume (K Tons), by Product Type 2025 & 2033
- Figure 5: Asia Pacific Advanced Carbon Products Industry Revenue Share (%), by Product Type 2025 & 2033
- Figure 6: Asia Pacific Advanced Carbon Products Industry Volume Share (%), by Product Type 2025 & 2033
- Figure 7: Asia Pacific Advanced Carbon Products Industry Revenue (Million), by Application 2025 & 2033
- Figure 8: Asia Pacific Advanced Carbon Products Industry Volume (K Tons), by Application 2025 & 2033
- Figure 9: Asia Pacific Advanced Carbon Products Industry Revenue Share (%), by Application 2025 & 2033
- Figure 10: Asia Pacific Advanced Carbon Products Industry Volume Share (%), by Application 2025 & 2033
- Figure 11: Asia Pacific Advanced Carbon Products Industry Revenue (Million), by Country 2025 & 2033
- Figure 12: Asia Pacific Advanced Carbon Products Industry Volume (K Tons), by Country 2025 & 2033
- Figure 13: Asia Pacific Advanced Carbon Products Industry Revenue Share (%), by Country 2025 & 2033
- Figure 14: Asia Pacific Advanced Carbon Products Industry Volume Share (%), by Country 2025 & 2033
- Figure 15: North America Advanced Carbon Products Industry Revenue (Million), by Product Type 2025 & 2033
- Figure 16: North America Advanced Carbon Products Industry Volume (K Tons), by Product Type 2025 & 2033
- Figure 17: North America Advanced Carbon Products Industry Revenue Share (%), by Product Type 2025 & 2033
- Figure 18: North America Advanced Carbon Products Industry Volume Share (%), by Product Type 2025 & 2033
- Figure 19: North America Advanced Carbon Products Industry Revenue (Million), by Application 2025 & 2033
- Figure 20: North America Advanced Carbon Products Industry Volume (K Tons), by Application 2025 & 2033
- Figure 21: North America Advanced Carbon Products Industry Revenue Share (%), by Application 2025 & 2033
- Figure 22: North America Advanced Carbon Products Industry Volume Share (%), by Application 2025 & 2033
- Figure 23: North America Advanced Carbon Products Industry Revenue (Million), by Country 2025 & 2033
- Figure 24: North America Advanced Carbon Products Industry Volume (K Tons), by Country 2025 & 2033
- Figure 25: North America Advanced Carbon Products Industry Revenue Share (%), by Country 2025 & 2033
- Figure 26: North America Advanced Carbon Products Industry Volume Share (%), by Country 2025 & 2033
- Figure 27: Europe Advanced Carbon Products Industry Revenue (Million), by Product Type 2025 & 2033
- Figure 28: Europe Advanced Carbon Products Industry Volume (K Tons), by Product Type 2025 & 2033
- Figure 29: Europe Advanced Carbon Products Industry Revenue Share (%), by Product Type 2025 & 2033
- Figure 30: Europe Advanced Carbon Products Industry Volume Share (%), by Product Type 2025 & 2033
- Figure 31: Europe Advanced Carbon Products Industry Revenue (Million), by Application 2025 & 2033
- Figure 32: Europe Advanced Carbon Products Industry Volume (K Tons), by Application 2025 & 2033
- Figure 33: Europe Advanced Carbon Products Industry Revenue Share (%), by Application 2025 & 2033
- Figure 34: Europe Advanced Carbon Products Industry Volume Share (%), by Application 2025 & 2033
- Figure 35: Europe Advanced Carbon Products Industry Revenue (Million), by Country 2025 & 2033
- Figure 36: Europe Advanced Carbon Products Industry Volume (K Tons), by Country 2025 & 2033
- Figure 37: Europe Advanced Carbon Products Industry Revenue Share (%), by Country 2025 & 2033
- Figure 38: Europe Advanced Carbon Products Industry Volume Share (%), by Country 2025 & 2033
- Figure 39: South America Advanced Carbon Products Industry Revenue (Million), by Product Type 2025 & 2033
- Figure 40: South America Advanced Carbon Products Industry Volume (K Tons), by Product Type 2025 & 2033
- Figure 41: South America Advanced Carbon Products Industry Revenue Share (%), by Product Type 2025 & 2033
- Figure 42: South America Advanced Carbon Products Industry Volume Share (%), by Product Type 2025 & 2033
- Figure 43: South America Advanced Carbon Products Industry Revenue (Million), by Application 2025 & 2033
- Figure 44: South America Advanced Carbon Products Industry Volume (K Tons), by Application 2025 & 2033
- Figure 45: South America Advanced Carbon Products Industry Revenue Share (%), by Application 2025 & 2033
- Figure 46: South America Advanced Carbon Products Industry Volume Share (%), by Application 2025 & 2033
- Figure 47: South America Advanced Carbon Products Industry Revenue (Million), by Country 2025 & 2033
- Figure 48: South America Advanced Carbon Products Industry Volume (K Tons), by Country 2025 & 2033
- Figure 49: South America Advanced Carbon Products Industry Revenue Share (%), by Country 2025 & 2033
- Figure 50: South America Advanced Carbon Products Industry Volume Share (%), by Country 2025 & 2033
- Figure 51: Middle East and Africa Advanced Carbon Products Industry Revenue (Million), by Product Type 2025 & 2033
- Figure 52: Middle East and Africa Advanced Carbon Products Industry Volume (K Tons), by Product Type 2025 & 2033
- Figure 53: Middle East and Africa Advanced Carbon Products Industry Revenue Share (%), by Product Type 2025 & 2033
- Figure 54: Middle East and Africa Advanced Carbon Products Industry Volume Share (%), by Product Type 2025 & 2033
- Figure 55: Middle East and Africa Advanced Carbon Products Industry Revenue (Million), by Application 2025 & 2033
- Figure 56: Middle East and Africa Advanced Carbon Products Industry Volume (K Tons), by Application 2025 & 2033
- Figure 57: Middle East and Africa Advanced Carbon Products Industry Revenue Share (%), by Application 2025 & 2033
- Figure 58: Middle East and Africa Advanced Carbon Products Industry Volume Share (%), by Application 2025 & 2033
- Figure 59: Middle East and Africa Advanced Carbon Products Industry Revenue (Million), by Country 2025 & 2033
- Figure 60: Middle East and Africa Advanced Carbon Products Industry Volume (K Tons), by Country 2025 & 2033
- Figure 61: Middle East and Africa Advanced Carbon Products Industry Revenue Share (%), by Country 2025 & 2033
- Figure 62: Middle East and Africa Advanced Carbon Products Industry Volume Share (%), by Country 2025 & 2033
List of Tables
- Table 1: Global Advanced Carbon Products Industry Revenue Million Forecast, by Product Type 2020 & 2033
- Table 2: Global Advanced Carbon Products Industry Volume K Tons Forecast, by Product Type 2020 & 2033
- Table 3: Global Advanced Carbon Products Industry Revenue Million Forecast, by Application 2020 & 2033
- Table 4: Global Advanced Carbon Products Industry Volume K Tons Forecast, by Application 2020 & 2033
- Table 5: Global Advanced Carbon Products Industry Revenue Million Forecast, by Region 2020 & 2033
- Table 6: Global Advanced Carbon Products Industry Volume K Tons Forecast, by Region 2020 & 2033
- Table 7: Global Advanced Carbon Products Industry Revenue Million Forecast, by Product Type 2020 & 2033
- Table 8: Global Advanced Carbon Products Industry Volume K Tons Forecast, by Product Type 2020 & 2033
- Table 9: Global Advanced Carbon Products Industry Revenue Million Forecast, by Application 2020 & 2033
- Table 10: Global Advanced Carbon Products Industry Volume K Tons Forecast, by Application 2020 & 2033
- Table 11: Global Advanced Carbon Products Industry Revenue Million Forecast, by Country 2020 & 2033
- Table 12: Global Advanced Carbon Products Industry Volume K Tons Forecast, by Country 2020 & 2033
- Table 13: China Advanced Carbon Products Industry Revenue (Million) Forecast, by Application 2020 & 2033
- Table 14: China Advanced Carbon Products Industry Volume (K Tons) Forecast, by Application 2020 & 2033
- Table 15: India Advanced Carbon Products Industry Revenue (Million) Forecast, by Application 2020 & 2033
- Table 16: India Advanced Carbon Products Industry Volume (K Tons) Forecast, by Application 2020 & 2033
- Table 17: Japan Advanced Carbon Products Industry Revenue (Million) Forecast, by Application 2020 & 2033
- Table 18: Japan Advanced Carbon Products Industry Volume (K Tons) Forecast, by Application 2020 & 2033
- Table 19: South Korea Advanced Carbon Products Industry Revenue (Million) Forecast, by Application 2020 & 2033
- Table 20: South Korea Advanced Carbon Products Industry Volume (K Tons) Forecast, by Application 2020 & 2033
- Table 21: Rest of Asia Pacific Advanced Carbon Products Industry Revenue (Million) Forecast, by Application 2020 & 2033
- Table 22: Rest of Asia Pacific Advanced Carbon Products Industry Volume (K Tons) Forecast, by Application 2020 & 2033
- Table 23: Global Advanced Carbon Products Industry Revenue Million Forecast, by Product Type 2020 & 2033
- Table 24: Global Advanced Carbon Products Industry Volume K Tons Forecast, by Product Type 2020 & 2033
- Table 25: Global Advanced Carbon Products Industry Revenue Million Forecast, by Application 2020 & 2033
- Table 26: Global Advanced Carbon Products Industry Volume K Tons Forecast, by Application 2020 & 2033
- Table 27: Global Advanced Carbon Products Industry Revenue Million Forecast, by Country 2020 & 2033
- Table 28: Global Advanced Carbon Products Industry Volume K Tons Forecast, by Country 2020 & 2033
- Table 29: United States Advanced Carbon Products Industry Revenue (Million) Forecast, by Application 2020 & 2033
- Table 30: United States Advanced Carbon Products Industry Volume (K Tons) Forecast, by Application 2020 & 2033
- Table 31: Canada Advanced Carbon Products Industry Revenue (Million) Forecast, by Application 2020 & 2033
- Table 32: Canada Advanced Carbon Products Industry Volume (K Tons) Forecast, by Application 2020 & 2033
- Table 33: Mexico Advanced Carbon Products Industry Revenue (Million) Forecast, by Application 2020 & 2033
- Table 34: Mexico Advanced Carbon Products Industry Volume (K Tons) Forecast, by Application 2020 & 2033
- Table 35: Global Advanced Carbon Products Industry Revenue Million Forecast, by Product Type 2020 & 2033
- Table 36: Global Advanced Carbon Products Industry Volume K Tons Forecast, by Product Type 2020 & 2033
- Table 37: Global Advanced Carbon Products Industry Revenue Million Forecast, by Application 2020 & 2033
- Table 38: Global Advanced Carbon Products Industry Volume K Tons Forecast, by Application 2020 & 2033
- Table 39: Global Advanced Carbon Products Industry Revenue Million Forecast, by Country 2020 & 2033
- Table 40: Global Advanced Carbon Products Industry Volume K Tons Forecast, by Country 2020 & 2033
- Table 41: Germany Advanced Carbon Products Industry Revenue (Million) Forecast, by Application 2020 & 2033
- Table 42: Germany Advanced Carbon Products Industry Volume (K Tons) Forecast, by Application 2020 & 2033
- Table 43: United Kingdom Advanced Carbon Products Industry Revenue (Million) Forecast, by Application 2020 & 2033
- Table 44: United Kingdom Advanced Carbon Products Industry Volume (K Tons) Forecast, by Application 2020 & 2033
- Table 45: France Advanced Carbon Products Industry Revenue (Million) Forecast, by Application 2020 & 2033
- Table 46: France Advanced Carbon Products Industry Volume (K Tons) Forecast, by Application 2020 & 2033
- Table 47: Italy Advanced Carbon Products Industry Revenue (Million) Forecast, by Application 2020 & 2033
- Table 48: Italy Advanced Carbon Products Industry Volume (K Tons) Forecast, by Application 2020 & 2033
- Table 49: Spain Advanced Carbon Products Industry Revenue (Million) Forecast, by Application 2020 & 2033
- Table 50: Spain Advanced Carbon Products Industry Volume (K Tons) Forecast, by Application 2020 & 2033
- Table 51: Russia Advanced Carbon Products Industry Revenue (Million) Forecast, by Application 2020 & 2033
- Table 52: Russia Advanced Carbon Products Industry Volume (K Tons) Forecast, by Application 2020 & 2033
- Table 53: Rest of Europe Advanced Carbon Products Industry Revenue (Million) Forecast, by Application 2020 & 2033
- Table 54: Rest of Europe Advanced Carbon Products Industry Volume (K Tons) Forecast, by Application 2020 & 2033
- Table 55: Global Advanced Carbon Products Industry Revenue Million Forecast, by Product Type 2020 & 2033
- Table 56: Global Advanced Carbon Products Industry Volume K Tons Forecast, by Product Type 2020 & 2033
- Table 57: Global Advanced Carbon Products Industry Revenue Million Forecast, by Application 2020 & 2033
- Table 58: Global Advanced Carbon Products Industry Volume K Tons Forecast, by Application 2020 & 2033
- Table 59: Global Advanced Carbon Products Industry Revenue Million Forecast, by Country 2020 & 2033
- Table 60: Global Advanced Carbon Products Industry Volume K Tons Forecast, by Country 2020 & 2033
- Table 61: Brazil Advanced Carbon Products Industry Revenue (Million) Forecast, by Application 2020 & 2033
- Table 62: Brazil Advanced Carbon Products Industry Volume (K Tons) Forecast, by Application 2020 & 2033
- Table 63: Argentina Advanced Carbon Products Industry Revenue (Million) Forecast, by Application 2020 & 2033
- Table 64: Argentina Advanced Carbon Products Industry Volume (K Tons) Forecast, by Application 2020 & 2033
- Table 65: Rest of South America Advanced Carbon Products Industry Revenue (Million) Forecast, by Application 2020 & 2033
- Table 66: Rest of South America Advanced Carbon Products Industry Volume (K Tons) Forecast, by Application 2020 & 2033
- Table 67: Global Advanced Carbon Products Industry Revenue Million Forecast, by Product Type 2020 & 2033
- Table 68: Global Advanced Carbon Products Industry Volume K Tons Forecast, by Product Type 2020 & 2033
- Table 69: Global Advanced Carbon Products Industry Revenue Million Forecast, by Application 2020 & 2033
- Table 70: Global Advanced Carbon Products Industry Volume K Tons Forecast, by Application 2020 & 2033
- Table 71: Global Advanced Carbon Products Industry Revenue Million Forecast, by Country 2020 & 2033
- Table 72: Global Advanced Carbon Products Industry Volume K Tons Forecast, by Country 2020 & 2033
- Table 73: Saudi Arabia Advanced Carbon Products Industry Revenue (Million) Forecast, by Application 2020 & 2033
- Table 74: Saudi Arabia Advanced Carbon Products Industry Volume (K Tons) Forecast, by Application 2020 & 2033
- Table 75: United Arab Emirates Advanced Carbon Products Industry Revenue (Million) Forecast, by Application 2020 & 2033
- Table 76: United Arab Emirates Advanced Carbon Products Industry Volume (K Tons) Forecast, by Application 2020 & 2033
- Table 77: South Africa Advanced Carbon Products Industry Revenue (Million) Forecast, by Application 2020 & 2033
- Table 78: South Africa Advanced Carbon Products Industry Volume (K Tons) Forecast, by Application 2020 & 2033
- Table 79: Rest of Middle East and Africa Advanced Carbon Products Industry Revenue (Million) Forecast, by Application 2020 & 2033
- Table 80: Rest of Middle East and Africa Advanced Carbon Products Industry Volume (K Tons) Forecast, by Application 2020 & 2033
Frequently Asked Questions
1. What is the projected Compound Annual Growth Rate (CAGR) of the Advanced Carbon Products Industry?
The projected CAGR is approximately 9.82%.
2. Which companies are prominent players in the Advanced Carbon Products Industry?
Key companies in the market include SGL Carbon, Jiangsu Cnano Technology Co Ltd, Haydale Graphene Industries plc, Arkema, Tokai Carbon Co Ltd, Solvay, Antolin, POCO, Perpetuus Advanced Materials PLC, FutureCarbon GmbH, Shenzhen Sanshun Nano New Materials Co Ltd, GrafTech International, Nanocyl SA, Grupo Graphenano, Graphenea Inc, Arry International Group Limited, Ningbo Morsh Technology, Hyperion Catalysis International, XG Sciences Inc , The Sixth Element (Changzhou) Materials Technology Co Ltd, Nano-C, Nippon Graphite Fiber Co Ltd, Global Graphene Group, Toyo Tanso Co Ltd, CFOAM LLC, TORAY INDUSTRIES INC, Mitsubishi Chemical Carbon Fiber and Composites Inc, Thomas Swan & Co Ltd, Hexcel Corporation, Formosa Plastics Corporation, TEIJIN LIMITED, Graphite India Limited, SHOWA DENKO K K.
3. What are the main segments of the Advanced Carbon Products Industry?
The market segments include Product Type, Application.
4. Can you provide details about the market size?
The market size is estimated to be USD XX Million as of 2022.
5. What are some drivers contributing to market growth?
Rising Demand for Carbon Fiber Reinforced Plastic in the Construction Industry; Technological Advancements in Carbon Nanotubes; Other Drivers.
6. What are the notable trends driving market growth?
Aerospace and Defense to Dominate the Market.
7. Are there any restraints impacting market growth?
High-cost of Carbon Fiber Composites; Wastage in the Production of Finished Products; Other Restraints.
8. Can you provide examples of recent developments in the market?
N/A
9. What pricing options are available for accessing the report?
Pricing options include single-user, multi-user, and enterprise licenses priced at USD 4750, USD 5250, and USD 8750 respectively.
10. Is the market size provided in terms of value or volume?
The market size is provided in terms of value, measured in Million and volume, measured in K Tons.
11. Are there any specific market keywords associated with the report?
Yes, the market keyword associated with the report is "Advanced Carbon Products Industry," which aids in identifying and referencing the specific market segment covered.
12. How do I determine which pricing option suits my needs best?
The pricing options vary based on user requirements and access needs. Individual users may opt for single-user licenses, while businesses requiring broader access may choose multi-user or enterprise licenses for cost-effective access to the report.
13. Are there any additional resources or data provided in the Advanced Carbon Products Industry report?
While the report offers comprehensive insights, it's advisable to review the specific contents or supplementary materials provided to ascertain if additional resources or data are available.
14. How can I stay updated on further developments or reports in the Advanced Carbon Products Industry?
To stay informed about further developments, trends, and reports in the Advanced Carbon Products Industry, consider subscribing to industry newsletters, following relevant companies and organizations, or regularly checking reputable industry news sources and publications.
Methodology
Step 1 - Identification of Relevant Samples Size from Population Database


Step 2 - Approaches for Defining Global Market Size (Value, Volume* & Price*)

Note*: In applicable scenarios
Step 3 - Data Sources
Primary Research
- Web Analytics
- Survey Reports
- Research Institute
- Latest Research Reports
- Opinion Leaders
Secondary Research
- Annual Reports
- White Paper
- Latest Press Release
- Industry Association
- Paid Database
- Investor Presentations

Step 4 - Data Triangulation
Involves using different sources of information in order to increase the validity of a study
These sources are likely to be stakeholders in a program - participants, other researchers, program staff, other community members, and so on.
Then we put all data in single framework & apply various statistical tools to find out the dynamic on the market.
During the analysis stage, feedback from the stakeholder groups would be compared to determine areas of agreement as well as areas of divergence

