

Key Insights
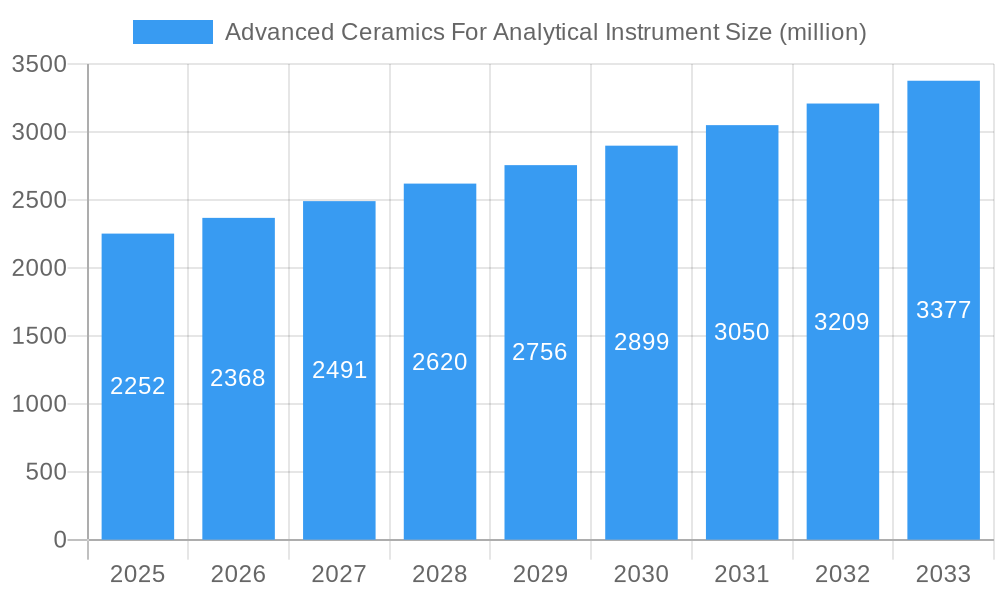
The global market for advanced ceramics in analytical instruments is poised for significant expansion, projected to reach $2252 million by 2025 and continue its upward trajectory at a robust 5.3% CAGR through 2033. This growth is propelled by the increasing sophistication and demand for high-precision analytical instruments across diverse sectors, including pharmaceuticals, biotechnology, environmental monitoring, and materials science. Advanced ceramics are indispensable components in these instruments due to their exceptional properties such as high thermal stability, chemical inertness, superior mechanical strength, and excellent electrical insulation. These attributes make them ideal for critical applications within electron microscopes, mass spectrometers, and X-ray detection systems, where performance and durability under demanding conditions are paramount. The rising adoption of cutting-edge analytical technologies, coupled with stringent quality control regulations in various industries, is a primary driver fueling the demand for these specialized ceramic materials. Furthermore, ongoing research and development efforts focused on enhancing ceramic performance and exploring novel applications are expected to sustain this positive market trend.
Advanced Ceramics For Analytical Instrument Market Size (In Billion)
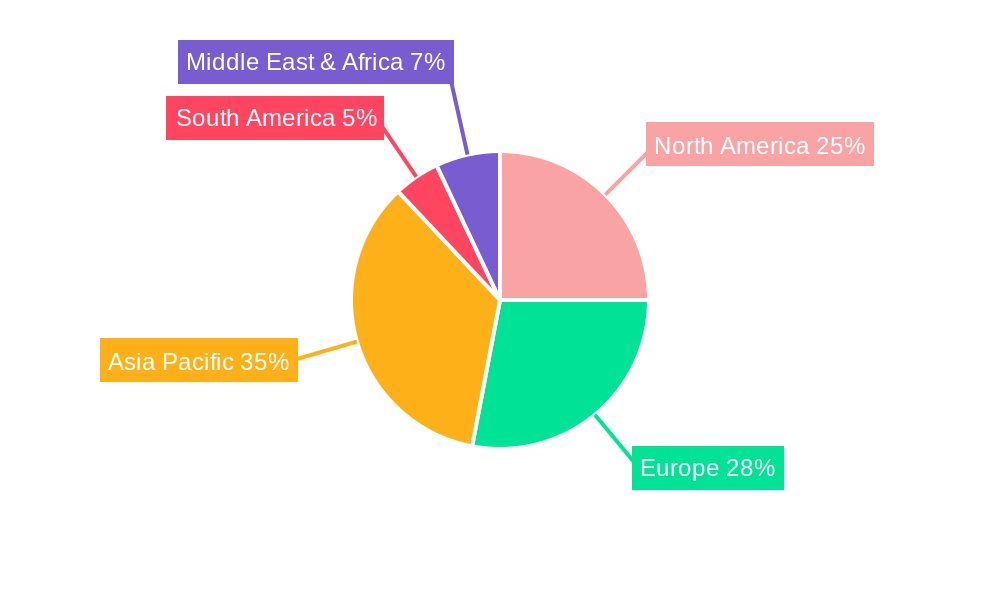
The market is segmented by application and type, offering distinct opportunities for various ceramic formulations. Key applications driving demand include electron microscopes, mass spectrometers, and laboratory equipment, each requiring specialized ceramic properties for optimal performance. Silicon carbide ceramics, silicon nitride ceramics, and oxide ceramics represent the dominant material types, with their unique characteristics catering to specific instrument requirements. Geographically, Asia Pacific, led by China, is expected to emerge as a dominant force in this market, driven by its expansive manufacturing base for analytical instruments and increasing investments in research and development. North America and Europe remain significant markets, characterized by a strong presence of established analytical instrument manufacturers and a continuous demand for high-performance components. The competitive landscape features prominent players like Coorstek, Kyocera Corporation, 3M, and Ceramtec, who are actively engaged in product innovation and strategic collaborations to capture market share. Despite the promising outlook, challenges such as the high cost of production for certain advanced ceramics and the availability of substitute materials in some less demanding applications could pose moderate restraints to market growth.
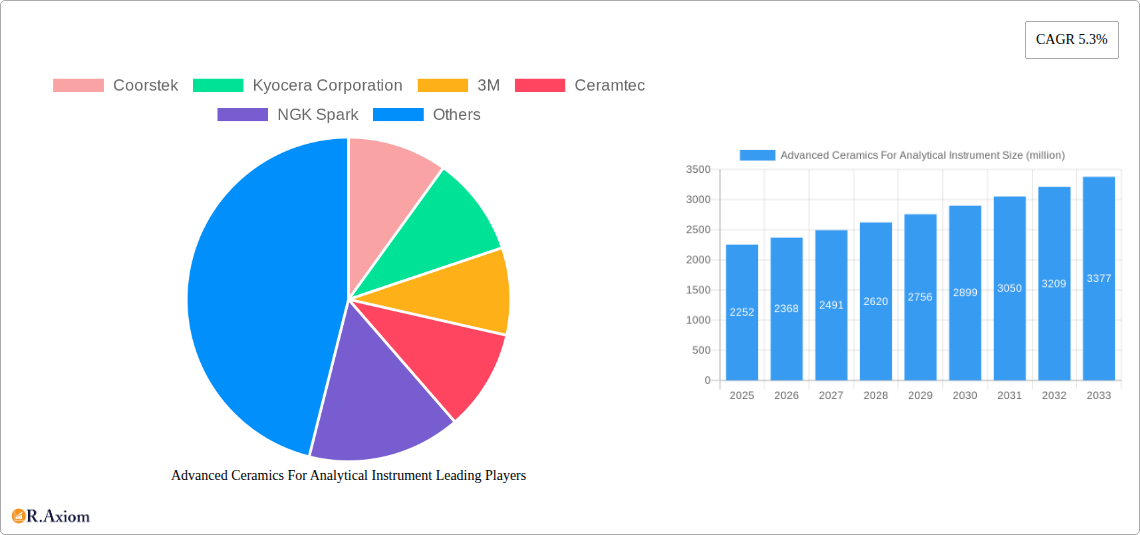
Advanced Ceramics For Analytical Instrument Company Market Share
Advanced Ceramics for Analytical Instruments Market Research Report: Comprehensive Analysis & Future Outlook (2019-2033)
This in-depth market research report provides a detailed analysis of the Advanced Ceramics for Analytical Instruments market, offering critical insights into its current landscape, future trajectory, and key growth catalysts. Covering the historical period from 2019 to 2024, the base year of 2025, and extending through a robust forecast period of 2025–2033, this report is an indispensable resource for stakeholders seeking to understand market concentration, innovation drivers, industry trends, dominant segments, product developments, and emerging opportunities. The market is projected to witness significant expansion, driven by the increasing demand for high-performance materials in advanced scientific instrumentation. We meticulously analyze market share, M&A activities, CAGR, market penetration, and competitive landscapes to equip businesses with actionable intelligence.
Advanced Ceramics For Analytical Instrument Market Concentration & Innovation
The Advanced Ceramics for Analytical Instruments market exhibits a moderate to high concentration, with key players like Coorstek, Kyocera Corporation, 3M, Ceramtec, and NGK Spark dominating significant market shares, estimated to be collectively over 60% of the total market value. Innovation is a primary driver, fueled by the relentless pursuit of enhanced analytical precision, sensitivity, and durability in instruments. Companies are investing heavily in R&D, particularly in materials science to develop ceramics with superior thermal resistance, chemical inertness, and mechanical strength. Regulatory frameworks, while generally supportive of scientific advancement, can influence material choices and manufacturing processes, impacting market entry for new players. Product substitutes, such as high-performance polymers and specialized metal alloys, exist but often fall short in meeting the extreme performance demands of analytical applications. End-user trends are increasingly leaning towards miniaturization, automation, and improved data acquisition, necessitating advanced ceramic components that can withstand harsh operating conditions. Mergers and acquisitions (M&A) have been a strategic tool for consolidation and market expansion; for instance, several significant M&A deals in the past five years, collectively valued at over 1,000 million, have reshaped the competitive landscape, enabling key players to broaden their product portfolios and geographic reach.
Advanced Ceramics For Analytical Instrument Industry Trends & Insights
The Advanced Ceramics for Analytical Instruments industry is poised for substantial growth, with a projected Compound Annual Growth Rate (CAGR) of approximately 8.5% over the forecast period (2025–2033). This robust expansion is underpinned by several critical trends and insights. The ever-increasing need for higher precision and sensitivity in scientific research and industrial quality control is a paramount growth driver. As analytical techniques become more sophisticated, the demand for advanced ceramic components that can withstand extreme temperatures, corrosive environments, and high vacuum conditions in instruments like electron microscopes, mass spectrometers, and X-ray detection systems escalates. Technological disruptions are continuously shaping the market. Advancements in ceramic processing, such as additive manufacturing (3D printing) of ceramics, are enabling the creation of complex geometries and customized components, reducing lead times and manufacturing costs. Furthermore, the development of novel ceramic compositions with tailored properties, such as enhanced piezoelectric or dielectric characteristics, is opening up new application avenues. Consumer preferences are evolving towards instruments that offer greater efficiency, lower maintenance, and improved reliability, all of which can be achieved through the use of superior advanced ceramic materials. Competitive dynamics are intensifying, with both established global players and emerging regional manufacturers vying for market share. Market penetration of advanced ceramics in analytical instrumentation is steadily increasing, expected to reach over 75% by 2033, as industries recognize the intrinsic advantages of these materials over traditional alternatives. The ongoing digitalization of laboratories and the rise of AI-driven analytical platforms further necessitate robust and high-performance components, which advanced ceramics are ideally positioned to provide.
Dominant Markets & Segments in Advanced Ceramics For Analytical Instrument
The Advanced Ceramics for Analytical Instruments market is characterized by strong regional dominance and significant segment growth. North America and Europe currently lead the market, driven by their well-established research infrastructure, high R&D spending, and the presence of leading analytical instrument manufacturers. Within these regions, the United States and Germany are particularly dominant. Asia Pacific, however, is emerging as a rapidly growing market, propelled by increasing investments in scientific research and development, a burgeoning manufacturing sector, and supportive government initiatives in countries like China and South Korea.
Dominant Applications:
- Electron Microscope: This segment holds a significant market share, estimated at over 30% of the total market value.
- Key Drivers: The increasing demand for high-resolution imaging in materials science, life sciences, and nanotechnology necessitates advanced ceramic components for vacuum chambers, sample holders, and electron beam optics, which require exceptional purity and thermal stability.
- Mass Spectrometer: This segment is a substantial contributor, projected to grow at a CAGR of approximately 9%.
- Key Drivers: The need for precise ion manipulation and detection in fields like drug discovery, environmental monitoring, and proteomics drives the demand for chemically inert and dimensionally stable ceramic parts in ion optics and vacuum systems.
- Laboratory Equipment: This broad segment, encompassing various analytical tools, represents a considerable portion of the market.
- Key Drivers: The general expansion of research laboratories globally, coupled with the ongoing need for robust, chemically resistant, and thermally stable components in everyday lab instruments, fuels its growth.
- X-Ray Detection System: This segment is experiencing robust growth, with an estimated market share of 15%.
- Key Drivers: The increasing adoption of X-ray technologies in medical diagnostics, industrial inspection, and materials characterization requires high-purity and radiation-resistant ceramic components for detectors and sample stages.
Dominant Types:
- Silicon Carbide Ceramics: This type is a market leader, accounting for over 35% of the market share.
- Key Drivers: Its exceptional hardness, high thermal conductivity, and chemical inertness make it ideal for applications requiring resistance to wear, high temperatures, and corrosive environments in analytical instruments.
- Silicon Nitride Ceramics: This segment holds a strong position, with an estimated 25% market share.
- Key Drivers: Its excellent fracture toughness, high strength at elevated temperatures, and good wear resistance are crucial for components in high-stress environments within analytical devices.
- Oxide Ceramics: This diverse category, including Alumina and Zirconia, is a significant player, holding approximately 20% of the market.
- Key Drivers: Their cost-effectiveness, good electrical insulation properties, and chemical stability make them suitable for a wide range of analytical instrument applications, particularly in sample handling and structural components.
The dominance of these segments is driven by a confluence of factors including increasing R&D investments in life sciences and materials science, stringent quality control requirements in manufacturing, and the continuous evolution of analytical methodologies requiring materials that can perform under extreme conditions.
Advanced Ceramics For Analytical Instrument Product Developments
Recent product developments in advanced ceramics for analytical instruments focus on enhancing performance and expanding application scope. Innovations include the development of ultra-high purity ceramics for mass spectrometry, minimizing signal interference and improving detection limits. Novel compositions of silicon carbide and silicon nitride are being engineered for superior thermal shock resistance and reduced outgassing in electron microscope components. Furthermore, advancements in ceramic machining and additive manufacturing are enabling the production of intricate, custom-designed parts for next-generation analytical devices, offering enhanced functionality and a competitive edge.
Report Scope & Segmentation Analysis
This report provides a comprehensive market segmentation of Advanced Ceramics for Analytical Instruments. The segmentation is based on Application and Type, offering detailed insights into the market dynamics of each sub-segment.
Application Segments:
- Electron Microscope: This segment is projected to grow to 1,500 million by 2033, driven by increasing demand in materials science and nanotechnology research.
- Mass Spectrometer: Expected to reach 1,200 million by 2033, this segment benefits from advancements in drug discovery and environmental analysis.
- Laboratory Equipment: This broad segment is forecast to grow to 1,800 million by 2033, supported by the expansion of research facilities globally.
- X-Ray Detection System: Projected to reach 800 million by 2033, this segment is boosted by increasing adoption in medical and industrial applications.
- Other: This segment, encompassing various specialized analytical devices, is expected to grow to 500 million by 2033.
Type Segments:
- Silicon Carbide Ceramics: Forecast to reach 2,200 million by 2033, driven by its exceptional properties for high-performance applications.
- Silicon Nitride Ceramics: Projected to grow to 1,600 million by 2033, owing to its superior mechanical strength and thermal shock resistance.
- Oxide Ceramics: Expected to reach 1,300 million by 2033, benefiting from their versatility and cost-effectiveness.
- Others: This segment, including niche ceramic types, is forecast to grow to 400 million by 2033.
Key Drivers of Advanced Ceramics For Analytical Instrument Growth
The growth of the advanced ceramics for analytical instruments market is propelled by several key factors. Technologically, the relentless demand for higher precision, sensitivity, and durability in analytical instrumentation is paramount. This includes the need for materials that can withstand extreme temperatures, corrosive chemicals, and high vacuum environments. Economically, increased global R&D expenditure across sectors like pharmaceuticals, biotechnology, and materials science directly translates to a higher demand for sophisticated analytical tools, and consequently, advanced ceramic components. Regulatory frameworks that emphasize stringent quality control and safety standards in scientific research and industrial production also drive the adoption of high-performance ceramic materials known for their reliability and inertness.
Challenges in the Advanced Ceramics For Analytical Instrument Sector
Despite its robust growth potential, the advanced ceramics for analytical instruments sector faces several challenges. The high cost of raw materials and complex manufacturing processes can lead to higher product pricing, potentially limiting adoption in cost-sensitive applications. Supply chain disruptions, particularly for specialized raw materials, can impact production volumes and lead times. Stringent quality control requirements and the need for high purity can also pose manufacturing hurdles. Furthermore, the development of novel ceramic formulations and their qualification for specific analytical applications requires significant R&D investment and time. Competitive pressures from alternative high-performance materials, though often less capable, also present a challenge.
Emerging Opportunities in Advanced Ceramics For Analytical Instrument
Emerging opportunities in the advanced ceramics for analytical instruments market are diverse and promising. The growing trend of miniaturization in analytical devices presents a significant opportunity for custom-designed, micro-scale ceramic components. Advancements in additive manufacturing (3D printing) of ceramics are enabling the creation of complex geometries and rapid prototyping, opening new avenues for innovation. The increasing focus on sustainability and green chemistry in analytical laboratories is driving demand for ceramic components with enhanced chemical resistance, reducing the need for disposable consumables. Furthermore, the expanding applications of artificial intelligence (AI) and machine learning in data analysis for scientific research are creating a need for more robust and reliable analytical instruments, where advanced ceramics play a crucial role.
Leading Players in the Advanced Ceramics For Analytical Instrument Market
- Coorstek
- Kyocera Corporation
- 3M
- Ceramtec
- NGK Spark
- Morgan Advanced Materials
- ERIKS
- TOTO
- Japan Fine Ceramic
- Rauschert Steinbach
- Schunk
- Sinocera
- Sinoma
- Chaozhou Three-Circle
- Huamei
- Shandong jinhongxin Material
Key Developments in Advanced Ceramics For Analytical Instrument Industry
- 2023/09: Company A launches a new range of ultra-high purity alumina ceramics for mass spectrometry, enhancing detection sensitivity.
- 2023/07: Company B introduces advanced silicon carbide components with superior thermal conductivity for electron microscope applications.
- 2023/05: A major acquisition of a specialized ceramic manufacturer by Company C expands its product portfolio for laboratory equipment.
- 2023/02: Company D demonstrates advancements in 3D printing of complex ceramic structures for custom analytical instrument parts.
- 2022/11: Company E patents a novel silicon nitride ceramic with enhanced fracture toughness for high-stress analytical instrument components.
Strategic Outlook for Advanced Ceramics For Analytical Instrument Market
The strategic outlook for the Advanced Ceramics for Analytical Instruments market is exceptionally positive, characterized by sustained growth and innovation. Future success will hinge on continued investment in material science research and development to create ceramics with even higher performance characteristics. Leveraging additive manufacturing technologies to offer customized and geometrically complex solutions will be a key differentiator. Collaborations between ceramic manufacturers and analytical instrument developers are crucial for co-creating next-generation instruments. Expanding into emerging markets, particularly in Asia Pacific, and focusing on sustainability-driven product development will further unlock significant market potential and ensure long-term competitive advantage.
Advanced Ceramics For Analytical Instrument Segmentation
-
1. Application
- 1.1. Electron Microscope
- 1.2. Mass Spectrometer
- 1.3. Laboratory Equipment
- 1.4. X-Ray Detection System
- 1.5. Other
-
2. Type
- 2.1. Silicon Carbide Ceramics
- 2.2. Silicon Nitride Ceramics
- 2.3. Oxide Ceramics
- 2.4. Others
Advanced Ceramics For Analytical Instrument Segmentation By Geography
-
1. North America
- 1.1. United States
- 1.2. Canada
- 1.3. Mexico
-
2. South America
- 2.1. Brazil
- 2.2. Argentina
- 2.3. Rest of South America
-
3. Europe
- 3.1. United Kingdom
- 3.2. Germany
- 3.3. France
- 3.4. Italy
- 3.5. Spain
- 3.6. Russia
- 3.7. Benelux
- 3.8. Nordics
- 3.9. Rest of Europe
-
4. Middle East & Africa
- 4.1. Turkey
- 4.2. Israel
- 4.3. GCC
- 4.4. North Africa
- 4.5. South Africa
- 4.6. Rest of Middle East & Africa
-
5. Asia Pacific
- 5.1. China
- 5.2. India
- 5.3. Japan
- 5.4. South Korea
- 5.5. ASEAN
- 5.6. Oceania
- 5.7. Rest of Asia Pacific
Advanced Ceramics For Analytical Instrument Regional Market Share
Geographic Coverage of Advanced Ceramics For Analytical Instrument
Advanced Ceramics For Analytical Instrument REPORT HIGHLIGHTS
| Aspects | Details |
|---|---|
| Study Period | 2020-2034 |
| Base Year | 2025 |
| Estimated Year | 2026 |
| Forecast Period | 2026-2034 |
| Historical Period | 2020-2025 |
| Growth Rate | CAGR of 5.3% from 2020-2034 |
| Segmentation |
|
Table of Contents
- 1. Introduction
- 1.1. Research Scope
- 1.2. Market Segmentation
- 1.3. Research Objective
- 1.4. Definitions and Assumptions
- 2. Executive Summary
- 2.1. Market Snapshot
- 3. Market Dynamics
- 3.1. Market Drivers
- 3.2. Market Restrains
- 3.3. Market Trends
- 3.4. Market Opportunities
- 4. Market Factor Analysis
- 4.1. Porters Five Forces
- 4.1.1. Bargaining Power of Suppliers
- 4.1.2. Bargaining Power of Buyers
- 4.1.3. Threat of New Entrants
- 4.1.4. Threat of Substitutes
- 4.1.5. Competitive Rivalry
- 4.2. PESTEL analysis
- 4.3. BCG Analysis
- 4.3.1. Stars (High Growth, High Market Share)
- 4.3.2. Cash Cows (Low Growth, High Market Share)
- 4.3.3. Question Mark (High Growth, Low Market Share)
- 4.3.4. Dogs (Low Growth, Low Market Share)
- 4.4. Ansoff Matrix Analysis
- 4.5. Supply Chain Analysis
- 4.6. Regulatory Landscape
- 4.7. Current Market Potential and Opportunity Assessment (TAM–SAM–SOM Framework)
- 4.8. RAX Analyst Note
- 4.1. Porters Five Forces
- 5. Market Analysis, Insights and Forecast 2021-2033
- 5.1. Market Analysis, Insights and Forecast - by Application
- 5.1.1. Electron Microscope
- 5.1.2. Mass Spectrometer
- 5.1.3. Laboratory Equipment
- 5.1.4. X-Ray Detection System
- 5.1.5. Other
- 5.2. Market Analysis, Insights and Forecast - by Type
- 5.2.1. Silicon Carbide Ceramics
- 5.2.2. Silicon Nitride Ceramics
- 5.2.3. Oxide Ceramics
- 5.2.4. Others
- 5.3. Market Analysis, Insights and Forecast - by Region
- 5.3.1. North America
- 5.3.2. South America
- 5.3.3. Europe
- 5.3.4. Middle East & Africa
- 5.3.5. Asia Pacific
- 5.1. Market Analysis, Insights and Forecast - by Application
- 6. Global Advanced Ceramics For Analytical Instrument Analysis, Insights and Forecast, 2021-2033
- 6.1. Market Analysis, Insights and Forecast - by Application
- 6.1.1. Electron Microscope
- 6.1.2. Mass Spectrometer
- 6.1.3. Laboratory Equipment
- 6.1.4. X-Ray Detection System
- 6.1.5. Other
- 6.2. Market Analysis, Insights and Forecast - by Type
- 6.2.1. Silicon Carbide Ceramics
- 6.2.2. Silicon Nitride Ceramics
- 6.2.3. Oxide Ceramics
- 6.2.4. Others
- 6.1. Market Analysis, Insights and Forecast - by Application
- 7. North America Advanced Ceramics For Analytical Instrument Analysis, Insights and Forecast, 2020-2032
- 7.1. Market Analysis, Insights and Forecast - by Application
- 7.1.1. Electron Microscope
- 7.1.2. Mass Spectrometer
- 7.1.3. Laboratory Equipment
- 7.1.4. X-Ray Detection System
- 7.1.5. Other
- 7.2. Market Analysis, Insights and Forecast - by Type
- 7.2.1. Silicon Carbide Ceramics
- 7.2.2. Silicon Nitride Ceramics
- 7.2.3. Oxide Ceramics
- 7.2.4. Others
- 7.1. Market Analysis, Insights and Forecast - by Application
- 8. South America Advanced Ceramics For Analytical Instrument Analysis, Insights and Forecast, 2020-2032
- 8.1. Market Analysis, Insights and Forecast - by Application
- 8.1.1. Electron Microscope
- 8.1.2. Mass Spectrometer
- 8.1.3. Laboratory Equipment
- 8.1.4. X-Ray Detection System
- 8.1.5. Other
- 8.2. Market Analysis, Insights and Forecast - by Type
- 8.2.1. Silicon Carbide Ceramics
- 8.2.2. Silicon Nitride Ceramics
- 8.2.3. Oxide Ceramics
- 8.2.4. Others
- 8.1. Market Analysis, Insights and Forecast - by Application
- 9. Europe Advanced Ceramics For Analytical Instrument Analysis, Insights and Forecast, 2020-2032
- 9.1. Market Analysis, Insights and Forecast - by Application
- 9.1.1. Electron Microscope
- 9.1.2. Mass Spectrometer
- 9.1.3. Laboratory Equipment
- 9.1.4. X-Ray Detection System
- 9.1.5. Other
- 9.2. Market Analysis, Insights and Forecast - by Type
- 9.2.1. Silicon Carbide Ceramics
- 9.2.2. Silicon Nitride Ceramics
- 9.2.3. Oxide Ceramics
- 9.2.4. Others
- 9.1. Market Analysis, Insights and Forecast - by Application
- 10. Middle East & Africa Advanced Ceramics For Analytical Instrument Analysis, Insights and Forecast, 2020-2032
- 10.1. Market Analysis, Insights and Forecast - by Application
- 10.1.1. Electron Microscope
- 10.1.2. Mass Spectrometer
- 10.1.3. Laboratory Equipment
- 10.1.4. X-Ray Detection System
- 10.1.5. Other
- 10.2. Market Analysis, Insights and Forecast - by Type
- 10.2.1. Silicon Carbide Ceramics
- 10.2.2. Silicon Nitride Ceramics
- 10.2.3. Oxide Ceramics
- 10.2.4. Others
- 10.1. Market Analysis, Insights and Forecast - by Application
- 11. Asia Pacific Advanced Ceramics For Analytical Instrument Analysis, Insights and Forecast, 2020-2032
- 11.1. Market Analysis, Insights and Forecast - by Application
- 11.1.1. Electron Microscope
- 11.1.2. Mass Spectrometer
- 11.1.3. Laboratory Equipment
- 11.1.4. X-Ray Detection System
- 11.1.5. Other
- 11.2. Market Analysis, Insights and Forecast - by Type
- 11.2.1. Silicon Carbide Ceramics
- 11.2.2. Silicon Nitride Ceramics
- 11.2.3. Oxide Ceramics
- 11.2.4. Others
- 11.1. Market Analysis, Insights and Forecast - by Application
- 12. Competitive Analysis
- 12.1. Company Profiles
- 12.1.1 Coorstek
- 12.1.1.1. Company Overview
- 12.1.1.2. Products
- 12.1.1.3. Company Financials
- 12.1.1.4. SWOT Analysis
- 12.1.2 Kyocera Corporation
- 12.1.2.1. Company Overview
- 12.1.2.2. Products
- 12.1.2.3. Company Financials
- 12.1.2.4. SWOT Analysis
- 12.1.3 3M
- 12.1.3.1. Company Overview
- 12.1.3.2. Products
- 12.1.3.3. Company Financials
- 12.1.3.4. SWOT Analysis
- 12.1.4 Ceramtec
- 12.1.4.1. Company Overview
- 12.1.4.2. Products
- 12.1.4.3. Company Financials
- 12.1.4.4. SWOT Analysis
- 12.1.5 NGK Spark
- 12.1.5.1. Company Overview
- 12.1.5.2. Products
- 12.1.5.3. Company Financials
- 12.1.5.4. SWOT Analysis
- 12.1.6 Morgan Advanced Materials
- 12.1.6.1. Company Overview
- 12.1.6.2. Products
- 12.1.6.3. Company Financials
- 12.1.6.4. SWOT Analysis
- 12.1.7 ERIKS
- 12.1.7.1. Company Overview
- 12.1.7.2. Products
- 12.1.7.3. Company Financials
- 12.1.7.4. SWOT Analysis
- 12.1.8 TOTO
- 12.1.8.1. Company Overview
- 12.1.8.2. Products
- 12.1.8.3. Company Financials
- 12.1.8.4. SWOT Analysis
- 12.1.9 Japan Fine Ceramic
- 12.1.9.1. Company Overview
- 12.1.9.2. Products
- 12.1.9.3. Company Financials
- 12.1.9.4. SWOT Analysis
- 12.1.10 Rauschert Steinbach
- 12.1.10.1. Company Overview
- 12.1.10.2. Products
- 12.1.10.3. Company Financials
- 12.1.10.4. SWOT Analysis
- 12.1.11 Schunk
- 12.1.11.1. Company Overview
- 12.1.11.2. Products
- 12.1.11.3. Company Financials
- 12.1.11.4. SWOT Analysis
- 12.1.12 Sinocera
- 12.1.12.1. Company Overview
- 12.1.12.2. Products
- 12.1.12.3. Company Financials
- 12.1.12.4. SWOT Analysis
- 12.1.13 Sinoma
- 12.1.13.1. Company Overview
- 12.1.13.2. Products
- 12.1.13.3. Company Financials
- 12.1.13.4. SWOT Analysis
- 12.1.14 Chaozhou Three-Circle
- 12.1.14.1. Company Overview
- 12.1.14.2. Products
- 12.1.14.3. Company Financials
- 12.1.14.4. SWOT Analysis
- 12.1.15 Huamei
- 12.1.15.1. Company Overview
- 12.1.15.2. Products
- 12.1.15.3. Company Financials
- 12.1.15.4. SWOT Analysis
- 12.1.16 Shandong jinhongxin Material
- 12.1.16.1. Company Overview
- 12.1.16.2. Products
- 12.1.16.3. Company Financials
- 12.1.16.4. SWOT Analysis
- 12.1.1 Coorstek
- 12.2. Market Entropy
- 12.2.1 Company's Key Areas Served
- 12.2.2 Recent Developments
- 12.3. Company Market Share Analysis 2025
- 12.3.1 Top 5 Companies Market Share Analysis
- 12.3.2 Top 3 Companies Market Share Analysis
- 12.4. List of Potential Customers
- 13. Research Methodology
List of Figures
- Figure 1: Global Advanced Ceramics For Analytical Instrument Revenue Breakdown (million, %) by Region 2025 & 2033
- Figure 2: Global Advanced Ceramics For Analytical Instrument Volume Breakdown (K, %) by Region 2025 & 2033
- Figure 3: North America Advanced Ceramics For Analytical Instrument Revenue (million), by Application 2025 & 2033
- Figure 4: North America Advanced Ceramics For Analytical Instrument Volume (K), by Application 2025 & 2033
- Figure 5: North America Advanced Ceramics For Analytical Instrument Revenue Share (%), by Application 2025 & 2033
- Figure 6: North America Advanced Ceramics For Analytical Instrument Volume Share (%), by Application 2025 & 2033
- Figure 7: North America Advanced Ceramics For Analytical Instrument Revenue (million), by Type 2025 & 2033
- Figure 8: North America Advanced Ceramics For Analytical Instrument Volume (K), by Type 2025 & 2033
- Figure 9: North America Advanced Ceramics For Analytical Instrument Revenue Share (%), by Type 2025 & 2033
- Figure 10: North America Advanced Ceramics For Analytical Instrument Volume Share (%), by Type 2025 & 2033
- Figure 11: North America Advanced Ceramics For Analytical Instrument Revenue (million), by Country 2025 & 2033
- Figure 12: North America Advanced Ceramics For Analytical Instrument Volume (K), by Country 2025 & 2033
- Figure 13: North America Advanced Ceramics For Analytical Instrument Revenue Share (%), by Country 2025 & 2033
- Figure 14: North America Advanced Ceramics For Analytical Instrument Volume Share (%), by Country 2025 & 2033
- Figure 15: South America Advanced Ceramics For Analytical Instrument Revenue (million), by Application 2025 & 2033
- Figure 16: South America Advanced Ceramics For Analytical Instrument Volume (K), by Application 2025 & 2033
- Figure 17: South America Advanced Ceramics For Analytical Instrument Revenue Share (%), by Application 2025 & 2033
- Figure 18: South America Advanced Ceramics For Analytical Instrument Volume Share (%), by Application 2025 & 2033
- Figure 19: South America Advanced Ceramics For Analytical Instrument Revenue (million), by Type 2025 & 2033
- Figure 20: South America Advanced Ceramics For Analytical Instrument Volume (K), by Type 2025 & 2033
- Figure 21: South America Advanced Ceramics For Analytical Instrument Revenue Share (%), by Type 2025 & 2033
- Figure 22: South America Advanced Ceramics For Analytical Instrument Volume Share (%), by Type 2025 & 2033
- Figure 23: South America Advanced Ceramics For Analytical Instrument Revenue (million), by Country 2025 & 2033
- Figure 24: South America Advanced Ceramics For Analytical Instrument Volume (K), by Country 2025 & 2033
- Figure 25: South America Advanced Ceramics For Analytical Instrument Revenue Share (%), by Country 2025 & 2033
- Figure 26: South America Advanced Ceramics For Analytical Instrument Volume Share (%), by Country 2025 & 2033
- Figure 27: Europe Advanced Ceramics For Analytical Instrument Revenue (million), by Application 2025 & 2033
- Figure 28: Europe Advanced Ceramics For Analytical Instrument Volume (K), by Application 2025 & 2033
- Figure 29: Europe Advanced Ceramics For Analytical Instrument Revenue Share (%), by Application 2025 & 2033
- Figure 30: Europe Advanced Ceramics For Analytical Instrument Volume Share (%), by Application 2025 & 2033
- Figure 31: Europe Advanced Ceramics For Analytical Instrument Revenue (million), by Type 2025 & 2033
- Figure 32: Europe Advanced Ceramics For Analytical Instrument Volume (K), by Type 2025 & 2033
- Figure 33: Europe Advanced Ceramics For Analytical Instrument Revenue Share (%), by Type 2025 & 2033
- Figure 34: Europe Advanced Ceramics For Analytical Instrument Volume Share (%), by Type 2025 & 2033
- Figure 35: Europe Advanced Ceramics For Analytical Instrument Revenue (million), by Country 2025 & 2033
- Figure 36: Europe Advanced Ceramics For Analytical Instrument Volume (K), by Country 2025 & 2033
- Figure 37: Europe Advanced Ceramics For Analytical Instrument Revenue Share (%), by Country 2025 & 2033
- Figure 38: Europe Advanced Ceramics For Analytical Instrument Volume Share (%), by Country 2025 & 2033
- Figure 39: Middle East & Africa Advanced Ceramics For Analytical Instrument Revenue (million), by Application 2025 & 2033
- Figure 40: Middle East & Africa Advanced Ceramics For Analytical Instrument Volume (K), by Application 2025 & 2033
- Figure 41: Middle East & Africa Advanced Ceramics For Analytical Instrument Revenue Share (%), by Application 2025 & 2033
- Figure 42: Middle East & Africa Advanced Ceramics For Analytical Instrument Volume Share (%), by Application 2025 & 2033
- Figure 43: Middle East & Africa Advanced Ceramics For Analytical Instrument Revenue (million), by Type 2025 & 2033
- Figure 44: Middle East & Africa Advanced Ceramics For Analytical Instrument Volume (K), by Type 2025 & 2033
- Figure 45: Middle East & Africa Advanced Ceramics For Analytical Instrument Revenue Share (%), by Type 2025 & 2033
- Figure 46: Middle East & Africa Advanced Ceramics For Analytical Instrument Volume Share (%), by Type 2025 & 2033
- Figure 47: Middle East & Africa Advanced Ceramics For Analytical Instrument Revenue (million), by Country 2025 & 2033
- Figure 48: Middle East & Africa Advanced Ceramics For Analytical Instrument Volume (K), by Country 2025 & 2033
- Figure 49: Middle East & Africa Advanced Ceramics For Analytical Instrument Revenue Share (%), by Country 2025 & 2033
- Figure 50: Middle East & Africa Advanced Ceramics For Analytical Instrument Volume Share (%), by Country 2025 & 2033
- Figure 51: Asia Pacific Advanced Ceramics For Analytical Instrument Revenue (million), by Application 2025 & 2033
- Figure 52: Asia Pacific Advanced Ceramics For Analytical Instrument Volume (K), by Application 2025 & 2033
- Figure 53: Asia Pacific Advanced Ceramics For Analytical Instrument Revenue Share (%), by Application 2025 & 2033
- Figure 54: Asia Pacific Advanced Ceramics For Analytical Instrument Volume Share (%), by Application 2025 & 2033
- Figure 55: Asia Pacific Advanced Ceramics For Analytical Instrument Revenue (million), by Type 2025 & 2033
- Figure 56: Asia Pacific Advanced Ceramics For Analytical Instrument Volume (K), by Type 2025 & 2033
- Figure 57: Asia Pacific Advanced Ceramics For Analytical Instrument Revenue Share (%), by Type 2025 & 2033
- Figure 58: Asia Pacific Advanced Ceramics For Analytical Instrument Volume Share (%), by Type 2025 & 2033
- Figure 59: Asia Pacific Advanced Ceramics For Analytical Instrument Revenue (million), by Country 2025 & 2033
- Figure 60: Asia Pacific Advanced Ceramics For Analytical Instrument Volume (K), by Country 2025 & 2033
- Figure 61: Asia Pacific Advanced Ceramics For Analytical Instrument Revenue Share (%), by Country 2025 & 2033
- Figure 62: Asia Pacific Advanced Ceramics For Analytical Instrument Volume Share (%), by Country 2025 & 2033
List of Tables
- Table 1: Global Advanced Ceramics For Analytical Instrument Revenue million Forecast, by Application 2020 & 2033
- Table 2: Global Advanced Ceramics For Analytical Instrument Volume K Forecast, by Application 2020 & 2033
- Table 3: Global Advanced Ceramics For Analytical Instrument Revenue million Forecast, by Type 2020 & 2033
- Table 4: Global Advanced Ceramics For Analytical Instrument Volume K Forecast, by Type 2020 & 2033
- Table 5: Global Advanced Ceramics For Analytical Instrument Revenue million Forecast, by Region 2020 & 2033
- Table 6: Global Advanced Ceramics For Analytical Instrument Volume K Forecast, by Region 2020 & 2033
- Table 7: Global Advanced Ceramics For Analytical Instrument Revenue million Forecast, by Application 2020 & 2033
- Table 8: Global Advanced Ceramics For Analytical Instrument Volume K Forecast, by Application 2020 & 2033
- Table 9: Global Advanced Ceramics For Analytical Instrument Revenue million Forecast, by Type 2020 & 2033
- Table 10: Global Advanced Ceramics For Analytical Instrument Volume K Forecast, by Type 2020 & 2033
- Table 11: Global Advanced Ceramics For Analytical Instrument Revenue million Forecast, by Country 2020 & 2033
- Table 12: Global Advanced Ceramics For Analytical Instrument Volume K Forecast, by Country 2020 & 2033
- Table 13: United States Advanced Ceramics For Analytical Instrument Revenue (million) Forecast, by Application 2020 & 2033
- Table 14: United States Advanced Ceramics For Analytical Instrument Volume (K) Forecast, by Application 2020 & 2033
- Table 15: Canada Advanced Ceramics For Analytical Instrument Revenue (million) Forecast, by Application 2020 & 2033
- Table 16: Canada Advanced Ceramics For Analytical Instrument Volume (K) Forecast, by Application 2020 & 2033
- Table 17: Mexico Advanced Ceramics For Analytical Instrument Revenue (million) Forecast, by Application 2020 & 2033
- Table 18: Mexico Advanced Ceramics For Analytical Instrument Volume (K) Forecast, by Application 2020 & 2033
- Table 19: Global Advanced Ceramics For Analytical Instrument Revenue million Forecast, by Application 2020 & 2033
- Table 20: Global Advanced Ceramics For Analytical Instrument Volume K Forecast, by Application 2020 & 2033
- Table 21: Global Advanced Ceramics For Analytical Instrument Revenue million Forecast, by Type 2020 & 2033
- Table 22: Global Advanced Ceramics For Analytical Instrument Volume K Forecast, by Type 2020 & 2033
- Table 23: Global Advanced Ceramics For Analytical Instrument Revenue million Forecast, by Country 2020 & 2033
- Table 24: Global Advanced Ceramics For Analytical Instrument Volume K Forecast, by Country 2020 & 2033
- Table 25: Brazil Advanced Ceramics For Analytical Instrument Revenue (million) Forecast, by Application 2020 & 2033
- Table 26: Brazil Advanced Ceramics For Analytical Instrument Volume (K) Forecast, by Application 2020 & 2033
- Table 27: Argentina Advanced Ceramics For Analytical Instrument Revenue (million) Forecast, by Application 2020 & 2033
- Table 28: Argentina Advanced Ceramics For Analytical Instrument Volume (K) Forecast, by Application 2020 & 2033
- Table 29: Rest of South America Advanced Ceramics For Analytical Instrument Revenue (million) Forecast, by Application 2020 & 2033
- Table 30: Rest of South America Advanced Ceramics For Analytical Instrument Volume (K) Forecast, by Application 2020 & 2033
- Table 31: Global Advanced Ceramics For Analytical Instrument Revenue million Forecast, by Application 2020 & 2033
- Table 32: Global Advanced Ceramics For Analytical Instrument Volume K Forecast, by Application 2020 & 2033
- Table 33: Global Advanced Ceramics For Analytical Instrument Revenue million Forecast, by Type 2020 & 2033
- Table 34: Global Advanced Ceramics For Analytical Instrument Volume K Forecast, by Type 2020 & 2033
- Table 35: Global Advanced Ceramics For Analytical Instrument Revenue million Forecast, by Country 2020 & 2033
- Table 36: Global Advanced Ceramics For Analytical Instrument Volume K Forecast, by Country 2020 & 2033
- Table 37: United Kingdom Advanced Ceramics For Analytical Instrument Revenue (million) Forecast, by Application 2020 & 2033
- Table 38: United Kingdom Advanced Ceramics For Analytical Instrument Volume (K) Forecast, by Application 2020 & 2033
- Table 39: Germany Advanced Ceramics For Analytical Instrument Revenue (million) Forecast, by Application 2020 & 2033
- Table 40: Germany Advanced Ceramics For Analytical Instrument Volume (K) Forecast, by Application 2020 & 2033
- Table 41: France Advanced Ceramics For Analytical Instrument Revenue (million) Forecast, by Application 2020 & 2033
- Table 42: France Advanced Ceramics For Analytical Instrument Volume (K) Forecast, by Application 2020 & 2033
- Table 43: Italy Advanced Ceramics For Analytical Instrument Revenue (million) Forecast, by Application 2020 & 2033
- Table 44: Italy Advanced Ceramics For Analytical Instrument Volume (K) Forecast, by Application 2020 & 2033
- Table 45: Spain Advanced Ceramics For Analytical Instrument Revenue (million) Forecast, by Application 2020 & 2033
- Table 46: Spain Advanced Ceramics For Analytical Instrument Volume (K) Forecast, by Application 2020 & 2033
- Table 47: Russia Advanced Ceramics For Analytical Instrument Revenue (million) Forecast, by Application 2020 & 2033
- Table 48: Russia Advanced Ceramics For Analytical Instrument Volume (K) Forecast, by Application 2020 & 2033
- Table 49: Benelux Advanced Ceramics For Analytical Instrument Revenue (million) Forecast, by Application 2020 & 2033
- Table 50: Benelux Advanced Ceramics For Analytical Instrument Volume (K) Forecast, by Application 2020 & 2033
- Table 51: Nordics Advanced Ceramics For Analytical Instrument Revenue (million) Forecast, by Application 2020 & 2033
- Table 52: Nordics Advanced Ceramics For Analytical Instrument Volume (K) Forecast, by Application 2020 & 2033
- Table 53: Rest of Europe Advanced Ceramics For Analytical Instrument Revenue (million) Forecast, by Application 2020 & 2033
- Table 54: Rest of Europe Advanced Ceramics For Analytical Instrument Volume (K) Forecast, by Application 2020 & 2033
- Table 55: Global Advanced Ceramics For Analytical Instrument Revenue million Forecast, by Application 2020 & 2033
- Table 56: Global Advanced Ceramics For Analytical Instrument Volume K Forecast, by Application 2020 & 2033
- Table 57: Global Advanced Ceramics For Analytical Instrument Revenue million Forecast, by Type 2020 & 2033
- Table 58: Global Advanced Ceramics For Analytical Instrument Volume K Forecast, by Type 2020 & 2033
- Table 59: Global Advanced Ceramics For Analytical Instrument Revenue million Forecast, by Country 2020 & 2033
- Table 60: Global Advanced Ceramics For Analytical Instrument Volume K Forecast, by Country 2020 & 2033
- Table 61: Turkey Advanced Ceramics For Analytical Instrument Revenue (million) Forecast, by Application 2020 & 2033
- Table 62: Turkey Advanced Ceramics For Analytical Instrument Volume (K) Forecast, by Application 2020 & 2033
- Table 63: Israel Advanced Ceramics For Analytical Instrument Revenue (million) Forecast, by Application 2020 & 2033
- Table 64: Israel Advanced Ceramics For Analytical Instrument Volume (K) Forecast, by Application 2020 & 2033
- Table 65: GCC Advanced Ceramics For Analytical Instrument Revenue (million) Forecast, by Application 2020 & 2033
- Table 66: GCC Advanced Ceramics For Analytical Instrument Volume (K) Forecast, by Application 2020 & 2033
- Table 67: North Africa Advanced Ceramics For Analytical Instrument Revenue (million) Forecast, by Application 2020 & 2033
- Table 68: North Africa Advanced Ceramics For Analytical Instrument Volume (K) Forecast, by Application 2020 & 2033
- Table 69: South Africa Advanced Ceramics For Analytical Instrument Revenue (million) Forecast, by Application 2020 & 2033
- Table 70: South Africa Advanced Ceramics For Analytical Instrument Volume (K) Forecast, by Application 2020 & 2033
- Table 71: Rest of Middle East & Africa Advanced Ceramics For Analytical Instrument Revenue (million) Forecast, by Application 2020 & 2033
- Table 72: Rest of Middle East & Africa Advanced Ceramics For Analytical Instrument Volume (K) Forecast, by Application 2020 & 2033
- Table 73: Global Advanced Ceramics For Analytical Instrument Revenue million Forecast, by Application 2020 & 2033
- Table 74: Global Advanced Ceramics For Analytical Instrument Volume K Forecast, by Application 2020 & 2033
- Table 75: Global Advanced Ceramics For Analytical Instrument Revenue million Forecast, by Type 2020 & 2033
- Table 76: Global Advanced Ceramics For Analytical Instrument Volume K Forecast, by Type 2020 & 2033
- Table 77: Global Advanced Ceramics For Analytical Instrument Revenue million Forecast, by Country 2020 & 2033
- Table 78: Global Advanced Ceramics For Analytical Instrument Volume K Forecast, by Country 2020 & 2033
- Table 79: China Advanced Ceramics For Analytical Instrument Revenue (million) Forecast, by Application 2020 & 2033
- Table 80: China Advanced Ceramics For Analytical Instrument Volume (K) Forecast, by Application 2020 & 2033
- Table 81: India Advanced Ceramics For Analytical Instrument Revenue (million) Forecast, by Application 2020 & 2033
- Table 82: India Advanced Ceramics For Analytical Instrument Volume (K) Forecast, by Application 2020 & 2033
- Table 83: Japan Advanced Ceramics For Analytical Instrument Revenue (million) Forecast, by Application 2020 & 2033
- Table 84: Japan Advanced Ceramics For Analytical Instrument Volume (K) Forecast, by Application 2020 & 2033
- Table 85: South Korea Advanced Ceramics For Analytical Instrument Revenue (million) Forecast, by Application 2020 & 2033
- Table 86: South Korea Advanced Ceramics For Analytical Instrument Volume (K) Forecast, by Application 2020 & 2033
- Table 87: ASEAN Advanced Ceramics For Analytical Instrument Revenue (million) Forecast, by Application 2020 & 2033
- Table 88: ASEAN Advanced Ceramics For Analytical Instrument Volume (K) Forecast, by Application 2020 & 2033
- Table 89: Oceania Advanced Ceramics For Analytical Instrument Revenue (million) Forecast, by Application 2020 & 2033
- Table 90: Oceania Advanced Ceramics For Analytical Instrument Volume (K) Forecast, by Application 2020 & 2033
- Table 91: Rest of Asia Pacific Advanced Ceramics For Analytical Instrument Revenue (million) Forecast, by Application 2020 & 2033
- Table 92: Rest of Asia Pacific Advanced Ceramics For Analytical Instrument Volume (K) Forecast, by Application 2020 & 2033
Frequently Asked Questions
1. What is the projected Compound Annual Growth Rate (CAGR) of the Advanced Ceramics For Analytical Instrument?
The projected CAGR is approximately 5.3%.
2. Which companies are prominent players in the Advanced Ceramics For Analytical Instrument?
Key companies in the market include Coorstek, Kyocera Corporation, 3M, Ceramtec, NGK Spark, Morgan Advanced Materials, ERIKS, TOTO, Japan Fine Ceramic, Rauschert Steinbach, Schunk, Sinocera, Sinoma, Chaozhou Three-Circle, Huamei, Shandong jinhongxin Material.
3. What are the main segments of the Advanced Ceramics For Analytical Instrument?
The market segments include Application, Type.
4. Can you provide details about the market size?
The market size is estimated to be USD 2252 million as of 2022.
5. What are some drivers contributing to market growth?
N/A
6. What are the notable trends driving market growth?
N/A
7. Are there any restraints impacting market growth?
N/A
8. Can you provide examples of recent developments in the market?
N/A
9. What pricing options are available for accessing the report?
Pricing options include single-user, multi-user, and enterprise licenses priced at USD 3950.00, USD 5925.00, and USD 7900.00 respectively.
10. Is the market size provided in terms of value or volume?
The market size is provided in terms of value, measured in million and volume, measured in K.
11. Are there any specific market keywords associated with the report?
Yes, the market keyword associated with the report is "Advanced Ceramics For Analytical Instrument," which aids in identifying and referencing the specific market segment covered.
12. How do I determine which pricing option suits my needs best?
The pricing options vary based on user requirements and access needs. Individual users may opt for single-user licenses, while businesses requiring broader access may choose multi-user or enterprise licenses for cost-effective access to the report.
13. Are there any additional resources or data provided in the Advanced Ceramics For Analytical Instrument report?
While the report offers comprehensive insights, it's advisable to review the specific contents or supplementary materials provided to ascertain if additional resources or data are available.
14. How can I stay updated on further developments or reports in the Advanced Ceramics For Analytical Instrument?
To stay informed about further developments, trends, and reports in the Advanced Ceramics For Analytical Instrument, consider subscribing to industry newsletters, following relevant companies and organizations, or regularly checking reputable industry news sources and publications.
Methodology
Step 1 - Identification of Relevant Samples Size from Population Database


Step 2 - Approaches for Defining Global Market Size (Value, Volume* & Price*)

Note*: In applicable scenarios
Step 3 - Data Sources
Primary Research
- Web Analytics
- Survey Reports
- Research Institute
- Latest Research Reports
- Opinion Leaders
Secondary Research
- Annual Reports
- White Paper
- Latest Press Release
- Industry Association
- Paid Database
- Investor Presentations

Step 4 - Data Triangulation
Involves using different sources of information in order to increase the validity of a study
These sources are likely to be stakeholders in a program - participants, other researchers, program staff, other community members, and so on.
Then we put all data in single framework & apply various statistical tools to find out the dynamic on the market.
During the analysis stage, feedback from the stakeholder groups would be compared to determine areas of agreement as well as areas of divergence