

Key Insights
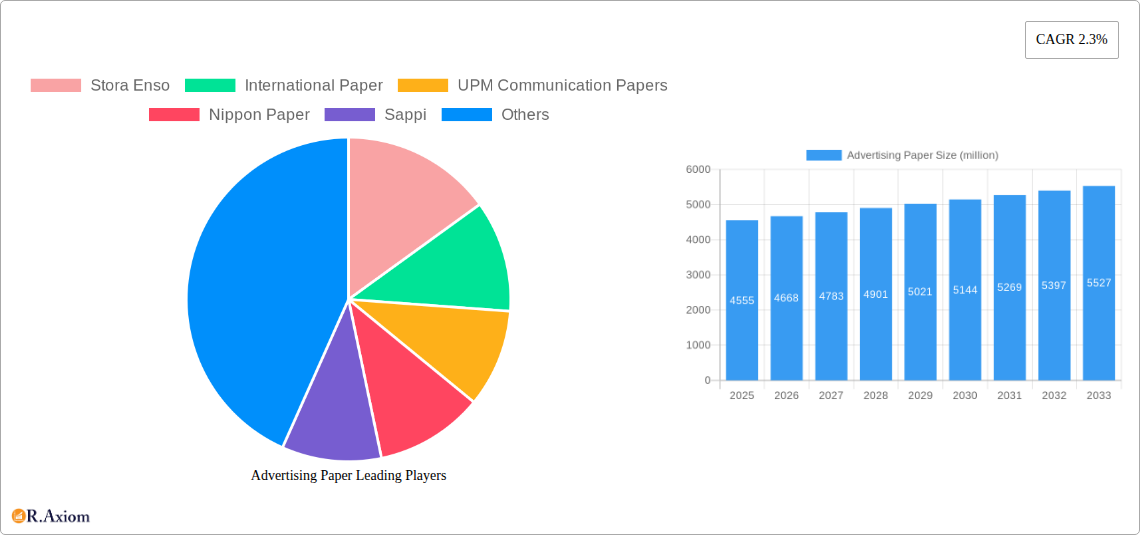
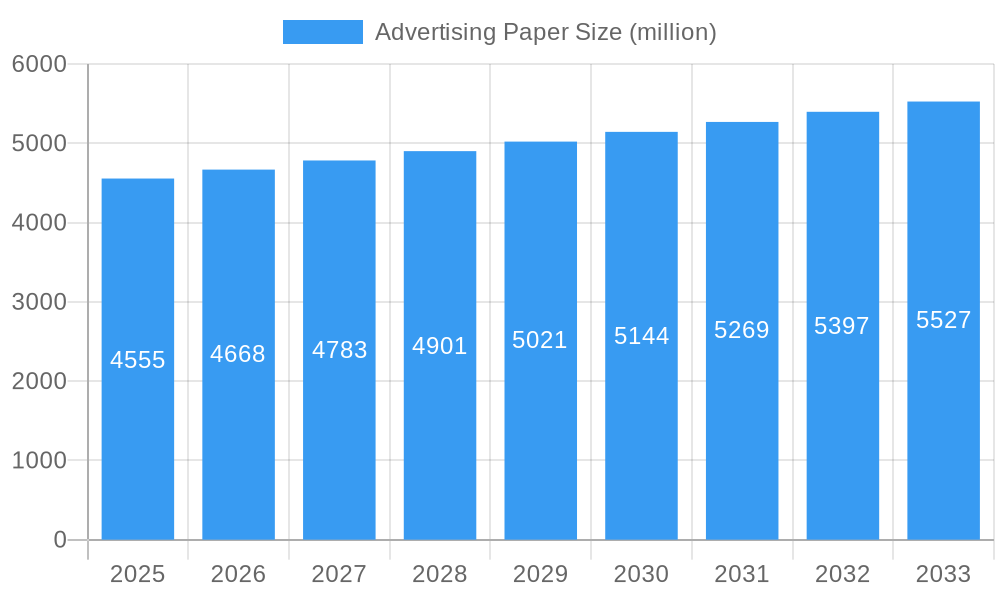
The global advertising paper market, valued at $4,555 million in 2025, is projected to experience steady growth, driven by a Compound Annual Growth Rate (CAGR) of 2.3% from 2025 to 2033. This growth is fueled by several key factors. Increased marketing and advertising spending across various industries, particularly in sectors like consumer goods and pharmaceuticals, continues to bolster demand. The growing preference for print advertising in specific niche markets, such as luxury goods and high-end publications, provides a counterbalance to the overall digital shift. Furthermore, innovative printing techniques and the development of specialized paper stocks with enhanced visual appeal contribute to market expansion. While the overall market trend indicates a gradual increase, the sector faces challenges like the persistent rise of digital marketing platforms and evolving consumer preferences, which could limit growth. Major players like Stora Enso, International Paper, and UPM Communication Papers are actively navigating these dynamics through strategic partnerships, product diversification, and sustainable practices. The competitive landscape is characterized by both established industry giants and regional players, fostering innovation and pricing competition. Geographic distribution is likely skewed towards developed economies with robust advertising sectors initially, with emerging markets exhibiting increasing demand in the later forecast period.
Advertising Paper Market Size (In Billion)
The forecast period of 2025-2033 suggests a gradual yet consistent expansion of the advertising paper market. While the digital revolution continues to pose a significant challenge, the persistence of print advertising in specific segments, coupled with continuous improvements in paper quality and printing technology, will support moderate growth. The market will likely witness increased consolidation, with larger companies leveraging their economies of scale to gain market share. Sustainability concerns are expected to play an increasingly important role, leading companies to invest in eco-friendly production methods and sourcing. Regional variations in growth will depend on factors such as economic conditions, advertising spending patterns, and regulatory frameworks governing the printing and marketing industries. Careful analysis of these variables will allow key players to strategically position themselves for long-term success.
Advertising Paper Company Market Share
Advertising Paper Market Report: 2019-2033 Forecast
This comprehensive report provides a detailed analysis of the global advertising paper market, offering actionable insights for industry stakeholders and investors. The study period covers 2019-2033, with 2025 as the base and estimated year. The forecast period is 2025-2033, and the historical period is 2019-2024. This report analyzes market trends, leading players, and future growth potential, incorporating millions in all value figures.
Advertising Paper Market Concentration & Innovation
This section analyzes the competitive landscape of the advertising paper market, examining market concentration, innovation drivers, regulatory frameworks, product substitutes, end-user trends, and mergers and acquisitions (M&A) activities. The global advertising paper market is moderately concentrated, with the top 10 players holding an estimated xx% market share in 2025. Stora Enso, International Paper, and UPM Communication Papers are among the leading players.
- Market Share: Stora Enso (xx%), International Paper (xx%), UPM Communication Papers (xx%), Nippon Paper (xx%), Sappi (xx%), Oji Paper (xx%), Domtar (xx%),Mondi Group (xx%), Burgo Group (xx%), Kruger (xx%), Huatai Group (xx%), Guangzhou Paper Group (xx%), Shanying International Holdings (xx%). These figures are estimates for 2025.
- Innovation Drivers: Growing demand for sustainable and eco-friendly packaging solutions, advancements in printing technologies, and the increasing use of digital printing are driving innovation in the advertising paper market.
- M&A Activity: The value of M&A deals in the advertising paper sector reached approximately $xx million in 2024. Consolidation is expected to continue, driven by the need for economies of scale and expansion into new markets.
- Regulatory Frameworks: Government regulations regarding environmental sustainability and waste management are influencing the production and consumption of advertising paper.
- Product Substitutes: The rise of digital advertising is a significant challenge, but paper continues to hold its ground for certain applications due to its tactile qualities and brand building potential.
Advertising Paper Industry Trends & Insights
This section delves into the key trends and insights shaping the advertising paper market, providing a detailed analysis of market growth drivers, technological disruptions, consumer preferences, and competitive dynamics. The global advertising paper market is projected to witness a CAGR of xx% during the forecast period (2025-2033), driven by factors such as increasing advertising expenditure and the continued demand for high-quality print materials in specific sectors.
Market penetration rates vary considerably across regions and segments, with higher penetration in developed markets compared to developing economies. Technological disruptions, such as the rise of digital printing, are presenting both challenges and opportunities for the industry. The increasing adoption of sustainable packaging solutions is also a significant trend, influencing the demand for recycled and eco-friendly advertising paper. Consumer preferences are shifting towards personalized and engaging advertising materials, which is creating opportunities for innovative product development. The competitive landscape is characterized by intense competition among established players and the emergence of new entrants, particularly in the specialty paper segment.
Dominant Markets & Segments in Advertising Paper
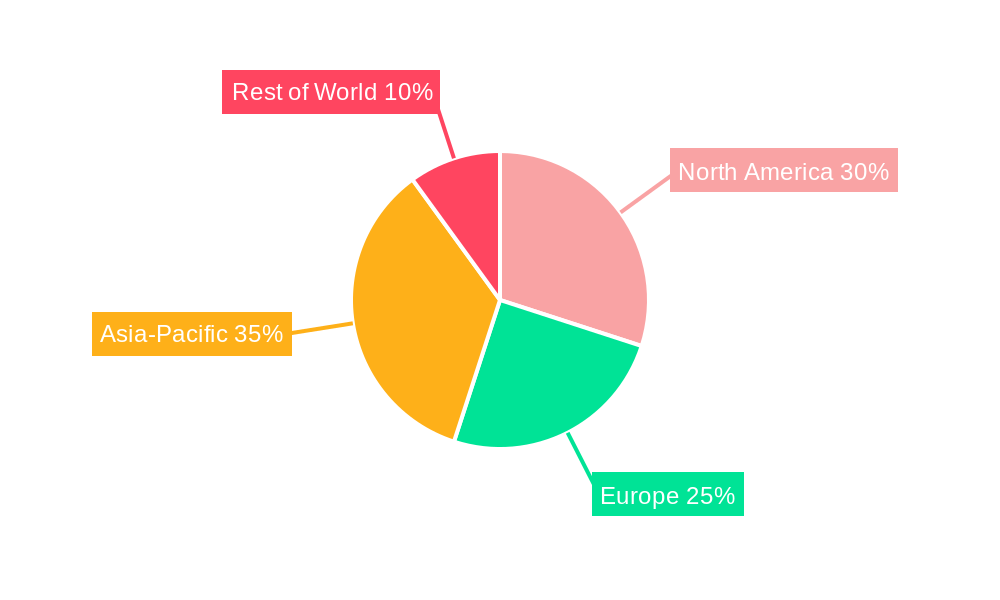
This section identifies the leading regions, countries, and segments within the advertising paper market. The analysis reveals that North America currently holds the largest market share, primarily driven by its robust advertising industry and significant demand for high-quality print materials.
- Key Drivers in North America: Strong advertising spending, well-developed infrastructure, and established print media industry.
- Dominance Analysis: North America's dominance stems from its established print media industry and high advertising spending. However, Asia-Pacific is expected to experience significant growth in the coming years due to rapid economic development and increasing advertising expenditure. The dominance of North America is expected to remain until xx, after which Asia Pacific will potentially surpass it, driven by factors like xx. Further market segmentation, including by paper type (e.g. coated, uncoated), application (e.g., brochures, flyers), is considered in this section, detailing the specifics of each segment's development and relative market share.
Advertising Paper Product Developments
Significant advancements are observed in advertising paper, particularly focusing on enhanced printability, improved sustainability through recycled content, and unique textures for tactile marketing applications. These innovations directly respond to evolving consumer preferences and the need for effective and environmentally responsible advertising materials. The development of specialized coatings and finishes enables vibrant colors, improved durability, and a wide range of design possibilities, thus enhancing the value proposition for advertisers.
Report Scope & Segmentation Analysis
This report segments the advertising paper market based on several factors, including paper type (e.g., coated, uncoated), application (e.g., brochures, flyers, posters), end-use industry (e.g., retail, FMCG, luxury goods), and geography. Each segment’s growth projection, market size, and competitive dynamics are analyzed, providing a comprehensive overview of the market landscape. Growth projections for each segment are incorporated into the analysis, offering detailed insights for strategic planning.
Key Drivers of Advertising Paper Growth
Growth in the advertising paper market is driven by several factors, including the increasing demand for high-quality print materials in emerging markets, the growing preference for personalized marketing campaigns, and the continued relevance of print advertising in certain sectors. Advances in printing technologies, coupled with increased marketing budgets in various industries, are crucial catalysts for market growth. Furthermore, the development of sustainable and eco-friendly advertising paper options is positively influencing market expansion.
Challenges in the Advertising Paper Sector
The advertising paper sector faces challenges from the increasing adoption of digital advertising, fluctuating raw material prices, and stringent environmental regulations. The transition to digital media is a significant threat, impacting the demand for traditional print materials. Supply chain disruptions and rising transportation costs add further challenges to market stability. Furthermore, stiff competition and increasing production costs constrain overall profitability. The sector estimates that these combined challenges will affect market revenue by approximately $xx million by 2033.
Emerging Opportunities in Advertising Paper
Despite challenges, opportunities exist in specialized advertising paper segments, such as high-quality coated papers for premium applications and eco-friendly options made from recycled materials. Growing demand in emerging economies and the potential for innovation in packaging solutions will drive growth. Furthermore, focusing on niche applications where print advertising maintains a strong presence can unlock significant opportunities. Investment in sustainable practices and technological advancements will be crucial for success.
Leading Players in the Advertising Paper Market
- Stora Enso
- International Paper
- UPM Communication Papers
- Nippon Paper
- Sappi
- Oji Paper
- Domtar
- Mondi Group
- Burgo Group
- Kruger
- Huatai Group
- Guangzhou Paper Group
- Shanying International Holdings
Key Developments in Advertising Paper Industry
- 2022-Q4: Stora Enso launches a new range of sustainable advertising papers.
- 2023-Q1: International Paper invests in a new paper mill.
- 2023-Q3: Merger between two smaller advertising paper companies resulting in a combined market share of xx%.
- 2024-Q2: New regulations on packaging waste in Europe.
Strategic Outlook for Advertising Paper Market
The future of the advertising paper market hinges on adapting to changing consumer preferences and technological advancements. Companies that prioritize sustainability, invest in innovation, and focus on niche market segments are expected to experience robust growth. The strategic outlook emphasizes the need for diversification and the development of value-added products to maintain a competitive edge in a constantly evolving market. The market is expected to experience growth, however, this growth will depend heavily on the continued shift toward a greater balance between digital and print-based advertising strategies. A positive strategic outlook exists for firms which embrace sustainable manufacturing processes and invest heavily in research and development.
Advertising Paper Segmentation
-
1. Application
- 1.1. Printed Advertising
- 1.2. Outdoor Advertising
- 1.3. Other
-
2. Type
- 2.1. Glossy
- 2.2. Matte
Advertising Paper Segmentation By Geography
-
1. North America
- 1.1. United States
- 1.2. Canada
- 1.3. Mexico
-
2. South America
- 2.1. Brazil
- 2.2. Argentina
- 2.3. Rest of South America
-
3. Europe
- 3.1. United Kingdom
- 3.2. Germany
- 3.3. France
- 3.4. Italy
- 3.5. Spain
- 3.6. Russia
- 3.7. Benelux
- 3.8. Nordics
- 3.9. Rest of Europe
-
4. Middle East & Africa
- 4.1. Turkey
- 4.2. Israel
- 4.3. GCC
- 4.4. North Africa
- 4.5. South Africa
- 4.6. Rest of Middle East & Africa
-
5. Asia Pacific
- 5.1. China
- 5.2. India
- 5.3. Japan
- 5.4. South Korea
- 5.5. ASEAN
- 5.6. Oceania
- 5.7. Rest of Asia Pacific
Advertising Paper Regional Market Share
Geographic Coverage of Advertising Paper
Advertising Paper REPORT HIGHLIGHTS
| Aspects | Details |
|---|---|
| Study Period | 2020-2034 |
| Base Year | 2025 |
| Estimated Year | 2026 |
| Forecast Period | 2026-2034 |
| Historical Period | 2020-2025 |
| Growth Rate | CAGR of 2.3% from 2020-2034 |
| Segmentation |
|
Table of Contents
- 1. Introduction
- 1.1. Research Scope
- 1.2. Market Segmentation
- 1.3. Research Objective
- 1.4. Definitions and Assumptions
- 2. Executive Summary
- 2.1. Market Snapshot
- 3. Market Dynamics
- 3.1. Market Drivers
- 3.2. Market Restrains
- 3.3. Market Trends
- 3.4. Market Opportunities
- 4. Market Factor Analysis
- 4.1. Porters Five Forces
- 4.1.1. Bargaining Power of Suppliers
- 4.1.2. Bargaining Power of Buyers
- 4.1.3. Threat of New Entrants
- 4.1.4. Threat of Substitutes
- 4.1.5. Competitive Rivalry
- 4.2. PESTEL analysis
- 4.3. BCG Analysis
- 4.3.1. Stars (High Growth, High Market Share)
- 4.3.2. Cash Cows (Low Growth, High Market Share)
- 4.3.3. Question Mark (High Growth, Low Market Share)
- 4.3.4. Dogs (Low Growth, Low Market Share)
- 4.4. Ansoff Matrix Analysis
- 4.5. Supply Chain Analysis
- 4.6. Regulatory Landscape
- 4.7. Current Market Potential and Opportunity Assessment (TAM–SAM–SOM Framework)
- 4.8. RAX Analyst Note
- 4.1. Porters Five Forces
- 5. Market Analysis, Insights and Forecast 2021-2033
- 5.1. Market Analysis, Insights and Forecast - by Application
- 5.1.1. Printed Advertising
- 5.1.2. Outdoor Advertising
- 5.1.3. Other
- 5.2. Market Analysis, Insights and Forecast - by Type
- 5.2.1. Glossy
- 5.2.2. Matte
- 5.3. Market Analysis, Insights and Forecast - by Region
- 5.3.1. North America
- 5.3.2. South America
- 5.3.3. Europe
- 5.3.4. Middle East & Africa
- 5.3.5. Asia Pacific
- 5.1. Market Analysis, Insights and Forecast - by Application
- 6. Global Advertising Paper Analysis, Insights and Forecast, 2021-2033
- 6.1. Market Analysis, Insights and Forecast - by Application
- 6.1.1. Printed Advertising
- 6.1.2. Outdoor Advertising
- 6.1.3. Other
- 6.2. Market Analysis, Insights and Forecast - by Type
- 6.2.1. Glossy
- 6.2.2. Matte
- 6.1. Market Analysis, Insights and Forecast - by Application
- 7. North America Advertising Paper Analysis, Insights and Forecast, 2020-2032
- 7.1. Market Analysis, Insights and Forecast - by Application
- 7.1.1. Printed Advertising
- 7.1.2. Outdoor Advertising
- 7.1.3. Other
- 7.2. Market Analysis, Insights and Forecast - by Type
- 7.2.1. Glossy
- 7.2.2. Matte
- 7.1. Market Analysis, Insights and Forecast - by Application
- 8. South America Advertising Paper Analysis, Insights and Forecast, 2020-2032
- 8.1. Market Analysis, Insights and Forecast - by Application
- 8.1.1. Printed Advertising
- 8.1.2. Outdoor Advertising
- 8.1.3. Other
- 8.2. Market Analysis, Insights and Forecast - by Type
- 8.2.1. Glossy
- 8.2.2. Matte
- 8.1. Market Analysis, Insights and Forecast - by Application
- 9. Europe Advertising Paper Analysis, Insights and Forecast, 2020-2032
- 9.1. Market Analysis, Insights and Forecast - by Application
- 9.1.1. Printed Advertising
- 9.1.2. Outdoor Advertising
- 9.1.3. Other
- 9.2. Market Analysis, Insights and Forecast - by Type
- 9.2.1. Glossy
- 9.2.2. Matte
- 9.1. Market Analysis, Insights and Forecast - by Application
- 10. Middle East & Africa Advertising Paper Analysis, Insights and Forecast, 2020-2032
- 10.1. Market Analysis, Insights and Forecast - by Application
- 10.1.1. Printed Advertising
- 10.1.2. Outdoor Advertising
- 10.1.3. Other
- 10.2. Market Analysis, Insights and Forecast - by Type
- 10.2.1. Glossy
- 10.2.2. Matte
- 10.1. Market Analysis, Insights and Forecast - by Application
- 11. Asia Pacific Advertising Paper Analysis, Insights and Forecast, 2020-2032
- 11.1. Market Analysis, Insights and Forecast - by Application
- 11.1.1. Printed Advertising
- 11.1.2. Outdoor Advertising
- 11.1.3. Other
- 11.2. Market Analysis, Insights and Forecast - by Type
- 11.2.1. Glossy
- 11.2.2. Matte
- 11.1. Market Analysis, Insights and Forecast - by Application
- 12. Competitive Analysis
- 12.1. Company Profiles
- 12.1.1 Stora Enso
- 12.1.1.1. Company Overview
- 12.1.1.2. Products
- 12.1.1.3. Company Financials
- 12.1.1.4. SWOT Analysis
- 12.1.2 International Paper
- 12.1.2.1. Company Overview
- 12.1.2.2. Products
- 12.1.2.3. Company Financials
- 12.1.2.4. SWOT Analysis
- 12.1.3 UPM Communication Papers
- 12.1.3.1. Company Overview
- 12.1.3.2. Products
- 12.1.3.3. Company Financials
- 12.1.3.4. SWOT Analysis
- 12.1.4 Nippon Paper
- 12.1.4.1. Company Overview
- 12.1.4.2. Products
- 12.1.4.3. Company Financials
- 12.1.4.4. SWOT Analysis
- 12.1.5 Sappi
- 12.1.5.1. Company Overview
- 12.1.5.2. Products
- 12.1.5.3. Company Financials
- 12.1.5.4. SWOT Analysis
- 12.1.6 Oji Paper
- 12.1.6.1. Company Overview
- 12.1.6.2. Products
- 12.1.6.3. Company Financials
- 12.1.6.4. SWOT Analysis
- 12.1.7 Domtar
- 12.1.7.1. Company Overview
- 12.1.7.2. Products
- 12.1.7.3. Company Financials
- 12.1.7.4. SWOT Analysis
- 12.1.8 Mondi Group
- 12.1.8.1. Company Overview
- 12.1.8.2. Products
- 12.1.8.3. Company Financials
- 12.1.8.4. SWOT Analysis
- 12.1.9 Burgo Group
- 12.1.9.1. Company Overview
- 12.1.9.2. Products
- 12.1.9.3. Company Financials
- 12.1.9.4. SWOT Analysis
- 12.1.10 Kruger
- 12.1.10.1. Company Overview
- 12.1.10.2. Products
- 12.1.10.3. Company Financials
- 12.1.10.4. SWOT Analysis
- 12.1.11 Huatai Group
- 12.1.11.1. Company Overview
- 12.1.11.2. Products
- 12.1.11.3. Company Financials
- 12.1.11.4. SWOT Analysis
- 12.1.12 Guangzhou Paper Group
- 12.1.12.1. Company Overview
- 12.1.12.2. Products
- 12.1.12.3. Company Financials
- 12.1.12.4. SWOT Analysis
- 12.1.13 Shanying International Holdings
- 12.1.13.1. Company Overview
- 12.1.13.2. Products
- 12.1.13.3. Company Financials
- 12.1.13.4. SWOT Analysis
- 12.1.1 Stora Enso
- 12.2. Market Entropy
- 12.2.1 Company's Key Areas Served
- 12.2.2 Recent Developments
- 12.3. Company Market Share Analysis 2025
- 12.3.1 Top 5 Companies Market Share Analysis
- 12.3.2 Top 3 Companies Market Share Analysis
- 12.4. List of Potential Customers
- 13. Research Methodology
List of Figures
- Figure 1: Global Advertising Paper Revenue Breakdown (million, %) by Region 2025 & 2033
- Figure 2: North America Advertising Paper Revenue (million), by Application 2025 & 2033
- Figure 3: North America Advertising Paper Revenue Share (%), by Application 2025 & 2033
- Figure 4: North America Advertising Paper Revenue (million), by Type 2025 & 2033
- Figure 5: North America Advertising Paper Revenue Share (%), by Type 2025 & 2033
- Figure 6: North America Advertising Paper Revenue (million), by Country 2025 & 2033
- Figure 7: North America Advertising Paper Revenue Share (%), by Country 2025 & 2033
- Figure 8: South America Advertising Paper Revenue (million), by Application 2025 & 2033
- Figure 9: South America Advertising Paper Revenue Share (%), by Application 2025 & 2033
- Figure 10: South America Advertising Paper Revenue (million), by Type 2025 & 2033
- Figure 11: South America Advertising Paper Revenue Share (%), by Type 2025 & 2033
- Figure 12: South America Advertising Paper Revenue (million), by Country 2025 & 2033
- Figure 13: South America Advertising Paper Revenue Share (%), by Country 2025 & 2033
- Figure 14: Europe Advertising Paper Revenue (million), by Application 2025 & 2033
- Figure 15: Europe Advertising Paper Revenue Share (%), by Application 2025 & 2033
- Figure 16: Europe Advertising Paper Revenue (million), by Type 2025 & 2033
- Figure 17: Europe Advertising Paper Revenue Share (%), by Type 2025 & 2033
- Figure 18: Europe Advertising Paper Revenue (million), by Country 2025 & 2033
- Figure 19: Europe Advertising Paper Revenue Share (%), by Country 2025 & 2033
- Figure 20: Middle East & Africa Advertising Paper Revenue (million), by Application 2025 & 2033
- Figure 21: Middle East & Africa Advertising Paper Revenue Share (%), by Application 2025 & 2033
- Figure 22: Middle East & Africa Advertising Paper Revenue (million), by Type 2025 & 2033
- Figure 23: Middle East & Africa Advertising Paper Revenue Share (%), by Type 2025 & 2033
- Figure 24: Middle East & Africa Advertising Paper Revenue (million), by Country 2025 & 2033
- Figure 25: Middle East & Africa Advertising Paper Revenue Share (%), by Country 2025 & 2033
- Figure 26: Asia Pacific Advertising Paper Revenue (million), by Application 2025 & 2033
- Figure 27: Asia Pacific Advertising Paper Revenue Share (%), by Application 2025 & 2033
- Figure 28: Asia Pacific Advertising Paper Revenue (million), by Type 2025 & 2033
- Figure 29: Asia Pacific Advertising Paper Revenue Share (%), by Type 2025 & 2033
- Figure 30: Asia Pacific Advertising Paper Revenue (million), by Country 2025 & 2033
- Figure 31: Asia Pacific Advertising Paper Revenue Share (%), by Country 2025 & 2033
List of Tables
- Table 1: Global Advertising Paper Revenue million Forecast, by Application 2020 & 2033
- Table 2: Global Advertising Paper Revenue million Forecast, by Type 2020 & 2033
- Table 3: Global Advertising Paper Revenue million Forecast, by Region 2020 & 2033
- Table 4: Global Advertising Paper Revenue million Forecast, by Application 2020 & 2033
- Table 5: Global Advertising Paper Revenue million Forecast, by Type 2020 & 2033
- Table 6: Global Advertising Paper Revenue million Forecast, by Country 2020 & 2033
- Table 7: United States Advertising Paper Revenue (million) Forecast, by Application 2020 & 2033
- Table 8: Canada Advertising Paper Revenue (million) Forecast, by Application 2020 & 2033
- Table 9: Mexico Advertising Paper Revenue (million) Forecast, by Application 2020 & 2033
- Table 10: Global Advertising Paper Revenue million Forecast, by Application 2020 & 2033
- Table 11: Global Advertising Paper Revenue million Forecast, by Type 2020 & 2033
- Table 12: Global Advertising Paper Revenue million Forecast, by Country 2020 & 2033
- Table 13: Brazil Advertising Paper Revenue (million) Forecast, by Application 2020 & 2033
- Table 14: Argentina Advertising Paper Revenue (million) Forecast, by Application 2020 & 2033
- Table 15: Rest of South America Advertising Paper Revenue (million) Forecast, by Application 2020 & 2033
- Table 16: Global Advertising Paper Revenue million Forecast, by Application 2020 & 2033
- Table 17: Global Advertising Paper Revenue million Forecast, by Type 2020 & 2033
- Table 18: Global Advertising Paper Revenue million Forecast, by Country 2020 & 2033
- Table 19: United Kingdom Advertising Paper Revenue (million) Forecast, by Application 2020 & 2033
- Table 20: Germany Advertising Paper Revenue (million) Forecast, by Application 2020 & 2033
- Table 21: France Advertising Paper Revenue (million) Forecast, by Application 2020 & 2033
- Table 22: Italy Advertising Paper Revenue (million) Forecast, by Application 2020 & 2033
- Table 23: Spain Advertising Paper Revenue (million) Forecast, by Application 2020 & 2033
- Table 24: Russia Advertising Paper Revenue (million) Forecast, by Application 2020 & 2033
- Table 25: Benelux Advertising Paper Revenue (million) Forecast, by Application 2020 & 2033
- Table 26: Nordics Advertising Paper Revenue (million) Forecast, by Application 2020 & 2033
- Table 27: Rest of Europe Advertising Paper Revenue (million) Forecast, by Application 2020 & 2033
- Table 28: Global Advertising Paper Revenue million Forecast, by Application 2020 & 2033
- Table 29: Global Advertising Paper Revenue million Forecast, by Type 2020 & 2033
- Table 30: Global Advertising Paper Revenue million Forecast, by Country 2020 & 2033
- Table 31: Turkey Advertising Paper Revenue (million) Forecast, by Application 2020 & 2033
- Table 32: Israel Advertising Paper Revenue (million) Forecast, by Application 2020 & 2033
- Table 33: GCC Advertising Paper Revenue (million) Forecast, by Application 2020 & 2033
- Table 34: North Africa Advertising Paper Revenue (million) Forecast, by Application 2020 & 2033
- Table 35: South Africa Advertising Paper Revenue (million) Forecast, by Application 2020 & 2033
- Table 36: Rest of Middle East & Africa Advertising Paper Revenue (million) Forecast, by Application 2020 & 2033
- Table 37: Global Advertising Paper Revenue million Forecast, by Application 2020 & 2033
- Table 38: Global Advertising Paper Revenue million Forecast, by Type 2020 & 2033
- Table 39: Global Advertising Paper Revenue million Forecast, by Country 2020 & 2033
- Table 40: China Advertising Paper Revenue (million) Forecast, by Application 2020 & 2033
- Table 41: India Advertising Paper Revenue (million) Forecast, by Application 2020 & 2033
- Table 42: Japan Advertising Paper Revenue (million) Forecast, by Application 2020 & 2033
- Table 43: South Korea Advertising Paper Revenue (million) Forecast, by Application 2020 & 2033
- Table 44: ASEAN Advertising Paper Revenue (million) Forecast, by Application 2020 & 2033
- Table 45: Oceania Advertising Paper Revenue (million) Forecast, by Application 2020 & 2033
- Table 46: Rest of Asia Pacific Advertising Paper Revenue (million) Forecast, by Application 2020 & 2033
Frequently Asked Questions
1. What is the projected Compound Annual Growth Rate (CAGR) of the Advertising Paper?
The projected CAGR is approximately 2.3%.
2. Which companies are prominent players in the Advertising Paper?
Key companies in the market include Stora Enso, International Paper, UPM Communication Papers, Nippon Paper, Sappi, Oji Paper, Domtar, Mondi Group, Burgo Group, Kruger, Huatai Group, Guangzhou Paper Group, Shanying International Holdings.
3. What are the main segments of the Advertising Paper?
The market segments include Application, Type.
4. Can you provide details about the market size?
The market size is estimated to be USD 4555 million as of 2022.
5. What are some drivers contributing to market growth?
N/A
6. What are the notable trends driving market growth?
N/A
7. Are there any restraints impacting market growth?
N/A
8. Can you provide examples of recent developments in the market?
N/A
9. What pricing options are available for accessing the report?
Pricing options include single-user, multi-user, and enterprise licenses priced at USD 2900.00, USD 4350.00, and USD 5800.00 respectively.
10. Is the market size provided in terms of value or volume?
The market size is provided in terms of value, measured in million.
11. Are there any specific market keywords associated with the report?
Yes, the market keyword associated with the report is "Advertising Paper," which aids in identifying and referencing the specific market segment covered.
12. How do I determine which pricing option suits my needs best?
The pricing options vary based on user requirements and access needs. Individual users may opt for single-user licenses, while businesses requiring broader access may choose multi-user or enterprise licenses for cost-effective access to the report.
13. Are there any additional resources or data provided in the Advertising Paper report?
While the report offers comprehensive insights, it's advisable to review the specific contents or supplementary materials provided to ascertain if additional resources or data are available.
14. How can I stay updated on further developments or reports in the Advertising Paper?
To stay informed about further developments, trends, and reports in the Advertising Paper, consider subscribing to industry newsletters, following relevant companies and organizations, or regularly checking reputable industry news sources and publications.
Methodology
Step 1 - Identification of Relevant Samples Size from Population Database


Step 2 - Approaches for Defining Global Market Size (Value, Volume* & Price*)

Note*: In applicable scenarios
Step 3 - Data Sources
Primary Research
- Web Analytics
- Survey Reports
- Research Institute
- Latest Research Reports
- Opinion Leaders
Secondary Research
- Annual Reports
- White Paper
- Latest Press Release
- Industry Association
- Paid Database
- Investor Presentations

Step 4 - Data Triangulation
Involves using different sources of information in order to increase the validity of a study
These sources are likely to be stakeholders in a program - participants, other researchers, program staff, other community members, and so on.
Then we put all data in single framework & apply various statistical tools to find out the dynamic on the market.
During the analysis stage, feedback from the stakeholder groups would be compared to determine areas of agreement as well as areas of divergence