
Key Insights
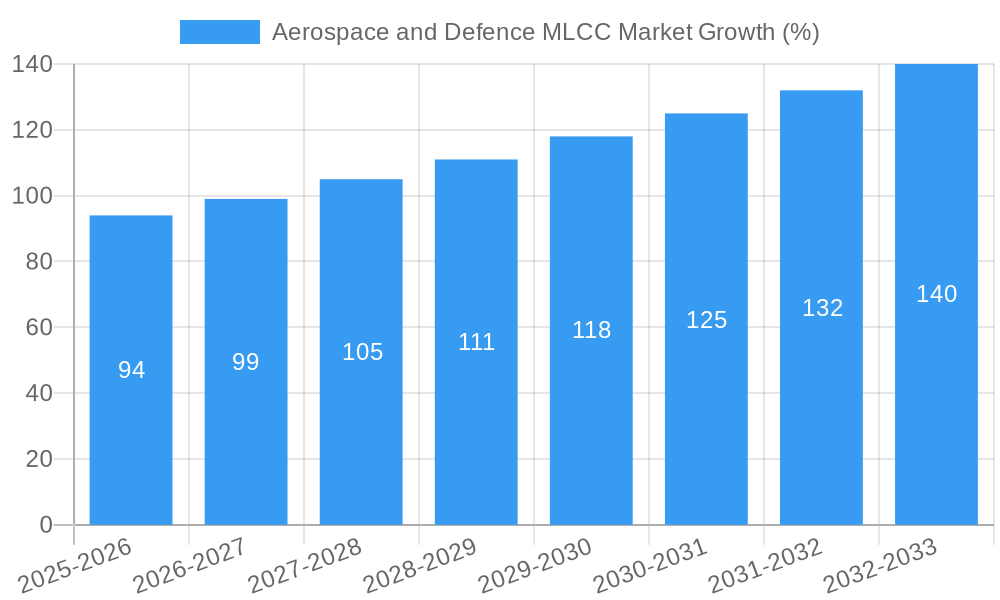
The Aerospace and Defense MLCC (Multilayer Ceramic Capacitor) market is experiencing robust growth, driven by the increasing demand for advanced electronic systems in aircraft, spacecraft, and defense applications. The market's Compound Annual Growth Rate (CAGR) of 5.91% from 2019 to 2024 suggests a healthy trajectory, expected to continue into the forecast period (2025-2033). Key drivers include the miniaturization of electronic components, the rising adoption of advanced avionics, and the growth of unmanned aerial vehicles (UAVs). Technological advancements leading to higher capacitance, voltage, and reliability are also fueling market expansion. The market is segmented by vehicle type (manned and unmanned aerial vehicles), case size, voltage rating (categorized as less than 600V, 600V to 1100V, and more than 1100V), capacitance (less than 10 μF, 10 μF to 100 μF, and more than 100 μF), and dielectric type (Class 1 and Class 2). Leading players like Vishay Intertechnology, Kyocera AVX, Murata Manufacturing, and TDK Corporation are shaping the market through innovation and strategic partnerships. While data on specific segment sizes is unavailable, the consistent CAGR suggests balanced growth across segments, with the high-voltage, high-capacitance MLCCs likely experiencing faster growth due to their use in power electronic systems within aerospace and defense applications. Market restraints may include supply chain constraints and the high cost associated with these specialized components, but ongoing technological advancements are expected to mitigate these challenges.
The forecast period (2025-2033) projects sustained growth in the Aerospace and Defense MLCC market. This growth is anticipated to be driven by continued investment in military modernization, the development of next-generation aircraft and spacecraft, and the expansion of the commercial UAV sector. The ongoing trend towards increased electronic content in aerospace and defense systems, along with a focus on enhancing reliability and performance in extreme environments, will continue to support market expansion. Competition among key players will intensify, fostering innovation and potentially leading to price reductions, making MLCCs more accessible to a wider range of applications. Geographical expansion, particularly in regions with growing defense budgets, will further contribute to market growth.
Aerospace and Defence MLCC Market: A Comprehensive Report (2019-2033)
This in-depth report provides a comprehensive analysis of the Aerospace and Defence MLCC market, offering invaluable insights for stakeholders seeking to navigate this dynamic sector. The report covers the period 2019-2033, with a focus on the forecast period 2025-2033 and a base year of 2025. It delves into market size, segmentation, growth drivers, challenges, and key players, offering actionable intelligence for informed decision-making. The report leverages extensive market research and analysis, incorporating real-world examples and projected figures to present a clear and insightful picture of the Aerospace and Defence MLCC market landscape.
Aerospace and Defence MLCC Market Concentration & Innovation
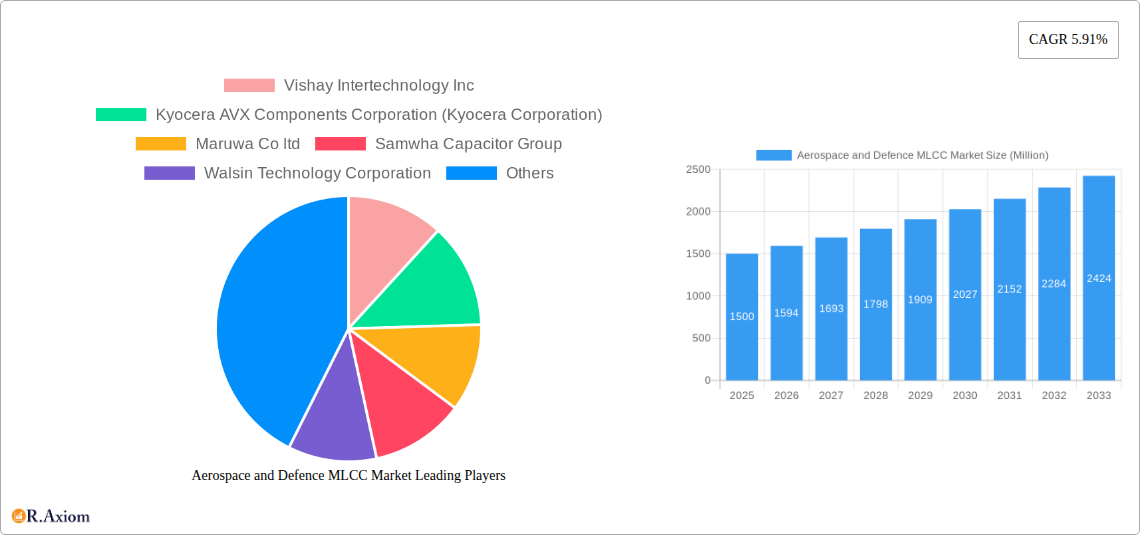
The Aerospace and Defence MLCC market exhibits a moderately concentrated landscape, with a handful of major players holding significant market share. The top ten companies, including Vishay Intertechnology Inc, Kyocera AVX Components Corporation, Murata Manufacturing Co Ltd, and TDK Corporation, collectively account for an estimated xx% of the global market in 2025. However, the market also features several smaller, specialized players focusing on niche segments.
Market innovation is primarily driven by the need for enhanced performance in harsh environments, miniaturization, and improved reliability. This is reflected in ongoing developments such as the introduction of high-CV MLCCs with enhanced thermal stability and the integration of advanced dielectric materials. Stringent regulatory frameworks, particularly concerning safety and reliability in aerospace and defense applications, significantly influence product design and manufacturing processes. The industry is witnessing a trend towards the use of advanced materials and manufacturing techniques, enabling the creation of smaller, lighter, and more efficient MLCCs. Product substitutes, while limited, include alternative passive components, but MLCCs maintain dominance due to their superior performance characteristics in high-frequency applications. End-user trends favor miniaturization and increased performance, driving the demand for smaller, higher-capacitance MLCCs with enhanced thermal and electrical properties.
M&A activity within the sector remains relatively low compared to other electronics sub-sectors. However, strategically important acquisitions focused on specific technologies or geographical expansions continue to occur. The total value of M&A deals in the Aerospace and Defence MLCC market during 2019-2024 was approximately xx Million, with an average deal size of xx Million. The predicted value for 2025-2033 is estimated at xx Million.
Aerospace and Defence MLCC Market Industry Trends & Insights
The Aerospace and Defence MLCC market is projected to experience substantial growth, with a Compound Annual Growth Rate (CAGR) of xx% during the forecast period (2025-2033). This growth is driven by several key factors, including the increasing adoption of advanced electronics in aerospace and defense systems, rising demand for high-reliability components, and the continued growth of the unmanned aerial vehicle (UAV) market. Technological disruptions, such as the advancement of miniaturization techniques and the development of new dielectric materials, are also playing a significant role.
Consumer preferences are shifting towards smaller, lighter, and more energy-efficient components that can withstand harsh operating conditions. This drives innovation in MLCC technology and design, leading to the introduction of components with improved performance and reliability. The competitive dynamics are characterized by intense competition among major players, focused on technological advancements, product differentiation, and cost reduction. Market penetration varies significantly across different regions and segments, with developed economies currently exhibiting higher adoption rates. The market penetration rate in 2025 is estimated at xx%, with a projected increase to xx% by 2033.
Dominant Markets & Segments in Aerospace and Defence MLCC Market
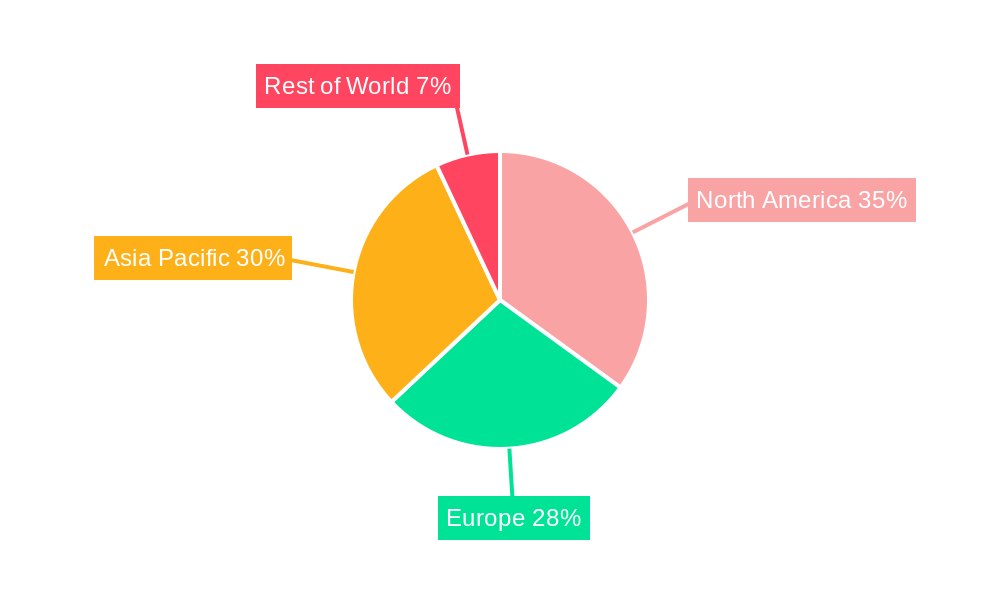
The North American region currently dominates the Aerospace and Defence MLCC market, driven by robust defense spending and a strong aerospace manufacturing base. However, Asia-Pacific is anticipated to show the fastest growth, fueled by increasing investments in aerospace and defense technologies within developing economies like China and India.
Key Drivers in North America:
- High defense budget allocations
- Strong presence of major aerospace and defense manufacturers
- Well-established supply chain infrastructure
Key Drivers in Asia-Pacific:
- Rapid growth in the UAV market
- Increasing investments in defense modernization programs
- Expanding electronics manufacturing sector
Dominant Segments:
The market is segmented by vehicle type (manned aerial vehicles and unmanned aerial vehicles), case size (000, 010, 010, 1206, 1210, others), voltage (600V to 1100V, less than 600V, more than 1100V), capacitance (10 μF to 100 μF, less than 10 μF, more than 100 μF), and dielectric type (Class I, Class II). The segment with the highest market share is currently the less than 600V voltage category, accounting for xx% of the total market, followed by the 10 μF to 100 μF capacitance segment and the 0805 case size. However, the market for higher-voltage MLCCs is expected to grow significantly over the forecast period, driven by the increasing demand for high-power applications in aerospace and defense. The growth is expected to be propelled by developments in the electric aircraft and electric propulsion systems segments.
Aerospace and Defence MLCC Market Product Developments
Recent product innovations focus on miniaturization, improved thermal stability, and enhanced reliability under harsh conditions. Manufacturers are actively developing MLCCs with higher capacitance values in smaller packages, alongside improved dielectric materials that can withstand extreme temperatures and vibrations. These advancements cater to the increasing demand for smaller, lighter, and more efficient electronic systems in aerospace and defense applications. The introduction of MLCCs with advanced features such as Flexiterm technology, which enhances resistance to thermomechanical stress, highlights the focus on reliability and performance. These advancements offer significant competitive advantages, allowing manufacturers to meet the stringent performance requirements of the aerospace and defense industry.
Report Scope & Segmentation Analysis
This report provides a comprehensive analysis of the Aerospace and Defence MLCC market, segmented by vehicle type (manned and unmanned aerial vehicles), case size (000, 010, 010, 1206, 1210, others), voltage (600V to 1100V, less than 600V, more than 1100V), capacitance (10 μF to 100 μF, less than 10 μF, more than 100 μF), and dielectric type (Class I, Class II). Each segment's market size, growth projections, and competitive landscape are assessed in detail. For example, the less than 600V voltage segment is expected to maintain its dominance throughout the forecast period due to high demand in various applications. However, the higher-voltage MLCC segment is expected to show accelerated growth rate due to developments in electric aircraft and electric propulsion systems.
Key Drivers of Aerospace and Defence MLCC Market Growth
Several key factors are driving the growth of the Aerospace and Defence MLCC market. Technological advancements leading to miniaturization and improved performance are paramount. Increasing demand for high-reliability components in advanced aerospace and defense systems fuels the market, as does rising UAV adoption. Government investments and defense spending significantly impact market expansion, especially in regions with robust defense budgets. Favorable economic conditions in key regions further contribute to the market's growth, enabling higher investments in aerospace and defense technologies.
Challenges in the Aerospace and Defence MLCC Market Sector
The Aerospace and Defence MLCC market faces challenges including stringent regulatory compliance and certification requirements, which increase the time and cost associated with product development and launch. Supply chain disruptions and material shortages pose significant threats, impacting production and potentially leading to delays or price increases. Intense competition from established and emerging players necessitates continuous innovation and cost optimization to maintain market share. The projected impact of supply chain issues on the market value in 2025 is approximately xx Million, with estimated recovery time of xx months.
Emerging Opportunities in Aerospace and Defence MLCC Market
Several emerging opportunities exist, including the growth of the electric aviation market, which is expected to increase the demand for high-power MLCCs with enhanced thermal and electrical properties. The development of new dielectric materials and improved manufacturing techniques presents opportunities for manufacturers to improve product performance and reduce costs. Expansion into emerging markets such as Asia-Pacific will also create opportunities for significant growth and market penetration.
Leading Players in the Aerospace and Defence MLCC Market Market
- Vishay Intertechnology Inc
- Kyocera AVX Components Corporation (Kyocera Corporation)
- Maruwa Co ltd
- Samwha Capacitor Group
- Walsin Technology Corporation
- Samsung Electro-Mechanics
- Yageo Corporation
- Taiyo Yuden Co Ltd
- TDK Corporation
- Murata Manufacturing Co Ltd
- Nippon Chemi-Con Corporation
Key Developments in Aerospace and Defence MLCC Market Industry
- June 2023: Introduction of NTS/NTF Series SMD type MLCCs by an unnamed company, expanding applications in on-board power supplies and voltage regulators.
- February 2023: Kyocera AVX launched MIL-PRF-32535 BME NP0 MLCCs, compact, high-CV MLCCs for high-reliability military applications, leveraging Flexiterm technology.
- October 2022: Vishay introduced a new line of surface-mount MLCCs for improved DC-blocking in RF, Bluetooth, 5G, and military radio applications.
Strategic Outlook for Aerospace and Defence MLCC Market Market
The Aerospace and Defence MLCC market exhibits strong growth potential, driven by technological advancements, increasing defense spending, and the expanding UAV sector. The continued development of electric aviation and the increasing demand for high-reliability components create significant opportunities for market expansion and diversification. Strategic partnerships, technological innovation, and expansion into emerging markets will be crucial for sustained growth and success in this dynamic sector. The predicted market value in 2033 is estimated at xx Million.
Aerospace and Defence MLCC Market Segmentation
-
1. Vehicle Type
- 1.1. Manned Aerial Vehicle
- 1.2. Unmanned Aerial Vehicle
-
2. Case Size
- 2.1. 0 201
- 2.2. 0 402
- 2.3. 0 603
- 2.4. 1 005
- 2.5. 1 210
- 2.6. Others
-
3. Voltage
- 3.1. 600V to 1100V
- 3.2. Less than 600V
- 3.3. More than 1100V
-
4. Capacitance
- 4.1. 10 μF to 100 μF
- 4.2. Less than 10 μF
- 4.3. More than 100 μF
-
5. Dielectric Type
- 5.1. Class 1
- 5.2. Class 2
Aerospace and Defence MLCC Market Segmentation By Geography
-
1. North America
- 1.1. United States
- 1.2. Canada
- 1.3. Mexico
-
2. South America
- 2.1. Brazil
- 2.2. Argentina
- 2.3. Rest of South America
-
3. Europe
- 3.1. United Kingdom
- 3.2. Germany
- 3.3. France
- 3.4. Italy
- 3.5. Spain
- 3.6. Russia
- 3.7. Benelux
- 3.8. Nordics
- 3.9. Rest of Europe
-
4. Middle East & Africa
- 4.1. Turkey
- 4.2. Israel
- 4.3. GCC
- 4.4. North Africa
- 4.5. South Africa
- 4.6. Rest of Middle East & Africa
-
5. Asia Pacific
- 5.1. China
- 5.2. India
- 5.3. Japan
- 5.4. South Korea
- 5.5. ASEAN
- 5.6. Oceania
- 5.7. Rest of Asia Pacific
Aerospace and Defence MLCC Market REPORT HIGHLIGHTS
| Aspects | Details |
|---|---|
| Study Period | 2019-2033 |
| Base Year | 2024 |
| Estimated Year | 2025 |
| Forecast Period | 2025-2033 |
| Historical Period | 2019-2024 |
| Growth Rate | CAGR of 5.91% from 2019-2033 |
| Segmentation |
|
Table of Contents
- 1. Introduction
- 1.1. Research Scope
- 1.2. Market Segmentation
- 1.3. Research Methodology
- 1.4. Definitions and Assumptions
- 2. Executive Summary
- 2.1. Introduction
- 3. Market Dynamics
- 3.1. Introduction
- 3.2. Market Drivers
- 3.2.1. Rise in the Applications of Semiconductors; Advancement in Technology Such as Magnetron Sputtering Technology
- 3.3. Market Restrains
- 3.3.1. Rise of Alternative Technologies Such as Thermal Evaporation
- 3.4. Market Trends
- 3.4.1. The global aerospace and defense MLCC market thrives amid rising defense expenditures and geopolitical dynamics
- 4. Market Factor Analysis
- 4.1. Porters Five Forces
- 4.2. Supply/Value Chain
- 4.3. PESTEL analysis
- 4.4. Market Entropy
- 4.5. Patent/Trademark Analysis
- 5. Global Aerospace and Defence MLCC Market Analysis, Insights and Forecast, 2019-2031
- 5.1. Market Analysis, Insights and Forecast - by Vehicle Type
- 5.1.1. Manned Aerial Vehicle
- 5.1.2. Unmanned Aerial Vehicle
- 5.2. Market Analysis, Insights and Forecast - by Case Size
- 5.2.1. 0 201
- 5.2.2. 0 402
- 5.2.3. 0 603
- 5.2.4. 1 005
- 5.2.5. 1 210
- 5.2.6. Others
- 5.3. Market Analysis, Insights and Forecast - by Voltage
- 5.3.1. 600V to 1100V
- 5.3.2. Less than 600V
- 5.3.3. More than 1100V
- 5.4. Market Analysis, Insights and Forecast - by Capacitance
- 5.4.1. 10 μF to 100 μF
- 5.4.2. Less than 10 μF
- 5.4.3. More than 100 μF
- 5.5. Market Analysis, Insights and Forecast - by Dielectric Type
- 5.5.1. Class 1
- 5.5.2. Class 2
- 5.6. Market Analysis, Insights and Forecast - by Region
- 5.6.1. North America
- 5.6.2. South America
- 5.6.3. Europe
- 5.6.4. Middle East & Africa
- 5.6.5. Asia Pacific
- 5.1. Market Analysis, Insights and Forecast - by Vehicle Type
- 6. North America Aerospace and Defence MLCC Market Analysis, Insights and Forecast, 2019-2031
- 6.1. Market Analysis, Insights and Forecast - by Vehicle Type
- 6.1.1. Manned Aerial Vehicle
- 6.1.2. Unmanned Aerial Vehicle
- 6.2. Market Analysis, Insights and Forecast - by Case Size
- 6.2.1. 0 201
- 6.2.2. 0 402
- 6.2.3. 0 603
- 6.2.4. 1 005
- 6.2.5. 1 210
- 6.2.6. Others
- 6.3. Market Analysis, Insights and Forecast - by Voltage
- 6.3.1. 600V to 1100V
- 6.3.2. Less than 600V
- 6.3.3. More than 1100V
- 6.4. Market Analysis, Insights and Forecast - by Capacitance
- 6.4.1. 10 μF to 100 μF
- 6.4.2. Less than 10 μF
- 6.4.3. More than 100 μF
- 6.5. Market Analysis, Insights and Forecast - by Dielectric Type
- 6.5.1. Class 1
- 6.5.2. Class 2
- 6.1. Market Analysis, Insights and Forecast - by Vehicle Type
- 7. South America Aerospace and Defence MLCC Market Analysis, Insights and Forecast, 2019-2031
- 7.1. Market Analysis, Insights and Forecast - by Vehicle Type
- 7.1.1. Manned Aerial Vehicle
- 7.1.2. Unmanned Aerial Vehicle
- 7.2. Market Analysis, Insights and Forecast - by Case Size
- 7.2.1. 0 201
- 7.2.2. 0 402
- 7.2.3. 0 603
- 7.2.4. 1 005
- 7.2.5. 1 210
- 7.2.6. Others
- 7.3. Market Analysis, Insights and Forecast - by Voltage
- 7.3.1. 600V to 1100V
- 7.3.2. Less than 600V
- 7.3.3. More than 1100V
- 7.4. Market Analysis, Insights and Forecast - by Capacitance
- 7.4.1. 10 μF to 100 μF
- 7.4.2. Less than 10 μF
- 7.4.3. More than 100 μF
- 7.5. Market Analysis, Insights and Forecast - by Dielectric Type
- 7.5.1. Class 1
- 7.5.2. Class 2
- 7.1. Market Analysis, Insights and Forecast - by Vehicle Type
- 8. Europe Aerospace and Defence MLCC Market Analysis, Insights and Forecast, 2019-2031
- 8.1. Market Analysis, Insights and Forecast - by Vehicle Type
- 8.1.1. Manned Aerial Vehicle
- 8.1.2. Unmanned Aerial Vehicle
- 8.2. Market Analysis, Insights and Forecast - by Case Size
- 8.2.1. 0 201
- 8.2.2. 0 402
- 8.2.3. 0 603
- 8.2.4. 1 005
- 8.2.5. 1 210
- 8.2.6. Others
- 8.3. Market Analysis, Insights and Forecast - by Voltage
- 8.3.1. 600V to 1100V
- 8.3.2. Less than 600V
- 8.3.3. More than 1100V
- 8.4. Market Analysis, Insights and Forecast - by Capacitance
- 8.4.1. 10 μF to 100 μF
- 8.4.2. Less than 10 μF
- 8.4.3. More than 100 μF
- 8.5. Market Analysis, Insights and Forecast - by Dielectric Type
- 8.5.1. Class 1
- 8.5.2. Class 2
- 8.1. Market Analysis, Insights and Forecast - by Vehicle Type
- 9. Middle East & Africa Aerospace and Defence MLCC Market Analysis, Insights and Forecast, 2019-2031
- 9.1. Market Analysis, Insights and Forecast - by Vehicle Type
- 9.1.1. Manned Aerial Vehicle
- 9.1.2. Unmanned Aerial Vehicle
- 9.2. Market Analysis, Insights and Forecast - by Case Size
- 9.2.1. 0 201
- 9.2.2. 0 402
- 9.2.3. 0 603
- 9.2.4. 1 005
- 9.2.5. 1 210
- 9.2.6. Others
- 9.3. Market Analysis, Insights and Forecast - by Voltage
- 9.3.1. 600V to 1100V
- 9.3.2. Less than 600V
- 9.3.3. More than 1100V
- 9.4. Market Analysis, Insights and Forecast - by Capacitance
- 9.4.1. 10 μF to 100 μF
- 9.4.2. Less than 10 μF
- 9.4.3. More than 100 μF
- 9.5. Market Analysis, Insights and Forecast - by Dielectric Type
- 9.5.1. Class 1
- 9.5.2. Class 2
- 9.1. Market Analysis, Insights and Forecast - by Vehicle Type
- 10. Asia Pacific Aerospace and Defence MLCC Market Analysis, Insights and Forecast, 2019-2031
- 10.1. Market Analysis, Insights and Forecast - by Vehicle Type
- 10.1.1. Manned Aerial Vehicle
- 10.1.2. Unmanned Aerial Vehicle
- 10.2. Market Analysis, Insights and Forecast - by Case Size
- 10.2.1. 0 201
- 10.2.2. 0 402
- 10.2.3. 0 603
- 10.2.4. 1 005
- 10.2.5. 1 210
- 10.2.6. Others
- 10.3. Market Analysis, Insights and Forecast - by Voltage
- 10.3.1. 600V to 1100V
- 10.3.2. Less than 600V
- 10.3.3. More than 1100V
- 10.4. Market Analysis, Insights and Forecast - by Capacitance
- 10.4.1. 10 μF to 100 μF
- 10.4.2. Less than 10 μF
- 10.4.3. More than 100 μF
- 10.5. Market Analysis, Insights and Forecast - by Dielectric Type
- 10.5.1. Class 1
- 10.5.2. Class 2
- 10.1. Market Analysis, Insights and Forecast - by Vehicle Type
- 11. Competitive Analysis
- 11.1. Global Market Share Analysis 2024
- 11.2. Company Profiles
- 11.2.1 Vishay Intertechnology Inc
- 11.2.1.1. Overview
- 11.2.1.2. Products
- 11.2.1.3. SWOT Analysis
- 11.2.1.4. Recent Developments
- 11.2.1.5. Financials (Based on Availability)
- 11.2.2 Kyocera AVX Components Corporation (Kyocera Corporation)
- 11.2.2.1. Overview
- 11.2.2.2. Products
- 11.2.2.3. SWOT Analysis
- 11.2.2.4. Recent Developments
- 11.2.2.5. Financials (Based on Availability)
- 11.2.3 Maruwa Co ltd
- 11.2.3.1. Overview
- 11.2.3.2. Products
- 11.2.3.3. SWOT Analysis
- 11.2.3.4. Recent Developments
- 11.2.3.5. Financials (Based on Availability)
- 11.2.4 Samwha Capacitor Group
- 11.2.4.1. Overview
- 11.2.4.2. Products
- 11.2.4.3. SWOT Analysis
- 11.2.4.4. Recent Developments
- 11.2.4.5. Financials (Based on Availability)
- 11.2.5 Walsin Technology Corporation
- 11.2.5.1. Overview
- 11.2.5.2. Products
- 11.2.5.3. SWOT Analysis
- 11.2.5.4. Recent Developments
- 11.2.5.5. Financials (Based on Availability)
- 11.2.6 Samsung Electro-Mechanics
- 11.2.6.1. Overview
- 11.2.6.2. Products
- 11.2.6.3. SWOT Analysis
- 11.2.6.4. Recent Developments
- 11.2.6.5. Financials (Based on Availability)
- 11.2.7 Yageo Corporatio
- 11.2.7.1. Overview
- 11.2.7.2. Products
- 11.2.7.3. SWOT Analysis
- 11.2.7.4. Recent Developments
- 11.2.7.5. Financials (Based on Availability)
- 11.2.8 Taiyo Yuden Co Ltd
- 11.2.8.1. Overview
- 11.2.8.2. Products
- 11.2.8.3. SWOT Analysis
- 11.2.8.4. Recent Developments
- 11.2.8.5. Financials (Based on Availability)
- 11.2.9 TDK Corporation
- 11.2.9.1. Overview
- 11.2.9.2. Products
- 11.2.9.3. SWOT Analysis
- 11.2.9.4. Recent Developments
- 11.2.9.5. Financials (Based on Availability)
- 11.2.10 Murata Manufacturing Co Ltd
- 11.2.10.1. Overview
- 11.2.10.2. Products
- 11.2.10.3. SWOT Analysis
- 11.2.10.4. Recent Developments
- 11.2.10.5. Financials (Based on Availability)
- 11.2.11 Nippon Chemi-Con Corporation
- 11.2.11.1. Overview
- 11.2.11.2. Products
- 11.2.11.3. SWOT Analysis
- 11.2.11.4. Recent Developments
- 11.2.11.5. Financials (Based on Availability)
- 11.2.1 Vishay Intertechnology Inc
List of Figures
- Figure 1: Global Aerospace and Defence MLCC Market Revenue Breakdown (Million, %) by Region 2024 & 2032
- Figure 2: North America Aerospace and Defence MLCC Market Revenue (Million), by Vehicle Type 2024 & 2032
- Figure 3: North America Aerospace and Defence MLCC Market Revenue Share (%), by Vehicle Type 2024 & 2032
- Figure 4: North America Aerospace and Defence MLCC Market Revenue (Million), by Case Size 2024 & 2032
- Figure 5: North America Aerospace and Defence MLCC Market Revenue Share (%), by Case Size 2024 & 2032
- Figure 6: North America Aerospace and Defence MLCC Market Revenue (Million), by Voltage 2024 & 2032
- Figure 7: North America Aerospace and Defence MLCC Market Revenue Share (%), by Voltage 2024 & 2032
- Figure 8: North America Aerospace and Defence MLCC Market Revenue (Million), by Capacitance 2024 & 2032
- Figure 9: North America Aerospace and Defence MLCC Market Revenue Share (%), by Capacitance 2024 & 2032
- Figure 10: North America Aerospace and Defence MLCC Market Revenue (Million), by Dielectric Type 2024 & 2032
- Figure 11: North America Aerospace and Defence MLCC Market Revenue Share (%), by Dielectric Type 2024 & 2032
- Figure 12: North America Aerospace and Defence MLCC Market Revenue (Million), by Country 2024 & 2032
- Figure 13: North America Aerospace and Defence MLCC Market Revenue Share (%), by Country 2024 & 2032
- Figure 14: South America Aerospace and Defence MLCC Market Revenue (Million), by Vehicle Type 2024 & 2032
- Figure 15: South America Aerospace and Defence MLCC Market Revenue Share (%), by Vehicle Type 2024 & 2032
- Figure 16: South America Aerospace and Defence MLCC Market Revenue (Million), by Case Size 2024 & 2032
- Figure 17: South America Aerospace and Defence MLCC Market Revenue Share (%), by Case Size 2024 & 2032
- Figure 18: South America Aerospace and Defence MLCC Market Revenue (Million), by Voltage 2024 & 2032
- Figure 19: South America Aerospace and Defence MLCC Market Revenue Share (%), by Voltage 2024 & 2032
- Figure 20: South America Aerospace and Defence MLCC Market Revenue (Million), by Capacitance 2024 & 2032
- Figure 21: South America Aerospace and Defence MLCC Market Revenue Share (%), by Capacitance 2024 & 2032
- Figure 22: South America Aerospace and Defence MLCC Market Revenue (Million), by Dielectric Type 2024 & 2032
- Figure 23: South America Aerospace and Defence MLCC Market Revenue Share (%), by Dielectric Type 2024 & 2032
- Figure 24: South America Aerospace and Defence MLCC Market Revenue (Million), by Country 2024 & 2032
- Figure 25: South America Aerospace and Defence MLCC Market Revenue Share (%), by Country 2024 & 2032
- Figure 26: Europe Aerospace and Defence MLCC Market Revenue (Million), by Vehicle Type 2024 & 2032
- Figure 27: Europe Aerospace and Defence MLCC Market Revenue Share (%), by Vehicle Type 2024 & 2032
- Figure 28: Europe Aerospace and Defence MLCC Market Revenue (Million), by Case Size 2024 & 2032
- Figure 29: Europe Aerospace and Defence MLCC Market Revenue Share (%), by Case Size 2024 & 2032
- Figure 30: Europe Aerospace and Defence MLCC Market Revenue (Million), by Voltage 2024 & 2032
- Figure 31: Europe Aerospace and Defence MLCC Market Revenue Share (%), by Voltage 2024 & 2032
- Figure 32: Europe Aerospace and Defence MLCC Market Revenue (Million), by Capacitance 2024 & 2032
- Figure 33: Europe Aerospace and Defence MLCC Market Revenue Share (%), by Capacitance 2024 & 2032
- Figure 34: Europe Aerospace and Defence MLCC Market Revenue (Million), by Dielectric Type 2024 & 2032
- Figure 35: Europe Aerospace and Defence MLCC Market Revenue Share (%), by Dielectric Type 2024 & 2032
- Figure 36: Europe Aerospace and Defence MLCC Market Revenue (Million), by Country 2024 & 2032
- Figure 37: Europe Aerospace and Defence MLCC Market Revenue Share (%), by Country 2024 & 2032
- Figure 38: Middle East & Africa Aerospace and Defence MLCC Market Revenue (Million), by Vehicle Type 2024 & 2032
- Figure 39: Middle East & Africa Aerospace and Defence MLCC Market Revenue Share (%), by Vehicle Type 2024 & 2032
- Figure 40: Middle East & Africa Aerospace and Defence MLCC Market Revenue (Million), by Case Size 2024 & 2032
- Figure 41: Middle East & Africa Aerospace and Defence MLCC Market Revenue Share (%), by Case Size 2024 & 2032
- Figure 42: Middle East & Africa Aerospace and Defence MLCC Market Revenue (Million), by Voltage 2024 & 2032
- Figure 43: Middle East & Africa Aerospace and Defence MLCC Market Revenue Share (%), by Voltage 2024 & 2032
- Figure 44: Middle East & Africa Aerospace and Defence MLCC Market Revenue (Million), by Capacitance 2024 & 2032
- Figure 45: Middle East & Africa Aerospace and Defence MLCC Market Revenue Share (%), by Capacitance 2024 & 2032
- Figure 46: Middle East & Africa Aerospace and Defence MLCC Market Revenue (Million), by Dielectric Type 2024 & 2032
- Figure 47: Middle East & Africa Aerospace and Defence MLCC Market Revenue Share (%), by Dielectric Type 2024 & 2032
- Figure 48: Middle East & Africa Aerospace and Defence MLCC Market Revenue (Million), by Country 2024 & 2032
- Figure 49: Middle East & Africa Aerospace and Defence MLCC Market Revenue Share (%), by Country 2024 & 2032
- Figure 50: Asia Pacific Aerospace and Defence MLCC Market Revenue (Million), by Vehicle Type 2024 & 2032
- Figure 51: Asia Pacific Aerospace and Defence MLCC Market Revenue Share (%), by Vehicle Type 2024 & 2032
- Figure 52: Asia Pacific Aerospace and Defence MLCC Market Revenue (Million), by Case Size 2024 & 2032
- Figure 53: Asia Pacific Aerospace and Defence MLCC Market Revenue Share (%), by Case Size 2024 & 2032
- Figure 54: Asia Pacific Aerospace and Defence MLCC Market Revenue (Million), by Voltage 2024 & 2032
- Figure 55: Asia Pacific Aerospace and Defence MLCC Market Revenue Share (%), by Voltage 2024 & 2032
- Figure 56: Asia Pacific Aerospace and Defence MLCC Market Revenue (Million), by Capacitance 2024 & 2032
- Figure 57: Asia Pacific Aerospace and Defence MLCC Market Revenue Share (%), by Capacitance 2024 & 2032
- Figure 58: Asia Pacific Aerospace and Defence MLCC Market Revenue (Million), by Dielectric Type 2024 & 2032
- Figure 59: Asia Pacific Aerospace and Defence MLCC Market Revenue Share (%), by Dielectric Type 2024 & 2032
- Figure 60: Asia Pacific Aerospace and Defence MLCC Market Revenue (Million), by Country 2024 & 2032
- Figure 61: Asia Pacific Aerospace and Defence MLCC Market Revenue Share (%), by Country 2024 & 2032
List of Tables
- Table 1: Global Aerospace and Defence MLCC Market Revenue Million Forecast, by Region 2019 & 2032
- Table 2: Global Aerospace and Defence MLCC Market Revenue Million Forecast, by Vehicle Type 2019 & 2032
- Table 3: Global Aerospace and Defence MLCC Market Revenue Million Forecast, by Case Size 2019 & 2032
- Table 4: Global Aerospace and Defence MLCC Market Revenue Million Forecast, by Voltage 2019 & 2032
- Table 5: Global Aerospace and Defence MLCC Market Revenue Million Forecast, by Capacitance 2019 & 2032
- Table 6: Global Aerospace and Defence MLCC Market Revenue Million Forecast, by Dielectric Type 2019 & 2032
- Table 7: Global Aerospace and Defence MLCC Market Revenue Million Forecast, by Region 2019 & 2032
- Table 8: Global Aerospace and Defence MLCC Market Revenue Million Forecast, by Vehicle Type 2019 & 2032
- Table 9: Global Aerospace and Defence MLCC Market Revenue Million Forecast, by Case Size 2019 & 2032
- Table 10: Global Aerospace and Defence MLCC Market Revenue Million Forecast, by Voltage 2019 & 2032
- Table 11: Global Aerospace and Defence MLCC Market Revenue Million Forecast, by Capacitance 2019 & 2032
- Table 12: Global Aerospace and Defence MLCC Market Revenue Million Forecast, by Dielectric Type 2019 & 2032
- Table 13: Global Aerospace and Defence MLCC Market Revenue Million Forecast, by Country 2019 & 2032
- Table 14: United States Aerospace and Defence MLCC Market Revenue (Million) Forecast, by Application 2019 & 2032
- Table 15: Canada Aerospace and Defence MLCC Market Revenue (Million) Forecast, by Application 2019 & 2032
- Table 16: Mexico Aerospace and Defence MLCC Market Revenue (Million) Forecast, by Application 2019 & 2032
- Table 17: Global Aerospace and Defence MLCC Market Revenue Million Forecast, by Vehicle Type 2019 & 2032
- Table 18: Global Aerospace and Defence MLCC Market Revenue Million Forecast, by Case Size 2019 & 2032
- Table 19: Global Aerospace and Defence MLCC Market Revenue Million Forecast, by Voltage 2019 & 2032
- Table 20: Global Aerospace and Defence MLCC Market Revenue Million Forecast, by Capacitance 2019 & 2032
- Table 21: Global Aerospace and Defence MLCC Market Revenue Million Forecast, by Dielectric Type 2019 & 2032
- Table 22: Global Aerospace and Defence MLCC Market Revenue Million Forecast, by Country 2019 & 2032
- Table 23: Brazil Aerospace and Defence MLCC Market Revenue (Million) Forecast, by Application 2019 & 2032
- Table 24: Argentina Aerospace and Defence MLCC Market Revenue (Million) Forecast, by Application 2019 & 2032
- Table 25: Rest of South America Aerospace and Defence MLCC Market Revenue (Million) Forecast, by Application 2019 & 2032
- Table 26: Global Aerospace and Defence MLCC Market Revenue Million Forecast, by Vehicle Type 2019 & 2032
- Table 27: Global Aerospace and Defence MLCC Market Revenue Million Forecast, by Case Size 2019 & 2032
- Table 28: Global Aerospace and Defence MLCC Market Revenue Million Forecast, by Voltage 2019 & 2032
- Table 29: Global Aerospace and Defence MLCC Market Revenue Million Forecast, by Capacitance 2019 & 2032
- Table 30: Global Aerospace and Defence MLCC Market Revenue Million Forecast, by Dielectric Type 2019 & 2032
- Table 31: Global Aerospace and Defence MLCC Market Revenue Million Forecast, by Country 2019 & 2032
- Table 32: United Kingdom Aerospace and Defence MLCC Market Revenue (Million) Forecast, by Application 2019 & 2032
- Table 33: Germany Aerospace and Defence MLCC Market Revenue (Million) Forecast, by Application 2019 & 2032
- Table 34: France Aerospace and Defence MLCC Market Revenue (Million) Forecast, by Application 2019 & 2032
- Table 35: Italy Aerospace and Defence MLCC Market Revenue (Million) Forecast, by Application 2019 & 2032
- Table 36: Spain Aerospace and Defence MLCC Market Revenue (Million) Forecast, by Application 2019 & 2032
- Table 37: Russia Aerospace and Defence MLCC Market Revenue (Million) Forecast, by Application 2019 & 2032
- Table 38: Benelux Aerospace and Defence MLCC Market Revenue (Million) Forecast, by Application 2019 & 2032
- Table 39: Nordics Aerospace and Defence MLCC Market Revenue (Million) Forecast, by Application 2019 & 2032
- Table 40: Rest of Europe Aerospace and Defence MLCC Market Revenue (Million) Forecast, by Application 2019 & 2032
- Table 41: Global Aerospace and Defence MLCC Market Revenue Million Forecast, by Vehicle Type 2019 & 2032
- Table 42: Global Aerospace and Defence MLCC Market Revenue Million Forecast, by Case Size 2019 & 2032
- Table 43: Global Aerospace and Defence MLCC Market Revenue Million Forecast, by Voltage 2019 & 2032
- Table 44: Global Aerospace and Defence MLCC Market Revenue Million Forecast, by Capacitance 2019 & 2032
- Table 45: Global Aerospace and Defence MLCC Market Revenue Million Forecast, by Dielectric Type 2019 & 2032
- Table 46: Global Aerospace and Defence MLCC Market Revenue Million Forecast, by Country 2019 & 2032
- Table 47: Turkey Aerospace and Defence MLCC Market Revenue (Million) Forecast, by Application 2019 & 2032
- Table 48: Israel Aerospace and Defence MLCC Market Revenue (Million) Forecast, by Application 2019 & 2032
- Table 49: GCC Aerospace and Defence MLCC Market Revenue (Million) Forecast, by Application 2019 & 2032
- Table 50: North Africa Aerospace and Defence MLCC Market Revenue (Million) Forecast, by Application 2019 & 2032
- Table 51: South Africa Aerospace and Defence MLCC Market Revenue (Million) Forecast, by Application 2019 & 2032
- Table 52: Rest of Middle East & Africa Aerospace and Defence MLCC Market Revenue (Million) Forecast, by Application 2019 & 2032
- Table 53: Global Aerospace and Defence MLCC Market Revenue Million Forecast, by Vehicle Type 2019 & 2032
- Table 54: Global Aerospace and Defence MLCC Market Revenue Million Forecast, by Case Size 2019 & 2032
- Table 55: Global Aerospace and Defence MLCC Market Revenue Million Forecast, by Voltage 2019 & 2032
- Table 56: Global Aerospace and Defence MLCC Market Revenue Million Forecast, by Capacitance 2019 & 2032
- Table 57: Global Aerospace and Defence MLCC Market Revenue Million Forecast, by Dielectric Type 2019 & 2032
- Table 58: Global Aerospace and Defence MLCC Market Revenue Million Forecast, by Country 2019 & 2032
- Table 59: China Aerospace and Defence MLCC Market Revenue (Million) Forecast, by Application 2019 & 2032
- Table 60: India Aerospace and Defence MLCC Market Revenue (Million) Forecast, by Application 2019 & 2032
- Table 61: Japan Aerospace and Defence MLCC Market Revenue (Million) Forecast, by Application 2019 & 2032
- Table 62: South Korea Aerospace and Defence MLCC Market Revenue (Million) Forecast, by Application 2019 & 2032
- Table 63: ASEAN Aerospace and Defence MLCC Market Revenue (Million) Forecast, by Application 2019 & 2032
- Table 64: Oceania Aerospace and Defence MLCC Market Revenue (Million) Forecast, by Application 2019 & 2032
- Table 65: Rest of Asia Pacific Aerospace and Defence MLCC Market Revenue (Million) Forecast, by Application 2019 & 2032
Frequently Asked Questions
1. What is the projected Compound Annual Growth Rate (CAGR) of the Aerospace and Defence MLCC Market?
The projected CAGR is approximately 5.91%.
2. Which companies are prominent players in the Aerospace and Defence MLCC Market?
Key companies in the market include Vishay Intertechnology Inc, Kyocera AVX Components Corporation (Kyocera Corporation), Maruwa Co ltd, Samwha Capacitor Group, Walsin Technology Corporation, Samsung Electro-Mechanics, Yageo Corporatio, Taiyo Yuden Co Ltd, TDK Corporation, Murata Manufacturing Co Ltd, Nippon Chemi-Con Corporation.
3. What are the main segments of the Aerospace and Defence MLCC Market?
The market segments include Vehicle Type, Case Size, Voltage, Capacitance, Dielectric Type.
4. Can you provide details about the market size?
The market size is estimated to be USD XX Million as of 2022.
5. What are some drivers contributing to market growth?
Rise in the Applications of Semiconductors; Advancement in Technology Such as Magnetron Sputtering Technology.
6. What are the notable trends driving market growth?
The global aerospace and defense MLCC market thrives amid rising defense expenditures and geopolitical dynamics.
7. Are there any restraints impacting market growth?
Rise of Alternative Technologies Such as Thermal Evaporation.
8. Can you provide examples of recent developments in the market?
June 2023: The growing demand for industrial equipments has driven the company to introduce NTS/NTF NTS/NTF Series of SMD type MLCC. These capacitors are rated with 25 to 500 Vdc with a capacitance ranging from 0.010 to 47µF. These MLCCs are used in on-board power supplies,voltage regulators for computers,smoothing circuit of DC-DC converters,etc.February 2023: Kyocera AVX introduced MIL-PRF-32535 BME NP0 MLCCs that are compact, high-CV MLCCs approved for the Defense Logistics Agency (DLA) Qualified Products Database. The new MLCCs are designed to enable board space, weight, and component count reductions for high-reliability military applications (QPD). In addition, the products are patented with the company's Flexiterm technology, which enhances the product's resistance to thermomechanical stresses during its operation in harsh environments.October 2022: Vishay introduced a new line of surface-mount MLCC to serve DC-blocking applications better. In RF, Bluetooth, 5G, military radios, fiber optic lines, and high-frequency data links applications, the MLCCs effectively carry the necessary AC signal over the chosen frequency band with less than 0.5 dB insertion loss, removing the need for more expensive broadband blocks.
9. What pricing options are available for accessing the report?
Pricing options include single-user, multi-user, and enterprise licenses priced at USD 3800, USD 4500, and USD 5800 respectively.
10. Is the market size provided in terms of value or volume?
The market size is provided in terms of value, measured in Million.
11. Are there any specific market keywords associated with the report?
Yes, the market keyword associated with the report is "Aerospace and Defence MLCC Market," which aids in identifying and referencing the specific market segment covered.
12. How do I determine which pricing option suits my needs best?
The pricing options vary based on user requirements and access needs. Individual users may opt for single-user licenses, while businesses requiring broader access may choose multi-user or enterprise licenses for cost-effective access to the report.
13. Are there any additional resources or data provided in the Aerospace and Defence MLCC Market report?
While the report offers comprehensive insights, it's advisable to review the specific contents or supplementary materials provided to ascertain if additional resources or data are available.
14. How can I stay updated on further developments or reports in the Aerospace and Defence MLCC Market?
To stay informed about further developments, trends, and reports in the Aerospace and Defence MLCC Market, consider subscribing to industry newsletters, following relevant companies and organizations, or regularly checking reputable industry news sources and publications.
Methodology
Step 1 - Identification of Relevant Samples Size from Population Database


Step 2 - Approaches for Defining Global Market Size (Value, Volume* & Price*)

Note*: In applicable scenarios
Step 3 - Data Sources
Primary Research
- Web Analytics
- Survey Reports
- Research Institute
- Latest Research Reports
- Opinion Leaders
Secondary Research
- Annual Reports
- White Paper
- Latest Press Release
- Industry Association
- Paid Database
- Investor Presentations

Step 4 - Data Triangulation
Involves using different sources of information in order to increase the validity of a study
These sources are likely to be stakeholders in a program - participants, other researchers, program staff, other community members, and so on.
Then we put all data in single framework & apply various statistical tools to find out the dynamic on the market.
During the analysis stage, feedback from the stakeholder groups would be compared to determine areas of agreement as well as areas of divergence


