
Key Insights
The African energy drink market, valued at approximately $XX million in 2025, is projected to experience robust growth, with a Compound Annual Growth Rate (CAGR) of 11.55% from 2025 to 2033. This expansion is fueled by several key factors. Rising disposable incomes, particularly among young adults in rapidly urbanizing centers like South Africa, Nigeria, and Egypt, are driving increased consumption of these beverages. The growing prevalence of hectic lifestyles and a desire for enhanced energy and focus are further boosting demand. Furthermore, the market is witnessing a significant shift towards healthier alternatives, with a rising preference for sugar-free or low-calorie energy drinks and natural/organic options. This trend presents significant opportunities for manufacturers to cater to health-conscious consumers. The dominance of traditional energy drinks is being challenged by the emergence of innovative product formats, such as energy shots, creating a more diverse and competitive market landscape. The distribution channels are also evolving, with a notable increase in both on-trade (restaurants, bars) and off-trade (retail stores, supermarkets) presence, reflecting the expanding market reach. However, challenges remain, including fluctuating raw material prices and the need to overcome existing cultural preferences for traditional beverages in some regions. Competition among established international players and local brands is intense, requiring strategic marketing and product differentiation to gain market share. The diverse segments within the market — including packaging types (glass bottles, metal cans, PET bottles), distribution channels, and specific drink types — present both challenges and opportunities for targeted growth strategies.
The market's geographical segmentation reveals significant growth potential across various African countries. South Africa, Nigeria, and Egypt are expected to remain key markets due to their large populations and comparatively higher disposable incomes. However, other regions, including Kenya, Tanzania, and Uganda, are also showing promising growth prospects as consumer awareness and purchasing power increase. The competitive landscape features a mix of multinational corporations like Coca-Cola, PepsiCo, and Red Bull, alongside established regional players and emerging local brands. This dynamic competition is driving innovation and product diversification, further propelling market growth. The forecast period (2025-2033) indicates continued expansion, with potential shifts in market share among various segments and players based on their ability to adapt to changing consumer preferences and market trends. Understanding these dynamics is crucial for successful participation in this rapidly evolving market.

Africa Energy Drinks Market: A Comprehensive Report (2019-2033)
This in-depth report provides a comprehensive analysis of the Africa energy drinks market, covering the period 2019-2033. It offers invaluable insights for industry stakeholders, including manufacturers, distributors, investors, and market researchers, seeking to understand the current market landscape and forecast future trends. The report leverages extensive data analysis and expert insights to deliver actionable intelligence for strategic decision-making. The market is segmented by packaging type, distribution channel, soft drink type, and country, offering a granular view of market dynamics. Key players like The Coca-Cola Company, PepsiCo Inc, and Red Bull GmbH are profiled, alongside regional analysis of Egypt, Nigeria, South Africa, and the Rest of Africa. The report's forecast period (2025-2033), with a base year of 2025 and estimated year of 2025, provides a long-term perspective on market evolution.
Africa Energy Drinks Market Concentration & Innovation
The African energy drinks market exhibits a moderately concentrated structure, with a few dominant players holding significant market share. While precise figures for market share are unavailable for all companies at this time (xx), Red Bull, Coca-Cola, and PepsiCo are estimated to collectively control a substantial portion (xx%). However, the market also presents opportunities for smaller, regional players like Mofaya Beverage Company (PTY) Ltd and Aje Group. Innovation is driven by consumer demand for healthier options, such as sugar-free and natural/organic energy drinks. Regulatory frameworks concerning labeling, sugar content, and marketing practices vary across African countries and influence product development. Competition is fierce, prompting innovation in flavors, packaging, and marketing strategies. M&A activity, though not extensively documented, shows occasional consolidation, with recent deals involving smaller companies expanding into new markets (xx Million in total M&A value in the past 5 years, estimated).
- Market Concentration: Moderately concentrated, with a few key players dominating.
- Innovation Drivers: Healthier options (sugar-free, natural), new flavors, innovative packaging.
- Regulatory Frameworks: Vary across countries, impacting product formulation and marketing.
- Product Substitutes: Other beverages like sports drinks and carbonated soft drinks.
- End-User Trends: Growing preference for healthier, convenient, and functional beverages.
- M&A Activities: Occasional consolidation; value estimated at xx Million in past 5 years.
Africa Energy Drinks Market Industry Trends & Insights
The Africa energy drinks market is experiencing robust growth, driven by several factors. Rising disposable incomes, particularly among young adults, are fueling demand. Increasing urbanization and exposure to Western lifestyles contribute to a rising preference for energy drinks. The market’s compound annual growth rate (CAGR) during the historical period (2019-2024) is estimated at xx%, and is projected to reach xx% during the forecast period (2025-2033). Market penetration is still relatively low compared to developed markets, presenting significant potential for growth. Technological disruptions, such as enhanced production processes and improved distribution networks, further contribute to market expansion. Consumer preferences are shifting towards healthier options and more natural ingredients, influencing product development. Intense competition among established and emerging brands is driving innovation and shaping market dynamics.

Dominant Markets & Segments in Africa Energy Drinks Market
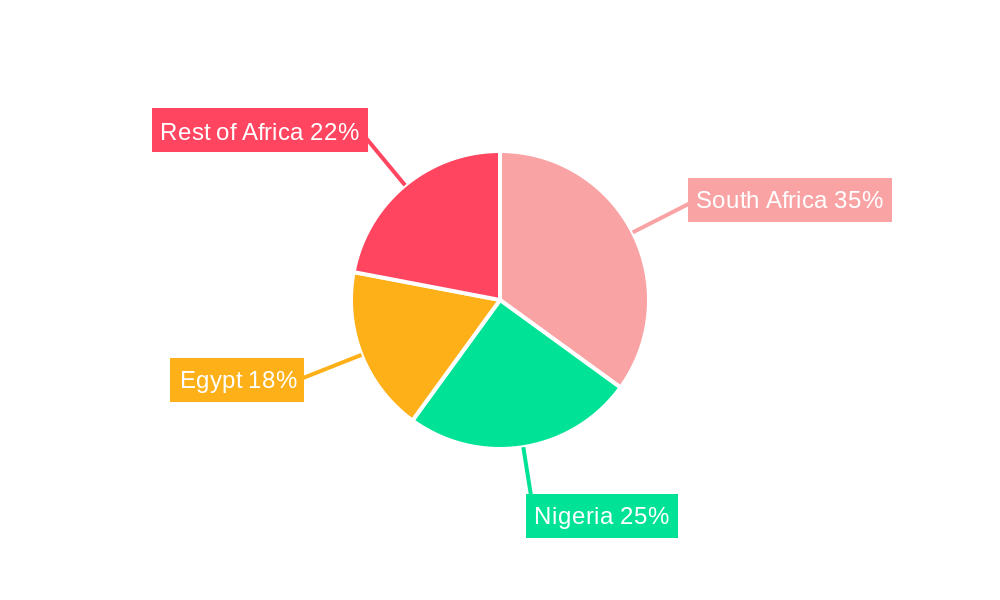
The African energy drinks market is a dynamic landscape, with South Africa, Nigeria, and Egypt currently leading the pack. This dominance stems from several factors: higher per capita incomes in these regions, a substantial young adult population eager to embrace Westernized beverage trends, and established distribution networks that effectively reach consumers. While these three countries currently capture the lion's share, the "Rest of Africa" segment presents considerable, albeit slower, growth potential, representing a significant untapped market ripe for expansion.
- Leading Region/Country: South Africa, fueled by its robust economy and well-developed infrastructure.
- Key Drivers for Market Growth in Leading Countries:
- High Disposable Incomes: Increased purchasing power, particularly among young adults, fuels demand for premium beverages.
- Large Young Adult Population: This demographic is a key consumer base for energy drinks.
- Effective Distribution Networks: Efficient logistics ensure product availability across the market.
- Urbanization: Concentrated populations in urban areas offer easier market penetration and exposure to Western trends.
- Dominant Packaging Type: PET bottles maintain their dominance due to their cost-effectiveness, recyclability, and lightweight convenience.
- Dominant Distribution Channel: Off-trade channels (retail stores, supermarkets) continue to hold the largest market share, owing to their widespread accessibility.
- Dominant Soft Drink Type: Traditional energy drinks currently comprise the largest segment, but the market is witnessing a significant surge in demand for healthier options, notably sugar-free and low-calorie variants.
Further segmentation reveals:
- Country-Specific Dynamics: South Africa's strong economy and established retail infrastructure solidify its leading position, while Nigeria and Egypt exhibit substantial growth driven by population size and increasing disposable incomes. The "Rest of Africa" segment presents opportunities for expansion and market development.
- Packaging Trends: While PET bottles remain prevalent, other formats like aluminum cans and glass bottles cater to specific market segments and consumer preferences.
- Distribution Strategies: Off-trade channels, though dominant, are being complemented by strategic on-trade penetration to tap into specific consumer segments and consumption occasions.
- Product Diversification: The increasing health consciousness among consumers is driving innovation in product offerings, with a rising demand for functional energy drinks, sugar-free alternatives, and organic options.
Africa Energy Drinks Market Product Developments
Recent product innovations focus on healthier formulations, including sugar-free and natural/organic options, catering to evolving consumer preferences. New flavors and limited-edition releases are employed to enhance market appeal. Packaging innovations, such as more sustainable and convenient formats, are also becoming important differentiators. These developments demonstrate an ongoing effort to adapt to evolving health consciousness and growing preference for convenience.
Report Scope & Segmentation Analysis
This report segments the African energy drinks market across multiple dimensions:
- Packaging Type: Glass Bottles, Metal Cans, PET Bottles (Growth projections vary by packaging type; xx% for PET, xx% for cans, and xx% for glass)
- Distribution Channel: Off-trade (supermarkets, convenience stores, etc.), On-trade (restaurants, bars, etc.) (Growth projections vary, off-trade expected to grow faster)
- Soft Drink Type: Energy Shots, Natural/Organic Energy Drinks, Sugar-free or Low-calories Energy Drinks, Traditional Energy Drinks, Other Energy Drinks (Market size and growth vary significantly between types; xx% for traditional, xx% for sugar free)
- Country: Egypt, Nigeria, South Africa, Rest of Africa (Significant market size variation by country; South Africa leading the way, followed by Nigeria and Egypt).
Each segment’s growth projection and competitive dynamics are assessed within the report.
Key Drivers of Africa Energy Drinks Market Growth
Several key factors drive growth in the African energy drinks market. These include:
- Rising Disposable Incomes: Increasing purchasing power, especially among the young adult population, fuels demand for premium beverages.
- Urbanization: Urban areas offer more exposure to Western lifestyles and energy drink consumption trends.
- Changing Lifestyles: Busy lifestyles and the need for increased energy and focus contribute to market growth.
- Growing Health Consciousness: Demand for healthier options (sugar-free, natural) is driving innovation in product development.
Challenges in the Africa Energy Drinks Market Sector
Despite significant growth potential, the African energy drinks market faces challenges. These include:
- Varying Regulatory Frameworks: Inconsistent regulations across different countries increase complexity and compliance costs.
- Supply Chain Disruptions: Infrastructure limitations in certain regions affect product distribution and availability.
- Price Sensitivity: Price remains a critical factor impacting consumer purchasing decisions, particularly in lower-income segments.
- Competition: Intense competition from established global brands and local players requires constant innovation and competitive pricing strategies.
Emerging Opportunities in Africa Energy Drinks Market
Several emerging opportunities exist within the African energy drinks market:
- Expansion into Rural Areas: Untapped potential exists in expanding distribution networks to reach consumers in underserved areas.
- Functional Energy Drinks: Focus on functional benefits beyond energy boosting, such as enhanced cognitive function or improved hydration.
- Sustainable Packaging: Increased demand for eco-friendly packaging materials (biodegradable, recyclable)
- Partnerships with Local Businesses: Collaborating with local businesses enhances brand reach and resonates with local consumers.
Leading Players in the Africa Energy Drinks Market Market
- Mutalo Group sp z o o
- Aje Group
- Tiger Brands Ltd
- The Alternative Power (Pty) Ltd
- Monster Beverage Corporation
- PepsiCo Inc
- Mofaya Beverage Company (PTY) Ltd
- S Spitz GmbH
- Suntory Holdings Limited
- Red Bull GmbH
- Halewood International South Africa (Pty) Ltd
- The Coca-Cola Company
Key Developments in Africa Energy Drinks Market Industry
- October 2023: Miss South Africa Natasha Joubert launched a Berry Queen-flavored energy drink under the MoFaya brand, expanding the brand's reach and appeal.
- October 2023: Switch Energy Drink introduced three new limited-edition flavors (Sour Worms, Naartjie & Grape, Kiwi, Mango & Strawberry), enhancing product variety and attracting new consumers.
- September 2023: Switch Energy Drink launched a special limited-edition flavor for South African Heritage Day, leveraging cultural events to increase brand visibility and consumer engagement. These developments highlight the increasing focus on product innovation, flavor diversification, and cultural relevance in driving market growth.
Strategic Outlook for Africa Energy Drinks Market Market
The African energy drinks market presents a significant long-term growth opportunity. Continued expansion into underserved regions, innovative product development, and effective marketing strategies will be crucial for success. Focusing on health-conscious and sustainably conscious consumers will drive future growth. Companies that effectively adapt to the changing consumer preferences and address regulatory challenges are poised to capitalize on the market's potential. The market’s robust growth trajectory, fueled by rising disposable incomes and evolving consumer preferences, indicates strong future potential.
Africa Energy Drinks Market Segmentation
-
1. Soft Drink Type
- 1.1. Energy Shots
- 1.2. Natural/Organic Energy Drinks
- 1.3. Sugar-free or Low-calories Energy Drinks
- 1.4. Traditional Energy Drinks
- 1.5. Other Energy Drinks
-
2. Packaging Type
- 2.1. Glass Bottles
- 2.2. Metal Can
- 2.3. PET Bottles
-
3. Distribution Channel
-
3.1. Off-trade
- 3.1.1. Convenience Stores
- 3.1.2. Online Retail
- 3.1.3. Supermarket/Hypermarket
- 3.1.4. Others
- 3.2. On-trade
-
3.1. Off-trade
Africa Energy Drinks Market Segmentation By Geography
-
1. Africa
- 1.1. Nigeria
- 1.2. South Africa
- 1.3. Egypt
- 1.4. Kenya
- 1.5. Ethiopia
- 1.6. Morocco
- 1.7. Ghana
- 1.8. Algeria
- 1.9. Tanzania
- 1.10. Ivory Coast
Africa Energy Drinks Market REPORT HIGHLIGHTS
| Aspects | Details |
|---|---|
| Study Period | 2019-2033 |
| Base Year | 2024 |
| Estimated Year | 2025 |
| Forecast Period | 2025-2033 |
| Historical Period | 2019-2024 |
| Growth Rate | CAGR of 11.55% from 2019-2033 |
| Segmentation |
|
Table of Contents
- 1. Introduction
- 1.1. Research Scope
- 1.2. Market Segmentation
- 1.3. Research Methodology
- 1.4. Definitions and Assumptions
- 2. Executive Summary
- 2.1. Introduction
- 3. Market Dynamics
- 3.1. Introduction
- 3.2. Market Drivers
- 3.2.1. Increasing Demand for Protein-Rich Food; Increasing Demand for Plant-Based and Organic Ingredients
- 3.3. Market Restrains
- 3.3.1. Presence of Counterfeit Products
- 3.4. Market Trends
- 3.4.1. OTHER KEY INDUSTRY TRENDS COVERED IN THE REPORT
- 4. Market Factor Analysis
- 4.1. Porters Five Forces
- 4.2. Supply/Value Chain
- 4.3. PESTEL analysis
- 4.4. Market Entropy
- 4.5. Patent/Trademark Analysis
- 5. Africa Energy Drinks Market Analysis, Insights and Forecast, 2019-2031
- 5.1. Market Analysis, Insights and Forecast - by Soft Drink Type
- 5.1.1. Energy Shots
- 5.1.2. Natural/Organic Energy Drinks
- 5.1.3. Sugar-free or Low-calories Energy Drinks
- 5.1.4. Traditional Energy Drinks
- 5.1.5. Other Energy Drinks
- 5.2. Market Analysis, Insights and Forecast - by Packaging Type
- 5.2.1. Glass Bottles
- 5.2.2. Metal Can
- 5.2.3. PET Bottles
- 5.3. Market Analysis, Insights and Forecast - by Distribution Channel
- 5.3.1. Off-trade
- 5.3.1.1. Convenience Stores
- 5.3.1.2. Online Retail
- 5.3.1.3. Supermarket/Hypermarket
- 5.3.1.4. Others
- 5.3.2. On-trade
- 5.3.1. Off-trade
- 5.4. Market Analysis, Insights and Forecast - by Region
- 5.4.1. Africa
- 5.1. Market Analysis, Insights and Forecast - by Soft Drink Type
- 6. South Africa Africa Energy Drinks Market Analysis, Insights and Forecast, 2019-2031
- 7. Sudan Africa Energy Drinks Market Analysis, Insights and Forecast, 2019-2031
- 8. Uganda Africa Energy Drinks Market Analysis, Insights and Forecast, 2019-2031
- 9. Tanzania Africa Energy Drinks Market Analysis, Insights and Forecast, 2019-2031
- 10. Kenya Africa Energy Drinks Market Analysis, Insights and Forecast, 2019-2031
- 11. Rest of Africa Africa Energy Drinks Market Analysis, Insights and Forecast, 2019-2031
- 12. Competitive Analysis
- 12.1. Market Share Analysis 2024
- 12.2. Company Profiles
- 12.2.1 Mutalo Group sp z o o
- 12.2.1.1. Overview
- 12.2.1.2. Products
- 12.2.1.3. SWOT Analysis
- 12.2.1.4. Recent Developments
- 12.2.1.5. Financials (Based on Availability)
- 12.2.2 Aje Group
- 12.2.2.1. Overview
- 12.2.2.2. Products
- 12.2.2.3. SWOT Analysis
- 12.2.2.4. Recent Developments
- 12.2.2.5. Financials (Based on Availability)
- 12.2.3 Tiger Brands Ltd
- 12.2.3.1. Overview
- 12.2.3.2. Products
- 12.2.3.3. SWOT Analysis
- 12.2.3.4. Recent Developments
- 12.2.3.5. Financials (Based on Availability)
- 12.2.4 The Alternative Power (Pty) Ltd
- 12.2.4.1. Overview
- 12.2.4.2. Products
- 12.2.4.3. SWOT Analysis
- 12.2.4.4. Recent Developments
- 12.2.4.5. Financials (Based on Availability)
- 12.2.5 Monster Beverage Corporation
- 12.2.5.1. Overview
- 12.2.5.2. Products
- 12.2.5.3. SWOT Analysis
- 12.2.5.4. Recent Developments
- 12.2.5.5. Financials (Based on Availability)
- 12.2.6 PepsiCo Inc
- 12.2.6.1. Overview
- 12.2.6.2. Products
- 12.2.6.3. SWOT Analysis
- 12.2.6.4. Recent Developments
- 12.2.6.5. Financials (Based on Availability)
- 12.2.7 Mofaya Beverage Company (PTY) Ltd
- 12.2.7.1. Overview
- 12.2.7.2. Products
- 12.2.7.3. SWOT Analysis
- 12.2.7.4. Recent Developments
- 12.2.7.5. Financials (Based on Availability)
- 12.2.8 S Spitz GmbH
- 12.2.8.1. Overview
- 12.2.8.2. Products
- 12.2.8.3. SWOT Analysis
- 12.2.8.4. Recent Developments
- 12.2.8.5. Financials (Based on Availability)
- 12.2.9 Suntory Holdings Limited
- 12.2.9.1. Overview
- 12.2.9.2. Products
- 12.2.9.3. SWOT Analysis
- 12.2.9.4. Recent Developments
- 12.2.9.5. Financials (Based on Availability)
- 12.2.10 Red Bull GmbH
- 12.2.10.1. Overview
- 12.2.10.2. Products
- 12.2.10.3. SWOT Analysis
- 12.2.10.4. Recent Developments
- 12.2.10.5. Financials (Based on Availability)
- 12.2.11 Halewood International South Africa (Pty) Ltd
- 12.2.11.1. Overview
- 12.2.11.2. Products
- 12.2.11.3. SWOT Analysis
- 12.2.11.4. Recent Developments
- 12.2.11.5. Financials (Based on Availability)
- 12.2.12 The Coca-Cola Company
- 12.2.12.1. Overview
- 12.2.12.2. Products
- 12.2.12.3. SWOT Analysis
- 12.2.12.4. Recent Developments
- 12.2.12.5. Financials (Based on Availability)
- 12.2.1 Mutalo Group sp z o o
List of Figures
- Figure 1: Africa Energy Drinks Market Revenue Breakdown (Million, %) by Product 2024 & 2032
- Figure 2: Africa Energy Drinks Market Share (%) by Company 2024
List of Tables
- Table 1: Africa Energy Drinks Market Revenue Million Forecast, by Region 2019 & 2032
- Table 2: Africa Energy Drinks Market Volume K Tons Forecast, by Region 2019 & 2032
- Table 3: Africa Energy Drinks Market Revenue Million Forecast, by Soft Drink Type 2019 & 2032
- Table 4: Africa Energy Drinks Market Volume K Tons Forecast, by Soft Drink Type 2019 & 2032
- Table 5: Africa Energy Drinks Market Revenue Million Forecast, by Packaging Type 2019 & 2032
- Table 6: Africa Energy Drinks Market Volume K Tons Forecast, by Packaging Type 2019 & 2032
- Table 7: Africa Energy Drinks Market Revenue Million Forecast, by Distribution Channel 2019 & 2032
- Table 8: Africa Energy Drinks Market Volume K Tons Forecast, by Distribution Channel 2019 & 2032
- Table 9: Africa Energy Drinks Market Revenue Million Forecast, by Region 2019 & 2032
- Table 10: Africa Energy Drinks Market Volume K Tons Forecast, by Region 2019 & 2032
- Table 11: Africa Energy Drinks Market Revenue Million Forecast, by Country 2019 & 2032
- Table 12: Africa Energy Drinks Market Volume K Tons Forecast, by Country 2019 & 2032
- Table 13: South Africa Africa Energy Drinks Market Revenue (Million) Forecast, by Application 2019 & 2032
- Table 14: South Africa Africa Energy Drinks Market Volume (K Tons) Forecast, by Application 2019 & 2032
- Table 15: Sudan Africa Energy Drinks Market Revenue (Million) Forecast, by Application 2019 & 2032
- Table 16: Sudan Africa Energy Drinks Market Volume (K Tons) Forecast, by Application 2019 & 2032
- Table 17: Uganda Africa Energy Drinks Market Revenue (Million) Forecast, by Application 2019 & 2032
- Table 18: Uganda Africa Energy Drinks Market Volume (K Tons) Forecast, by Application 2019 & 2032
- Table 19: Tanzania Africa Energy Drinks Market Revenue (Million) Forecast, by Application 2019 & 2032
- Table 20: Tanzania Africa Energy Drinks Market Volume (K Tons) Forecast, by Application 2019 & 2032
- Table 21: Kenya Africa Energy Drinks Market Revenue (Million) Forecast, by Application 2019 & 2032
- Table 22: Kenya Africa Energy Drinks Market Volume (K Tons) Forecast, by Application 2019 & 2032
- Table 23: Rest of Africa Africa Energy Drinks Market Revenue (Million) Forecast, by Application 2019 & 2032
- Table 24: Rest of Africa Africa Energy Drinks Market Volume (K Tons) Forecast, by Application 2019 & 2032
- Table 25: Africa Energy Drinks Market Revenue Million Forecast, by Soft Drink Type 2019 & 2032
- Table 26: Africa Energy Drinks Market Volume K Tons Forecast, by Soft Drink Type 2019 & 2032
- Table 27: Africa Energy Drinks Market Revenue Million Forecast, by Packaging Type 2019 & 2032
- Table 28: Africa Energy Drinks Market Volume K Tons Forecast, by Packaging Type 2019 & 2032
- Table 29: Africa Energy Drinks Market Revenue Million Forecast, by Distribution Channel 2019 & 2032
- Table 30: Africa Energy Drinks Market Volume K Tons Forecast, by Distribution Channel 2019 & 2032
- Table 31: Africa Energy Drinks Market Revenue Million Forecast, by Country 2019 & 2032
- Table 32: Africa Energy Drinks Market Volume K Tons Forecast, by Country 2019 & 2032
- Table 33: Nigeria Africa Energy Drinks Market Revenue (Million) Forecast, by Application 2019 & 2032
- Table 34: Nigeria Africa Energy Drinks Market Volume (K Tons) Forecast, by Application 2019 & 2032
- Table 35: South Africa Africa Energy Drinks Market Revenue (Million) Forecast, by Application 2019 & 2032
- Table 36: South Africa Africa Energy Drinks Market Volume (K Tons) Forecast, by Application 2019 & 2032
- Table 37: Egypt Africa Energy Drinks Market Revenue (Million) Forecast, by Application 2019 & 2032
- Table 38: Egypt Africa Energy Drinks Market Volume (K Tons) Forecast, by Application 2019 & 2032
- Table 39: Kenya Africa Energy Drinks Market Revenue (Million) Forecast, by Application 2019 & 2032
- Table 40: Kenya Africa Energy Drinks Market Volume (K Tons) Forecast, by Application 2019 & 2032
- Table 41: Ethiopia Africa Energy Drinks Market Revenue (Million) Forecast, by Application 2019 & 2032
- Table 42: Ethiopia Africa Energy Drinks Market Volume (K Tons) Forecast, by Application 2019 & 2032
- Table 43: Morocco Africa Energy Drinks Market Revenue (Million) Forecast, by Application 2019 & 2032
- Table 44: Morocco Africa Energy Drinks Market Volume (K Tons) Forecast, by Application 2019 & 2032
- Table 45: Ghana Africa Energy Drinks Market Revenue (Million) Forecast, by Application 2019 & 2032
- Table 46: Ghana Africa Energy Drinks Market Volume (K Tons) Forecast, by Application 2019 & 2032
- Table 47: Algeria Africa Energy Drinks Market Revenue (Million) Forecast, by Application 2019 & 2032
- Table 48: Algeria Africa Energy Drinks Market Volume (K Tons) Forecast, by Application 2019 & 2032
- Table 49: Tanzania Africa Energy Drinks Market Revenue (Million) Forecast, by Application 2019 & 2032
- Table 50: Tanzania Africa Energy Drinks Market Volume (K Tons) Forecast, by Application 2019 & 2032
- Table 51: Ivory Coast Africa Energy Drinks Market Revenue (Million) Forecast, by Application 2019 & 2032
- Table 52: Ivory Coast Africa Energy Drinks Market Volume (K Tons) Forecast, by Application 2019 & 2032
Frequently Asked Questions
1. What is the projected Compound Annual Growth Rate (CAGR) of the Africa Energy Drinks Market?
The projected CAGR is approximately 11.55%.
2. Which companies are prominent players in the Africa Energy Drinks Market?
Key companies in the market include Mutalo Group sp z o o, Aje Group, Tiger Brands Ltd, The Alternative Power (Pty) Ltd, Monster Beverage Corporation, PepsiCo Inc, Mofaya Beverage Company (PTY) Ltd, S Spitz GmbH, Suntory Holdings Limited, Red Bull GmbH, Halewood International South Africa (Pty) Ltd, The Coca-Cola Company.
3. What are the main segments of the Africa Energy Drinks Market?
The market segments include Soft Drink Type, Packaging Type, Distribution Channel.
4. Can you provide details about the market size?
The market size is estimated to be USD XX Million as of 2022.
5. What are some drivers contributing to market growth?
Increasing Demand for Protein-Rich Food; Increasing Demand for Plant-Based and Organic Ingredients.
6. What are the notable trends driving market growth?
OTHER KEY INDUSTRY TRENDS COVERED IN THE REPORT.
7. Are there any restraints impacting market growth?
Presence of Counterfeit Products.
8. Can you provide examples of recent developments in the market?
October 2023: Miss South Africa Natasha Joubert has expanded her business venture by collaborating with the MoFaya energy drink business. Joubert has launched the Berry Queen-flavoured energy drink under the MoFaya energy drink brand.October 2023: Switch Energy Drink introduced 3 new flavors in the African region. The three new limited-edition flavors are Sour Worms, Naartjie & Grape, and Kiwi, Mango & Strawberry.September 2023: Switch Energy Drink launched a special limited-edition flavor in celebration of South African Heritage Day. As a brand deeply rooted in the South African spirit, Switch Energy Drink is excited to contribute to the festivities with this special edition.
9. What pricing options are available for accessing the report?
Pricing options include single-user, multi-user, and enterprise licenses priced at USD 3800, USD 4500, and USD 5800 respectively.
10. Is the market size provided in terms of value or volume?
The market size is provided in terms of value, measured in Million and volume, measured in K Tons.
11. Are there any specific market keywords associated with the report?
Yes, the market keyword associated with the report is "Africa Energy Drinks Market," which aids in identifying and referencing the specific market segment covered.
12. How do I determine which pricing option suits my needs best?
The pricing options vary based on user requirements and access needs. Individual users may opt for single-user licenses, while businesses requiring broader access may choose multi-user or enterprise licenses for cost-effective access to the report.
13. Are there any additional resources or data provided in the Africa Energy Drinks Market report?
While the report offers comprehensive insights, it's advisable to review the specific contents or supplementary materials provided to ascertain if additional resources or data are available.
14. How can I stay updated on further developments or reports in the Africa Energy Drinks Market?
To stay informed about further developments, trends, and reports in the Africa Energy Drinks Market, consider subscribing to industry newsletters, following relevant companies and organizations, or regularly checking reputable industry news sources and publications.
Methodology
Step 1 - Identification of Relevant Samples Size from Population Database


Step 2 - Approaches for Defining Global Market Size (Value, Volume* & Price*)

Note*: In applicable scenarios
Step 3 - Data Sources
Primary Research
- Web Analytics
- Survey Reports
- Research Institute
- Latest Research Reports
- Opinion Leaders
Secondary Research
- Annual Reports
- White Paper
- Latest Press Release
- Industry Association
- Paid Database
- Investor Presentations

Step 4 - Data Triangulation
Involves using different sources of information in order to increase the validity of a study
These sources are likely to be stakeholders in a program - participants, other researchers, program staff, other community members, and so on.
Then we put all data in single framework & apply various statistical tools to find out the dynamic on the market.
During the analysis stage, feedback from the stakeholder groups would be compared to determine areas of agreement as well as areas of divergence


