
Key Insights
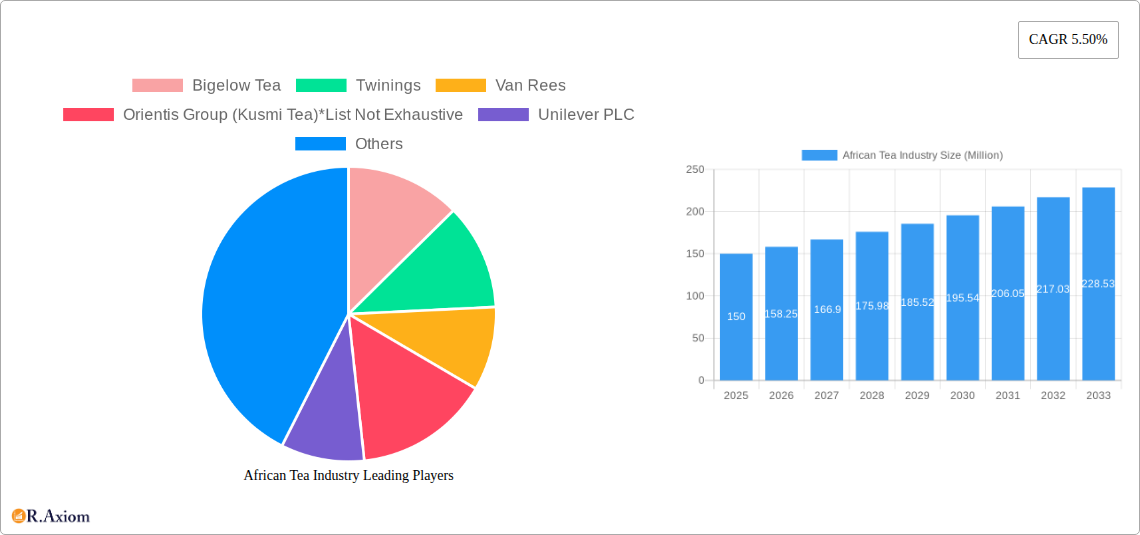
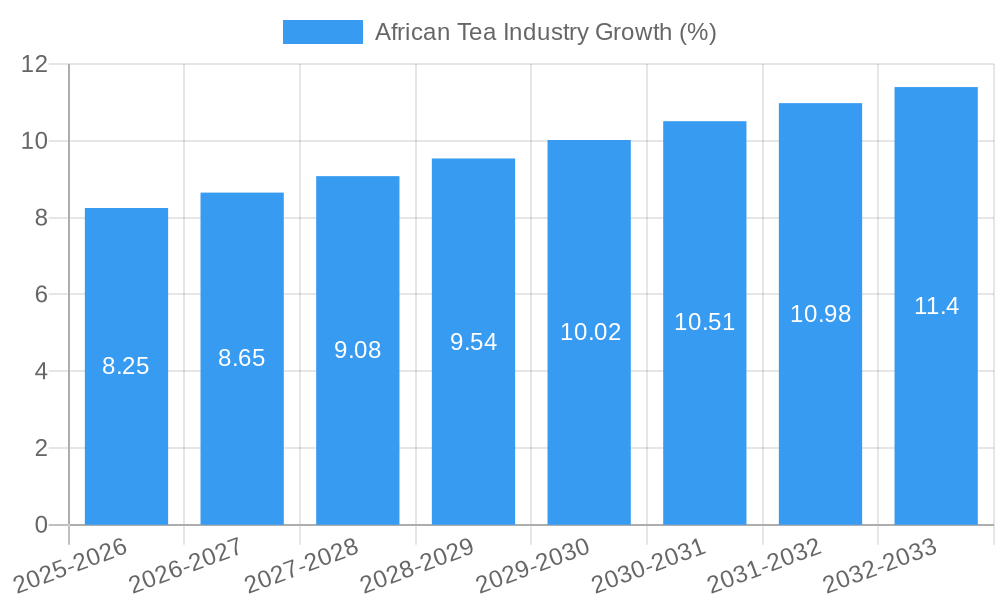
The African tea market, valued at approximately $XX million in 2025, is projected to experience robust growth, exhibiting a Compound Annual Growth Rate (CAGR) of 5.50% from 2025 to 2033. This expansion is fueled by several key factors. Rising disposable incomes across several African nations are driving increased consumer spending on beverages, including tea. A growing young population represents a significant consumer base with a preference for convenient and readily available tea formats like ready-to-drink options and CTC tea, which are gaining popularity in urban centers. Furthermore, the increasing awareness of tea's health benefits, such as its antioxidant properties, is contributing positively to market demand. The diverse tea types available, including black, green, white, and oolong teas, cater to varied consumer preferences, fostering market diversification. Distribution channels are also evolving, with online retailers and specialty stores supplementing traditional supermarkets and hypermarkets, enhancing accessibility and reaching a wider customer base.
However, the market faces certain challenges. Fluctuations in tea prices due to global supply chain issues and climatic conditions can impact affordability and profitability. Competition from other beverages, such as soft drinks and coffee, poses a persistent threat. Furthermore, inconsistent infrastructure in some regions hinders efficient distribution and may limit market penetration in certain areas. Nevertheless, strategic investments in tea cultivation, processing, and distribution infrastructure alongside targeted marketing campaigns emphasizing the health and cultural significance of tea consumption hold considerable potential to unlock significant further growth within the African tea market across the forecast period. The focus on premium and specialized tea varieties presents opportunities for niche players in this expanding market.
This comprehensive report provides a detailed analysis of the African tea industry, covering market size, segmentation, growth drivers, challenges, and future opportunities from 2019 to 2033. The report leverages extensive primary and secondary research to offer actionable insights for industry stakeholders, including manufacturers, distributors, investors, and policymakers. The study period spans 2019-2033, with 2025 serving as both the base and estimated year. The forecast period extends from 2025 to 2033.
African Tea Industry Market Concentration & Innovation
The African tea market exhibits a moderately concentrated landscape, with a few multinational players dominating alongside several regional producers. Key players include Unilever PLC, Bigelow Tea, Twinings, and Tata Global Beverages, though market share data fluctuates. The xx Million market value is largely driven by strong demand for black tea, particularly in specific regions. However, increasing consumer awareness of health and wellness is fueling growth in the green and other specialty tea segments.
- Market Concentration: The top 5 players hold an estimated xx% market share in 2025, with Unilever and Tata Global Beverages representing the largest portions.
- Innovation: Innovation in the African tea market is driven by product diversification (e.g., flavored teas, ready-to-drink options), sustainable sourcing initiatives, and improved packaging. M&A activity, though not extremely frequent, is aimed at expanding market reach and product portfolios. Recent M&A deal values are estimated to be in the range of xx Million.
- Regulatory Framework: Varying regulatory frameworks across African nations influence the industry; harmonization efforts are ongoing to streamline trade and regulations.
- Product Substitutes: Coffee and other beverages pose competitive threats, yet tea's cultural significance in some areas remains a protective factor.
- End-User Trends: Growing urbanization and changing lifestyles are impacting consumption patterns, favoring convenience formats.
African Tea Industry Industry Trends & Insights
The African tea market is poised for robust growth, with a projected Compound Annual Growth Rate (CAGR) of xx% from 2025 to 2033. This growth is fuelled by a rising population, increasing disposable incomes, particularly in urban areas, and changing consumer preferences towards healthier beverages. Technological advancements, such as improved tea processing techniques and efficient distribution channels, further contribute to this upward trajectory. Market penetration is still relatively low in some regions, offering significant growth opportunities for market expansion. Competitive dynamics are characterized by both fierce rivalry amongst established players and the emergence of smaller, specialized tea brands focusing on niche products or sustainable practices. The growing popularity of specialty teas, such as green and herbal infusions, represents a significant trend. Increased online sales channels are changing distribution patterns, creating new avenues for growth and market access. The impact of climate change on tea production is also a significant factor to consider for long-term sustainability.
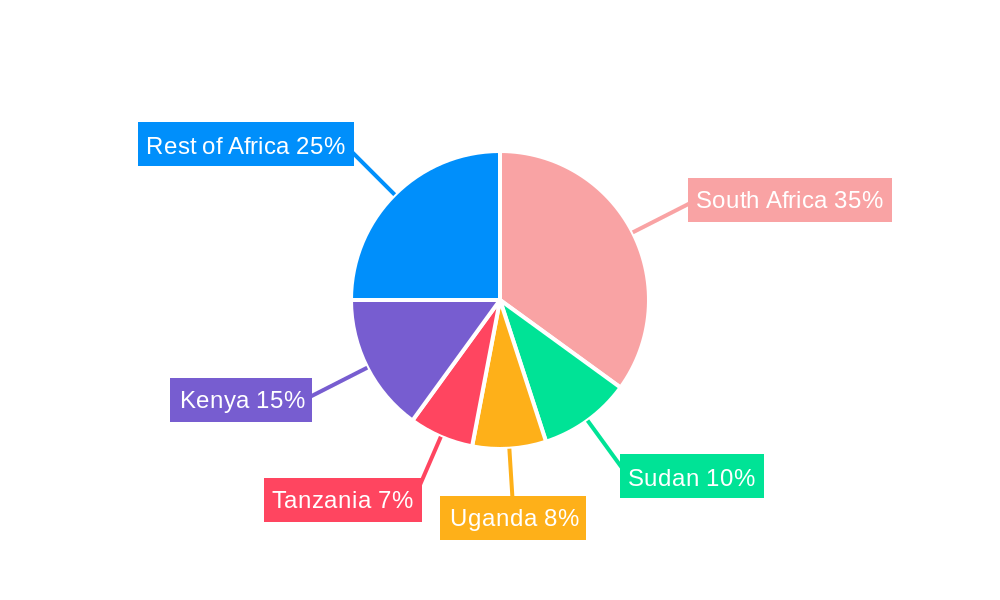
Dominant Markets & Segments in African Tea Industry
- Leading Region/Country: xx is currently the largest tea market in Africa, driven by factors such as high tea consumption, favorable climatic conditions, and robust economic growth. Other countries showing substantial potential include xx and xx.
- Form: CTC tea dominates the market, reflecting preference for economical, widely accessible options. Leaf tea shows slower but steady growth, particularly within premium segments.
- Product Type: Black tea remains the most popular type, with significant potential for growth in green tea and other specialty teas, especially within the younger, health-conscious population.
- Distribution Channel: Supermarkets/hypermarkets hold the largest share, but specialist retailers and online platforms are growing rapidly, driven by enhanced consumer access to a wide range of products and premium options.
Key Drivers: Strong economic growth, favorable government policies supporting agriculture, well-developed infrastructure in certain regions, and increasing access to retail channels are significant factors.
African Tea Industry Product Developments
Recent innovations center around convenient formats (e.g., ready-to-drink tea, tea bags with enhanced functionality) and health-focused products (e.g., functional teas enriched with vitamins or antioxidants). Technological advancements are improving tea processing efficiency and quality, thereby influencing the overall competitive advantage. The market is also witnessing a growing demand for organic and ethically sourced tea, reflecting changing consumer priorities.
Report Scope & Segmentation Analysis
This report segments the African tea market across various parameters:
- Form: Leaf Tea (xx Million in 2025, xx% CAGR), CTC Tea (xx Million in 2025, xx% CAGR). Leaf tea growth is projected to be more moderate than CTC.
- Product Type: Black Tea (xx Million in 2025, xx% CAGR), Green Tea (xx Million in 2025, xx% CAGR), Other Types (xx Million in 2025, xx% CAGR). Green tea and other specialty tea types show higher growth rates.
- Distribution Channel: Supermarkets/Hypermarkets (xx Million in 2025, xx% CAGR), Specialist Retailers (xx Million in 2025, xx% CAGR), Convenience Stores (xx Million in 2025, xx% CAGR), Online Retailers (xx Million in 2025, xx% CAGR), Other Channels (xx Million in 2025, xx% CAGR). Online retailers are expected to show significant growth.
Each segment's growth trajectory varies, influenced by evolving consumer tastes, economic factors, and competitive dynamics.
Key Drivers of African Tea Industry Growth
The African tea industry is fueled by several key factors: rising disposable incomes and urbanization leading to increased spending on beverages; a young and growing population with a preference for tea; governmental support for agricultural development; and improvements in distribution infrastructure. Additionally, increasing awareness of tea's health benefits is creating positive market sentiment.
Challenges in the African Tea Industry Sector
The industry faces challenges, including climate change impacting tea yields, fluctuating tea prices, and a lack of consistent quality control across producers. Supply chain inefficiencies and inadequate infrastructure in some regions also pose significant obstacles, potentially impacting production and distribution. Competition from other beverages also restricts market share growth.
Emerging Opportunities in African Tea Industry
Growing demand for premium and specialty teas, expansion into ready-to-drink formats, and the potential of e-commerce platforms present significant opportunities. Further development of sustainable and ethically sourced tea production methods can attract environmentally conscious consumers and boost brand image.
Leading Players in the African Tea Industry Market
- Bigelow Tea
- Twinings
- Van Rees
- Orientis Group (Kusmi Tea)
- Unilever PLC
- DavidsTea
- Tata Global Beverages
- Chebango Tea Company
- Dilmah
- Hain Celestial
Key Developments in African Tea Industry Industry
- 2022 Q4: Unilever PLC announces a new sustainable sourcing initiative for its tea operations in Africa.
- 2023 Q1: Tata Global Beverages launches a new range of ready-to-drink teas targeting the youth market.
- 2023 Q3: A significant merger takes place between two mid-sized African tea companies, increasing market consolidation.
Strategic Outlook for African Tea Industry Market
The African tea industry is set for continued expansion, driven by positive demographic trends, shifting consumer preferences, and innovation within the sector. Opportunities exist in expanding access to premium and specialty tea varieties, harnessing e-commerce growth, and emphasizing sustainable sourcing to attract health-conscious consumers. Addressing challenges related to climate change and supply chain efficiency will be vital to realizing the industry's full potential.
African Tea Industry Segmentation
-
1. Form
- 1.1. Leaf Tea
- 1.2. CTC Tea (Crushed, Teared, and Curled Tea)
-
2. Product Type
- 2.1. Black Tea
- 2.2. Green Tea
- 2.3. Other Types (White and Oolong)
-
3. Distribution Channel
- 3.1. Supermarkets/Hypermarkets
- 3.2. Specialist Retailers
- 3.3. Convenience Stores
- 3.4. Online Retailers
- 3.5. Other Channels
-
4. Geography
- 4.1. South Africa
- 4.2. Egypt
- 4.3. Rest of Africa
African Tea Industry Segmentation By Geography
- 1. South Africa
- 2. Egypt
- 3. Rest of Africa
African Tea Industry REPORT HIGHLIGHTS
| Aspects | Details |
|---|---|
| Study Period | 2019-2033 |
| Base Year | 2024 |
| Estimated Year | 2025 |
| Forecast Period | 2025-2033 |
| Historical Period | 2019-2024 |
| Growth Rate | CAGR of 5.50% from 2019-2033 |
| Segmentation |
|
Table of Contents
- 1. Introduction
- 1.1. Research Scope
- 1.2. Market Segmentation
- 1.3. Research Methodology
- 1.4. Definitions and Assumptions
- 2. Executive Summary
- 2.1. Introduction
- 3. Market Dynamics
- 3.1. Introduction
- 3.2. Market Drivers
- 3.2.1. Increasing Demand for Herbal Teas; Increasing Consumer Awareness about Health Benefits of Tea
- 3.3. Market Restrains
- 3.3.1. High Cost of Production of Green Tea
- 3.4. Market Trends
- 3.4.1. Increasing Tea Production in African Countries
- 4. Market Factor Analysis
- 4.1. Porters Five Forces
- 4.2. Supply/Value Chain
- 4.3. PESTEL analysis
- 4.4. Market Entropy
- 4.5. Patent/Trademark Analysis
- 5. African Tea Industry Analysis, Insights and Forecast, 2019-2031
- 5.1. Market Analysis, Insights and Forecast - by Form
- 5.1.1. Leaf Tea
- 5.1.2. CTC Tea (Crushed, Teared, and Curled Tea)
- 5.2. Market Analysis, Insights and Forecast - by Product Type
- 5.2.1. Black Tea
- 5.2.2. Green Tea
- 5.2.3. Other Types (White and Oolong)
- 5.3. Market Analysis, Insights and Forecast - by Distribution Channel
- 5.3.1. Supermarkets/Hypermarkets
- 5.3.2. Specialist Retailers
- 5.3.3. Convenience Stores
- 5.3.4. Online Retailers
- 5.3.5. Other Channels
- 5.4. Market Analysis, Insights and Forecast - by Geography
- 5.4.1. South Africa
- 5.4.2. Egypt
- 5.4.3. Rest of Africa
- 5.5. Market Analysis, Insights and Forecast - by Region
- 5.5.1. South Africa
- 5.5.2. Egypt
- 5.5.3. Rest of Africa
- 5.1. Market Analysis, Insights and Forecast - by Form
- 6. South Africa African Tea Industry Analysis, Insights and Forecast, 2019-2031
- 6.1. Market Analysis, Insights and Forecast - by Form
- 6.1.1. Leaf Tea
- 6.1.2. CTC Tea (Crushed, Teared, and Curled Tea)
- 6.2. Market Analysis, Insights and Forecast - by Product Type
- 6.2.1. Black Tea
- 6.2.2. Green Tea
- 6.2.3. Other Types (White and Oolong)
- 6.3. Market Analysis, Insights and Forecast - by Distribution Channel
- 6.3.1. Supermarkets/Hypermarkets
- 6.3.2. Specialist Retailers
- 6.3.3. Convenience Stores
- 6.3.4. Online Retailers
- 6.3.5. Other Channels
- 6.4. Market Analysis, Insights and Forecast - by Geography
- 6.4.1. South Africa
- 6.4.2. Egypt
- 6.4.3. Rest of Africa
- 6.1. Market Analysis, Insights and Forecast - by Form
- 7. Egypt African Tea Industry Analysis, Insights and Forecast, 2019-2031
- 7.1. Market Analysis, Insights and Forecast - by Form
- 7.1.1. Leaf Tea
- 7.1.2. CTC Tea (Crushed, Teared, and Curled Tea)
- 7.2. Market Analysis, Insights and Forecast - by Product Type
- 7.2.1. Black Tea
- 7.2.2. Green Tea
- 7.2.3. Other Types (White and Oolong)
- 7.3. Market Analysis, Insights and Forecast - by Distribution Channel
- 7.3.1. Supermarkets/Hypermarkets
- 7.3.2. Specialist Retailers
- 7.3.3. Convenience Stores
- 7.3.4. Online Retailers
- 7.3.5. Other Channels
- 7.4. Market Analysis, Insights and Forecast - by Geography
- 7.4.1. South Africa
- 7.4.2. Egypt
- 7.4.3. Rest of Africa
- 7.1. Market Analysis, Insights and Forecast - by Form
- 8. Rest of Africa African Tea Industry Analysis, Insights and Forecast, 2019-2031
- 8.1. Market Analysis, Insights and Forecast - by Form
- 8.1.1. Leaf Tea
- 8.1.2. CTC Tea (Crushed, Teared, and Curled Tea)
- 8.2. Market Analysis, Insights and Forecast - by Product Type
- 8.2.1. Black Tea
- 8.2.2. Green Tea
- 8.2.3. Other Types (White and Oolong)
- 8.3. Market Analysis, Insights and Forecast - by Distribution Channel
- 8.3.1. Supermarkets/Hypermarkets
- 8.3.2. Specialist Retailers
- 8.3.3. Convenience Stores
- 8.3.4. Online Retailers
- 8.3.5. Other Channels
- 8.4. Market Analysis, Insights and Forecast - by Geography
- 8.4.1. South Africa
- 8.4.2. Egypt
- 8.4.3. Rest of Africa
- 8.1. Market Analysis, Insights and Forecast - by Form
- 9. South Africa African Tea Industry Analysis, Insights and Forecast, 2019-2031
- 10. Sudan African Tea Industry Analysis, Insights and Forecast, 2019-2031
- 11. Uganda African Tea Industry Analysis, Insights and Forecast, 2019-2031
- 12. Tanzania African Tea Industry Analysis, Insights and Forecast, 2019-2031
- 13. Kenya African Tea Industry Analysis, Insights and Forecast, 2019-2031
- 14. Rest of Africa African Tea Industry Analysis, Insights and Forecast, 2019-2031
- 15. Competitive Analysis
- 15.1. Market Share Analysis 2024
- 15.2. Company Profiles
- 15.2.1 Bigelow Tea
- 15.2.1.1. Overview
- 15.2.1.2. Products
- 15.2.1.3. SWOT Analysis
- 15.2.1.4. Recent Developments
- 15.2.1.5. Financials (Based on Availability)
- 15.2.2 Twinings
- 15.2.2.1. Overview
- 15.2.2.2. Products
- 15.2.2.3. SWOT Analysis
- 15.2.2.4. Recent Developments
- 15.2.2.5. Financials (Based on Availability)
- 15.2.3 Van Rees
- 15.2.3.1. Overview
- 15.2.3.2. Products
- 15.2.3.3. SWOT Analysis
- 15.2.3.4. Recent Developments
- 15.2.3.5. Financials (Based on Availability)
- 15.2.4 Orientis Group (Kusmi Tea)*List Not Exhaustive
- 15.2.4.1. Overview
- 15.2.4.2. Products
- 15.2.4.3. SWOT Analysis
- 15.2.4.4. Recent Developments
- 15.2.4.5. Financials (Based on Availability)
- 15.2.5 Unilever PLC
- 15.2.5.1. Overview
- 15.2.5.2. Products
- 15.2.5.3. SWOT Analysis
- 15.2.5.4. Recent Developments
- 15.2.5.5. Financials (Based on Availability)
- 15.2.6 DavidsTea
- 15.2.6.1. Overview
- 15.2.6.2. Products
- 15.2.6.3. SWOT Analysis
- 15.2.6.4. Recent Developments
- 15.2.6.5. Financials (Based on Availability)
- 15.2.7 Tata Global Beverages
- 15.2.7.1. Overview
- 15.2.7.2. Products
- 15.2.7.3. SWOT Analysis
- 15.2.7.4. Recent Developments
- 15.2.7.5. Financials (Based on Availability)
- 15.2.8 Chebango Tea Company
- 15.2.8.1. Overview
- 15.2.8.2. Products
- 15.2.8.3. SWOT Analysis
- 15.2.8.4. Recent Developments
- 15.2.8.5. Financials (Based on Availability)
- 15.2.9 Dilmah
- 15.2.9.1. Overview
- 15.2.9.2. Products
- 15.2.9.3. SWOT Analysis
- 15.2.9.4. Recent Developments
- 15.2.9.5. Financials (Based on Availability)
- 15.2.10 Hain Celestial
- 15.2.10.1. Overview
- 15.2.10.2. Products
- 15.2.10.3. SWOT Analysis
- 15.2.10.4. Recent Developments
- 15.2.10.5. Financials (Based on Availability)
- 15.2.1 Bigelow Tea
List of Figures
- Figure 1: African Tea Industry Revenue Breakdown (Million, %) by Product 2024 & 2032
- Figure 2: African Tea Industry Share (%) by Company 2024
List of Tables
- Table 1: African Tea Industry Revenue Million Forecast, by Region 2019 & 2032
- Table 2: African Tea Industry Volume K Tons Forecast, by Region 2019 & 2032
- Table 3: African Tea Industry Revenue Million Forecast, by Form 2019 & 2032
- Table 4: African Tea Industry Volume K Tons Forecast, by Form 2019 & 2032
- Table 5: African Tea Industry Revenue Million Forecast, by Product Type 2019 & 2032
- Table 6: African Tea Industry Volume K Tons Forecast, by Product Type 2019 & 2032
- Table 7: African Tea Industry Revenue Million Forecast, by Distribution Channel 2019 & 2032
- Table 8: African Tea Industry Volume K Tons Forecast, by Distribution Channel 2019 & 2032
- Table 9: African Tea Industry Revenue Million Forecast, by Geography 2019 & 2032
- Table 10: African Tea Industry Volume K Tons Forecast, by Geography 2019 & 2032
- Table 11: African Tea Industry Revenue Million Forecast, by Region 2019 & 2032
- Table 12: African Tea Industry Volume K Tons Forecast, by Region 2019 & 2032
- Table 13: African Tea Industry Revenue Million Forecast, by Country 2019 & 2032
- Table 14: African Tea Industry Volume K Tons Forecast, by Country 2019 & 2032
- Table 15: South Africa African Tea Industry Revenue (Million) Forecast, by Application 2019 & 2032
- Table 16: South Africa African Tea Industry Volume (K Tons) Forecast, by Application 2019 & 2032
- Table 17: Sudan African Tea Industry Revenue (Million) Forecast, by Application 2019 & 2032
- Table 18: Sudan African Tea Industry Volume (K Tons) Forecast, by Application 2019 & 2032
- Table 19: Uganda African Tea Industry Revenue (Million) Forecast, by Application 2019 & 2032
- Table 20: Uganda African Tea Industry Volume (K Tons) Forecast, by Application 2019 & 2032
- Table 21: Tanzania African Tea Industry Revenue (Million) Forecast, by Application 2019 & 2032
- Table 22: Tanzania African Tea Industry Volume (K Tons) Forecast, by Application 2019 & 2032
- Table 23: Kenya African Tea Industry Revenue (Million) Forecast, by Application 2019 & 2032
- Table 24: Kenya African Tea Industry Volume (K Tons) Forecast, by Application 2019 & 2032
- Table 25: Rest of Africa African Tea Industry Revenue (Million) Forecast, by Application 2019 & 2032
- Table 26: Rest of Africa African Tea Industry Volume (K Tons) Forecast, by Application 2019 & 2032
- Table 27: African Tea Industry Revenue Million Forecast, by Form 2019 & 2032
- Table 28: African Tea Industry Volume K Tons Forecast, by Form 2019 & 2032
- Table 29: African Tea Industry Revenue Million Forecast, by Product Type 2019 & 2032
- Table 30: African Tea Industry Volume K Tons Forecast, by Product Type 2019 & 2032
- Table 31: African Tea Industry Revenue Million Forecast, by Distribution Channel 2019 & 2032
- Table 32: African Tea Industry Volume K Tons Forecast, by Distribution Channel 2019 & 2032
- Table 33: African Tea Industry Revenue Million Forecast, by Geography 2019 & 2032
- Table 34: African Tea Industry Volume K Tons Forecast, by Geography 2019 & 2032
- Table 35: African Tea Industry Revenue Million Forecast, by Country 2019 & 2032
- Table 36: African Tea Industry Volume K Tons Forecast, by Country 2019 & 2032
- Table 37: African Tea Industry Revenue Million Forecast, by Form 2019 & 2032
- Table 38: African Tea Industry Volume K Tons Forecast, by Form 2019 & 2032
- Table 39: African Tea Industry Revenue Million Forecast, by Product Type 2019 & 2032
- Table 40: African Tea Industry Volume K Tons Forecast, by Product Type 2019 & 2032
- Table 41: African Tea Industry Revenue Million Forecast, by Distribution Channel 2019 & 2032
- Table 42: African Tea Industry Volume K Tons Forecast, by Distribution Channel 2019 & 2032
- Table 43: African Tea Industry Revenue Million Forecast, by Geography 2019 & 2032
- Table 44: African Tea Industry Volume K Tons Forecast, by Geography 2019 & 2032
- Table 45: African Tea Industry Revenue Million Forecast, by Country 2019 & 2032
- Table 46: African Tea Industry Volume K Tons Forecast, by Country 2019 & 2032
- Table 47: African Tea Industry Revenue Million Forecast, by Form 2019 & 2032
- Table 48: African Tea Industry Volume K Tons Forecast, by Form 2019 & 2032
- Table 49: African Tea Industry Revenue Million Forecast, by Product Type 2019 & 2032
- Table 50: African Tea Industry Volume K Tons Forecast, by Product Type 2019 & 2032
- Table 51: African Tea Industry Revenue Million Forecast, by Distribution Channel 2019 & 2032
- Table 52: African Tea Industry Volume K Tons Forecast, by Distribution Channel 2019 & 2032
- Table 53: African Tea Industry Revenue Million Forecast, by Geography 2019 & 2032
- Table 54: African Tea Industry Volume K Tons Forecast, by Geography 2019 & 2032
- Table 55: African Tea Industry Revenue Million Forecast, by Country 2019 & 2032
- Table 56: African Tea Industry Volume K Tons Forecast, by Country 2019 & 2032
Frequently Asked Questions
1. What is the projected Compound Annual Growth Rate (CAGR) of the African Tea Industry?
The projected CAGR is approximately 5.50%.
2. Which companies are prominent players in the African Tea Industry?
Key companies in the market include Bigelow Tea, Twinings, Van Rees, Orientis Group (Kusmi Tea)*List Not Exhaustive, Unilever PLC, DavidsTea, Tata Global Beverages, Chebango Tea Company, Dilmah, Hain Celestial.
3. What are the main segments of the African Tea Industry?
The market segments include Form, Product Type, Distribution Channel, Geography.
4. Can you provide details about the market size?
The market size is estimated to be USD XX Million as of 2022.
5. What are some drivers contributing to market growth?
Increasing Demand for Herbal Teas; Increasing Consumer Awareness about Health Benefits of Tea.
6. What are the notable trends driving market growth?
Increasing Tea Production in African Countries.
7. Are there any restraints impacting market growth?
High Cost of Production of Green Tea.
8. Can you provide examples of recent developments in the market?
N/A
9. What pricing options are available for accessing the report?
Pricing options include single-user, multi-user, and enterprise licenses priced at USD 4750, USD 5250, and USD 8750 respectively.
10. Is the market size provided in terms of value or volume?
The market size is provided in terms of value, measured in Million and volume, measured in K Tons.
11. Are there any specific market keywords associated with the report?
Yes, the market keyword associated with the report is "African Tea Industry," which aids in identifying and referencing the specific market segment covered.
12. How do I determine which pricing option suits my needs best?
The pricing options vary based on user requirements and access needs. Individual users may opt for single-user licenses, while businesses requiring broader access may choose multi-user or enterprise licenses for cost-effective access to the report.
13. Are there any additional resources or data provided in the African Tea Industry report?
While the report offers comprehensive insights, it's advisable to review the specific contents or supplementary materials provided to ascertain if additional resources or data are available.
14. How can I stay updated on further developments or reports in the African Tea Industry?
To stay informed about further developments, trends, and reports in the African Tea Industry, consider subscribing to industry newsletters, following relevant companies and organizations, or regularly checking reputable industry news sources and publications.
Methodology
Step 1 - Identification of Relevant Samples Size from Population Database


Step 2 - Approaches for Defining Global Market Size (Value, Volume* & Price*)

Note*: In applicable scenarios
Step 3 - Data Sources
Primary Research
- Web Analytics
- Survey Reports
- Research Institute
- Latest Research Reports
- Opinion Leaders
Secondary Research
- Annual Reports
- White Paper
- Latest Press Release
- Industry Association
- Paid Database
- Investor Presentations

Step 4 - Data Triangulation
Involves using different sources of information in order to increase the validity of a study
These sources are likely to be stakeholders in a program - participants, other researchers, program staff, other community members, and so on.
Then we put all data in single framework & apply various statistical tools to find out the dynamic on the market.
During the analysis stage, feedback from the stakeholder groups would be compared to determine areas of agreement as well as areas of divergence


