
Key Insights
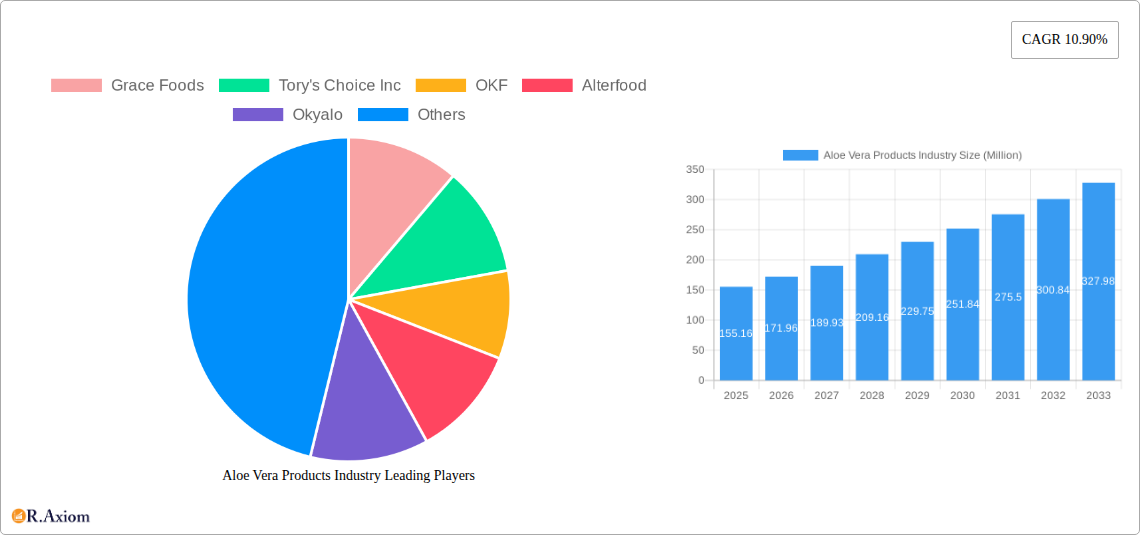
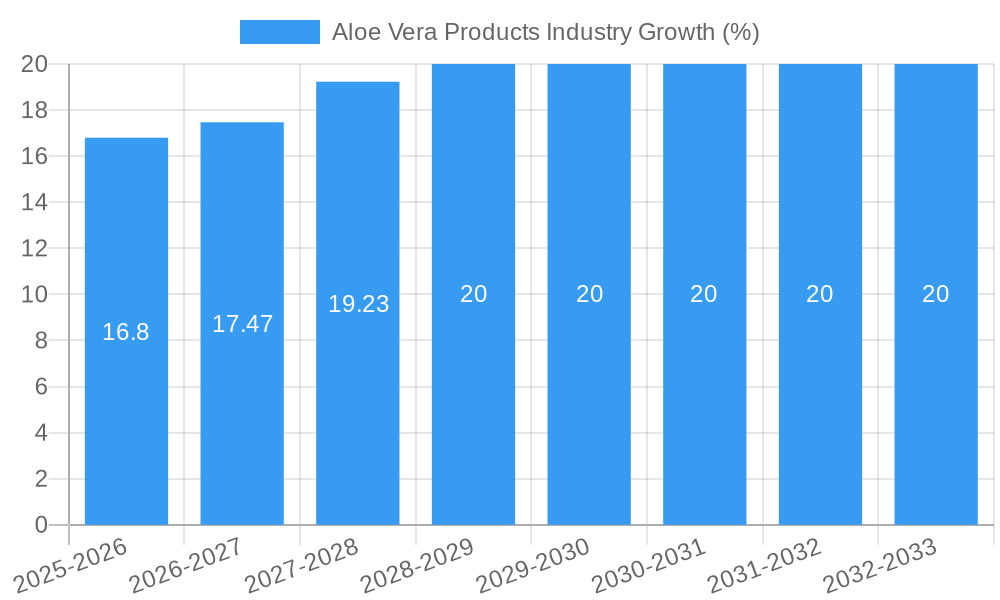
The global aloe vera products market, valued at $155.16 million in 2025, is projected to experience robust growth, driven by a Compound Annual Growth Rate (CAGR) of 10.90% from 2025 to 2033. This expansion is fueled by several key factors. The rising consumer awareness of aloe vera's health benefits, particularly its soothing properties for skin and digestive health, is a primary driver. Growing demand for natural and organic products further bolsters market growth, as aloe vera aligns perfectly with this trend. The diverse applications of aloe vera, spanning beverages, skincare products, and dietary supplements, contribute to the market's broad appeal. Product innovation, including the development of new formulations and convenient packaging formats, also stimulates market expansion. The increasing prevalence of online retail channels provides convenient access to aloe vera products for a wider consumer base. While the market faces some restraints, such as price fluctuations in raw materials and potential challenges related to product standardization and quality control, the overall market outlook remains highly positive.
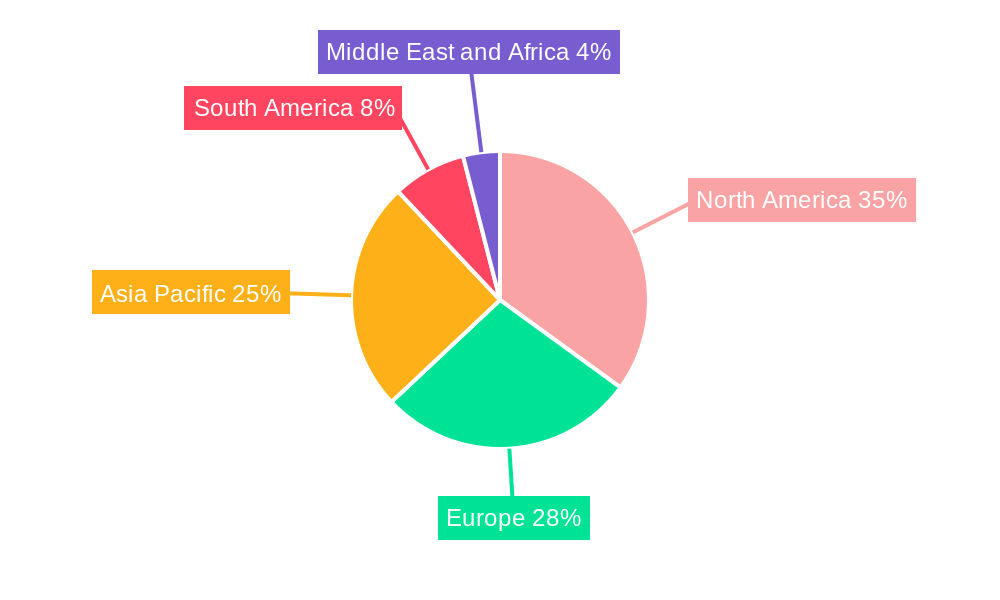
Geographic segmentation reveals a varied market landscape. North America, with its established health and wellness culture and strong consumer base, likely holds a significant market share. The Asia-Pacific region, characterized by a rapidly growing population and increasing disposable incomes, also presents substantial growth opportunities. Europe, while a mature market, continues to show steady growth driven by health-conscious consumers. South America and the Middle East and Africa, while currently smaller market segments, are expected to witness expansion in the coming years, driven by growing awareness and increasing adoption of aloe vera products. Competition within the market is relatively moderate, with key players focusing on product differentiation and brand building to establish their presence. The market's future trajectory is promising, with continued growth anticipated across various regions and product categories.
Aloe Vera Products Industry: A Comprehensive Market Report (2019-2033)
This comprehensive report provides a detailed analysis of the global Aloe Vera Products industry, encompassing market size, segmentation, competitive landscape, and future growth projections. The study period covers 2019-2033, with 2025 serving as the base and estimated year. The forecast period spans 2025-2033, and the historical period analyzed is 2019-2024. This report is essential for industry stakeholders, investors, and businesses seeking to understand the current market dynamics and future opportunities within this rapidly evolving sector. The total market value in 2025 is estimated at $XX Million.
Aloe Vera Products Industry Market Concentration & Innovation
The Aloe Vera Products industry exhibits a moderately concentrated market structure, with several key players holding significant market share. While precise market share data for each company requires further detailed research, companies like Forever Living Products and Simplee Aloe are expected to hold prominent positions. However, the market also accommodates numerous smaller players, particularly in regional markets. Innovation is driven by consumer demand for healthier and more convenient beverage options, fueling the development of new product formulations and packaging solutions. Regulatory frameworks vary across regions, influencing product labeling, ingredient sourcing, and manufacturing processes. The market faces competition from substitute products, including other functional beverages and health supplements. End-user trends reflect a growing preference for natural, organic, and ethically sourced products. Mergers and acquisitions (M&A) activity has been moderate, with deal values varying depending on the size and strategic goals of the companies involved. In 2024, estimated M&A deal value across the sector was $XX Million.
Aloe Vera Products Industry Industry Trends & Insights
The Aloe Vera Products industry is experiencing robust growth, driven by several factors. The increasing consumer awareness of health and wellness benefits associated with aloe vera is a primary driver. The rising demand for natural and functional beverages is further boosting market expansion. Technological advancements in processing and packaging are enhancing product quality, shelf life, and convenience. Consumer preferences are shifting towards organic, plant-based, and ethically sourced aloe vera products, influencing product development and marketing strategies. Competitive dynamics are shaped by pricing strategies, product differentiation, and branding. The Compound Annual Growth Rate (CAGR) for the forecast period (2025-2033) is projected to be XX%, with market penetration expected to reach XX% by 2033. Emerging markets, particularly in Asia and Latin America, present significant growth opportunities.
Dominant Markets & Segments in Aloe Vera Products Industry
The global Aloe Vera Products market shows strong growth potential across various regions and segments. While specific regional dominance requires further analysis, Asia-Pacific and North America are anticipated as key markets, driven by factors such as increased disposable income, health-conscious consumers and favorable government regulations.
By Product Type:
- Bottled drinks: This segment is expected to dominate due to its convenience and widespread availability.
- Aloe Vera water: Growing popularity as a refreshing and healthy beverage alternative fuels this segment's growth.
- Juice Concentrates: Offers versatility for consumers and manufacturers, contributing moderately to the overall market.
- Hot drinks: This segment exhibits slower growth compared to others, but has niche applications and target markets.
By Distribution Channel:
- Supermarkets/Hypermarkets: Remain a major distribution channel due to high consumer reach.
- Convenience/Grocery Stores: Provides accessibility to a wider customer base.
- Online Retail Stores: Rapidly expanding reach and convenience increases e-commerce sales.
- Specialty Stores: Catter to specific consumer preferences and focus on high-quality products.
- Other Distribution Channels: Includes direct-to-consumer sales and food service.
Key drivers for dominance in specific regions and segments include favorable economic policies promoting health and wellness, well-developed retail infrastructure, and a strong focus on natural and organic products.
Aloe Vera Products Industry Product Developments
Recent product innovations have focused on enhancing taste, convenience, and health benefits. This includes the introduction of novel flavors, functional blends (e.g., with other fruits, herbs, or superfoods), and convenient packaging formats like single-serve bottles and pouches. Technological advancements in extraction and processing methods aim to improve product quality and reduce costs. The market is seeing increased emphasis on organic certifications, sustainable sourcing, and transparent labeling to cater to conscious consumers.
Report Scope & Segmentation Analysis
This report provides a comprehensive segmentation analysis of the Aloe Vera Products market across various product types (Hot drinks, Bottled drinks, Juice Concentrates, Aloe Vera water) and distribution channels (Supermarkets/Hypermarkets, Convenience/Grocery Stores, Specialty Stores, Online Retail Stores, Other Distribution Channels). Each segment's growth projection, market size, and competitive dynamics are thoroughly assessed to provide a detailed understanding of the market landscape. Growth projections vary by segment based on factors like consumer preferences and distribution accessibility.
Key Drivers of Aloe Vera Products Industry Growth
Several factors contribute to the industry's growth. The increasing health consciousness among consumers, coupled with the perceived health benefits of aloe vera, is a primary driver. The rising demand for natural and functional beverages is another significant factor. Technological advancements in processing and packaging enhance product quality and accessibility, further driving market expansion. Moreover, favorable government regulations and supportive policies in some regions create a conducive environment for market growth.
Challenges in the Aloe Vera Products Industry Sector
The Aloe Vera Products industry faces several challenges, including fluctuations in raw material prices due to aloe vera's reliance on agriculture. Maintaining consistent product quality and managing supply chain complexities can be difficult. The industry also faces intense competition from substitute beverages and other health products. Regulatory hurdles and compliance requirements vary across regions, adding to operational complexities. These factors could result in an estimated XX Million in losses annually.
Emerging Opportunities in Aloe Vera Products Industry
Significant opportunities exist in expanding into untapped markets, particularly in developing economies. The incorporation of aloe vera into new product categories, such as skincare and personal care products, presents significant potential. Innovations in product formulation and packaging can offer unique value propositions to consumers. Focusing on sustainable and ethical sourcing practices appeals to an increasing segment of environmentally conscious consumers.
Leading Players in the Aloe Vera Products Industry Market
- Grace Foods
- Tory's Choice Inc
- OKF
- Alterfood
- Okyalo
- Houssy Global
- Veganic
- Forever Living Products
- Simplee Aloe
Key Developments in Aloe Vera Products Industry Industry
- April 2021: Veganic launched 100% organic and plant-based aloe vera fruit juices in the United States.
- October 2021: Sappe launched two new aloe vera drinks in Thailand.
- September 2022: 1NE Beverages launched aloe vera juices in India.
These product launches reflect the growing consumer demand for healthy and convenient aloe vera-based products.
Strategic Outlook for Aloe Vera Products Industry Market
The Aloe Vera Products market holds significant growth potential driven by continued consumer demand for healthy beverages and advancements in product formulation and packaging. Strategic partnerships, focused investments in research and development, and expansion into new markets will be critical for companies to capitalize on future growth opportunities. The market is predicted to reach $XX Million by 2033, demonstrating a robust outlook.
Aloe Vera Products Industry Segmentation
-
1. Product Type
- 1.1. Hot drinks
- 1.2. Bottled drinks
- 1.3. Juice Concentrates
- 1.4. Aloe Vera water
-
2. Distribution Channel
- 2.1. Supermarkets/Hypermarkets
- 2.2. Convenience/Grocery Stores
- 2.3. Specialty Stores
- 2.4. Online Retail Stores
- 2.5. Other Distribution Channels
Aloe Vera Products Industry Segmentation By Geography
-
1. North America
- 1.1. United States
- 1.2. Canada
- 1.3. Mexico
- 1.4. Rest of North America
-
2. Europe
- 2.1. Spain
- 2.2. United Kingdom
- 2.3. Germany
- 2.4. France
- 2.5. Italy
- 2.6. Russia
- 2.7. Rest of Europe
-
3. Asia Pacific
- 3.1. China
- 3.2. Japan
- 3.3. India
- 3.4. Australia
- 3.5. Rest of Asia Pacific
-
4. South America
- 4.1. Brazil
- 4.2. Argentina
- 4.3. Rest of South America
-
5. Middle East and Africa
- 5.1. South Africa
- 5.2. Saudi Arabia
- 5.3. Rest of Middle East and Africa
Aloe Vera Products Industry REPORT HIGHLIGHTS
| Aspects | Details |
|---|---|
| Study Period | 2019-2033 |
| Base Year | 2024 |
| Estimated Year | 2025 |
| Forecast Period | 2025-2033 |
| Historical Period | 2019-2024 |
| Growth Rate | CAGR of 10.90% from 2019-2033 |
| Segmentation |
|
Table of Contents
- 1. Introduction
- 1.1. Research Scope
- 1.2. Market Segmentation
- 1.3. Research Methodology
- 1.4. Definitions and Assumptions
- 2. Executive Summary
- 2.1. Introduction
- 3. Market Dynamics
- 3.1. Introduction
- 3.2. Market Drivers
- 3.2.1. Increasing Consumer Awareness Regarding Natural Products; Growing Demand for Anthocyanin in Pharmaceutical Industry
- 3.3. Market Restrains
- 3.3.1. Easy Availability of Synthetic Food Colorant
- 3.4. Market Trends
- 3.4.1. Aloe Vera based Juices to Witness Higher Growth
- 4. Market Factor Analysis
- 4.1. Porters Five Forces
- 4.2. Supply/Value Chain
- 4.3. PESTEL analysis
- 4.4. Market Entropy
- 4.5. Patent/Trademark Analysis
- 5. Global Aloe Vera Products Industry Analysis, Insights and Forecast, 2019-2031
- 5.1. Market Analysis, Insights and Forecast - by Product Type
- 5.1.1. Hot drinks
- 5.1.2. Bottled drinks
- 5.1.3. Juice Concentrates
- 5.1.4. Aloe Vera water
- 5.2. Market Analysis, Insights and Forecast - by Distribution Channel
- 5.2.1. Supermarkets/Hypermarkets
- 5.2.2. Convenience/Grocery Stores
- 5.2.3. Specialty Stores
- 5.2.4. Online Retail Stores
- 5.2.5. Other Distribution Channels
- 5.3. Market Analysis, Insights and Forecast - by Region
- 5.3.1. North America
- 5.3.2. Europe
- 5.3.3. Asia Pacific
- 5.3.4. South America
- 5.3.5. Middle East and Africa
- 5.1. Market Analysis, Insights and Forecast - by Product Type
- 6. North America Aloe Vera Products Industry Analysis, Insights and Forecast, 2019-2031
- 6.1. Market Analysis, Insights and Forecast - by Product Type
- 6.1.1. Hot drinks
- 6.1.2. Bottled drinks
- 6.1.3. Juice Concentrates
- 6.1.4. Aloe Vera water
- 6.2. Market Analysis, Insights and Forecast - by Distribution Channel
- 6.2.1. Supermarkets/Hypermarkets
- 6.2.2. Convenience/Grocery Stores
- 6.2.3. Specialty Stores
- 6.2.4. Online Retail Stores
- 6.2.5. Other Distribution Channels
- 6.1. Market Analysis, Insights and Forecast - by Product Type
- 7. Europe Aloe Vera Products Industry Analysis, Insights and Forecast, 2019-2031
- 7.1. Market Analysis, Insights and Forecast - by Product Type
- 7.1.1. Hot drinks
- 7.1.2. Bottled drinks
- 7.1.3. Juice Concentrates
- 7.1.4. Aloe Vera water
- 7.2. Market Analysis, Insights and Forecast - by Distribution Channel
- 7.2.1. Supermarkets/Hypermarkets
- 7.2.2. Convenience/Grocery Stores
- 7.2.3. Specialty Stores
- 7.2.4. Online Retail Stores
- 7.2.5. Other Distribution Channels
- 7.1. Market Analysis, Insights and Forecast - by Product Type
- 8. Asia Pacific Aloe Vera Products Industry Analysis, Insights and Forecast, 2019-2031
- 8.1. Market Analysis, Insights and Forecast - by Product Type
- 8.1.1. Hot drinks
- 8.1.2. Bottled drinks
- 8.1.3. Juice Concentrates
- 8.1.4. Aloe Vera water
- 8.2. Market Analysis, Insights and Forecast - by Distribution Channel
- 8.2.1. Supermarkets/Hypermarkets
- 8.2.2. Convenience/Grocery Stores
- 8.2.3. Specialty Stores
- 8.2.4. Online Retail Stores
- 8.2.5. Other Distribution Channels
- 8.1. Market Analysis, Insights and Forecast - by Product Type
- 9. South America Aloe Vera Products Industry Analysis, Insights and Forecast, 2019-2031
- 9.1. Market Analysis, Insights and Forecast - by Product Type
- 9.1.1. Hot drinks
- 9.1.2. Bottled drinks
- 9.1.3. Juice Concentrates
- 9.1.4. Aloe Vera water
- 9.2. Market Analysis, Insights and Forecast - by Distribution Channel
- 9.2.1. Supermarkets/Hypermarkets
- 9.2.2. Convenience/Grocery Stores
- 9.2.3. Specialty Stores
- 9.2.4. Online Retail Stores
- 9.2.5. Other Distribution Channels
- 9.1. Market Analysis, Insights and Forecast - by Product Type
- 10. Middle East and Africa Aloe Vera Products Industry Analysis, Insights and Forecast, 2019-2031
- 10.1. Market Analysis, Insights and Forecast - by Product Type
- 10.1.1. Hot drinks
- 10.1.2. Bottled drinks
- 10.1.3. Juice Concentrates
- 10.1.4. Aloe Vera water
- 10.2. Market Analysis, Insights and Forecast - by Distribution Channel
- 10.2.1. Supermarkets/Hypermarkets
- 10.2.2. Convenience/Grocery Stores
- 10.2.3. Specialty Stores
- 10.2.4. Online Retail Stores
- 10.2.5. Other Distribution Channels
- 10.1. Market Analysis, Insights and Forecast - by Product Type
- 11. North America Aloe Vera Products Industry Analysis, Insights and Forecast, 2019-2031
- 11.1. Market Analysis, Insights and Forecast - By Country/Sub-region
- 11.1.1 United States
- 11.1.2 Canada
- 11.1.3 Mexico
- 11.1.4 Rest of North America
- 12. Europe Aloe Vera Products Industry Analysis, Insights and Forecast, 2019-2031
- 12.1. Market Analysis, Insights and Forecast - By Country/Sub-region
- 12.1.1 Spain
- 12.1.2 United Kingdom
- 12.1.3 Germany
- 12.1.4 France
- 12.1.5 Italy
- 12.1.6 Russia
- 12.1.7 Rest of Europe
- 13. Asia Pacific Aloe Vera Products Industry Analysis, Insights and Forecast, 2019-2031
- 13.1. Market Analysis, Insights and Forecast - By Country/Sub-region
- 13.1.1 China
- 13.1.2 Japan
- 13.1.3 India
- 13.1.4 Australia
- 13.1.5 Rest of Asia Pacific
- 14. South America Aloe Vera Products Industry Analysis, Insights and Forecast, 2019-2031
- 14.1. Market Analysis, Insights and Forecast - By Country/Sub-region
- 14.1.1 Brazil
- 14.1.2 Argentina
- 14.1.3 Rest of South America
- 15. Middle East and Africa Aloe Vera Products Industry Analysis, Insights and Forecast, 2019-2031
- 15.1. Market Analysis, Insights and Forecast - By Country/Sub-region
- 15.1.1 South Africa
- 15.1.2 Saudi Arabia
- 15.1.3 Rest of Middle East and Africa
- 16. Competitive Analysis
- 16.1. Global Market Share Analysis 2024
- 16.2. Company Profiles
- 16.2.1 Grace Foods
- 16.2.1.1. Overview
- 16.2.1.2. Products
- 16.2.1.3. SWOT Analysis
- 16.2.1.4. Recent Developments
- 16.2.1.5. Financials (Based on Availability)
- 16.2.2 Tory's Choice Inc
- 16.2.2.1. Overview
- 16.2.2.2. Products
- 16.2.2.3. SWOT Analysis
- 16.2.2.4. Recent Developments
- 16.2.2.5. Financials (Based on Availability)
- 16.2.3 OKF
- 16.2.3.1. Overview
- 16.2.3.2. Products
- 16.2.3.3. SWOT Analysis
- 16.2.3.4. Recent Developments
- 16.2.3.5. Financials (Based on Availability)
- 16.2.4 Alterfood
- 16.2.4.1. Overview
- 16.2.4.2. Products
- 16.2.4.3. SWOT Analysis
- 16.2.4.4. Recent Developments
- 16.2.4.5. Financials (Based on Availability)
- 16.2.5 Okyalo
- 16.2.5.1. Overview
- 16.2.5.2. Products
- 16.2.5.3. SWOT Analysis
- 16.2.5.4. Recent Developments
- 16.2.5.5. Financials (Based on Availability)
- 16.2.6 Houssy Global
- 16.2.6.1. Overview
- 16.2.6.2. Products
- 16.2.6.3. SWOT Analysis
- 16.2.6.4. Recent Developments
- 16.2.6.5. Financials (Based on Availability)
- 16.2.7 Veganic*List Not Exhaustive
- 16.2.7.1. Overview
- 16.2.7.2. Products
- 16.2.7.3. SWOT Analysis
- 16.2.7.4. Recent Developments
- 16.2.7.5. Financials (Based on Availability)
- 16.2.8 Forever Living Products
- 16.2.8.1. Overview
- 16.2.8.2. Products
- 16.2.8.3. SWOT Analysis
- 16.2.8.4. Recent Developments
- 16.2.8.5. Financials (Based on Availability)
- 16.2.9 Simplee Aloe
- 16.2.9.1. Overview
- 16.2.9.2. Products
- 16.2.9.3. SWOT Analysis
- 16.2.9.4. Recent Developments
- 16.2.9.5. Financials (Based on Availability)
- 16.2.1 Grace Foods
List of Figures
- Figure 1: Global Aloe Vera Products Industry Revenue Breakdown (Million, %) by Region 2024 & 2032
- Figure 2: North America Aloe Vera Products Industry Revenue (Million), by Country 2024 & 2032
- Figure 3: North America Aloe Vera Products Industry Revenue Share (%), by Country 2024 & 2032
- Figure 4: Europe Aloe Vera Products Industry Revenue (Million), by Country 2024 & 2032
- Figure 5: Europe Aloe Vera Products Industry Revenue Share (%), by Country 2024 & 2032
- Figure 6: Asia Pacific Aloe Vera Products Industry Revenue (Million), by Country 2024 & 2032
- Figure 7: Asia Pacific Aloe Vera Products Industry Revenue Share (%), by Country 2024 & 2032
- Figure 8: South America Aloe Vera Products Industry Revenue (Million), by Country 2024 & 2032
- Figure 9: South America Aloe Vera Products Industry Revenue Share (%), by Country 2024 & 2032
- Figure 10: Middle East and Africa Aloe Vera Products Industry Revenue (Million), by Country 2024 & 2032
- Figure 11: Middle East and Africa Aloe Vera Products Industry Revenue Share (%), by Country 2024 & 2032
- Figure 12: North America Aloe Vera Products Industry Revenue (Million), by Product Type 2024 & 2032
- Figure 13: North America Aloe Vera Products Industry Revenue Share (%), by Product Type 2024 & 2032
- Figure 14: North America Aloe Vera Products Industry Revenue (Million), by Distribution Channel 2024 & 2032
- Figure 15: North America Aloe Vera Products Industry Revenue Share (%), by Distribution Channel 2024 & 2032
- Figure 16: North America Aloe Vera Products Industry Revenue (Million), by Country 2024 & 2032
- Figure 17: North America Aloe Vera Products Industry Revenue Share (%), by Country 2024 & 2032
- Figure 18: Europe Aloe Vera Products Industry Revenue (Million), by Product Type 2024 & 2032
- Figure 19: Europe Aloe Vera Products Industry Revenue Share (%), by Product Type 2024 & 2032
- Figure 20: Europe Aloe Vera Products Industry Revenue (Million), by Distribution Channel 2024 & 2032
- Figure 21: Europe Aloe Vera Products Industry Revenue Share (%), by Distribution Channel 2024 & 2032
- Figure 22: Europe Aloe Vera Products Industry Revenue (Million), by Country 2024 & 2032
- Figure 23: Europe Aloe Vera Products Industry Revenue Share (%), by Country 2024 & 2032
- Figure 24: Asia Pacific Aloe Vera Products Industry Revenue (Million), by Product Type 2024 & 2032
- Figure 25: Asia Pacific Aloe Vera Products Industry Revenue Share (%), by Product Type 2024 & 2032
- Figure 26: Asia Pacific Aloe Vera Products Industry Revenue (Million), by Distribution Channel 2024 & 2032
- Figure 27: Asia Pacific Aloe Vera Products Industry Revenue Share (%), by Distribution Channel 2024 & 2032
- Figure 28: Asia Pacific Aloe Vera Products Industry Revenue (Million), by Country 2024 & 2032
- Figure 29: Asia Pacific Aloe Vera Products Industry Revenue Share (%), by Country 2024 & 2032
- Figure 30: South America Aloe Vera Products Industry Revenue (Million), by Product Type 2024 & 2032
- Figure 31: South America Aloe Vera Products Industry Revenue Share (%), by Product Type 2024 & 2032
- Figure 32: South America Aloe Vera Products Industry Revenue (Million), by Distribution Channel 2024 & 2032
- Figure 33: South America Aloe Vera Products Industry Revenue Share (%), by Distribution Channel 2024 & 2032
- Figure 34: South America Aloe Vera Products Industry Revenue (Million), by Country 2024 & 2032
- Figure 35: South America Aloe Vera Products Industry Revenue Share (%), by Country 2024 & 2032
- Figure 36: Middle East and Africa Aloe Vera Products Industry Revenue (Million), by Product Type 2024 & 2032
- Figure 37: Middle East and Africa Aloe Vera Products Industry Revenue Share (%), by Product Type 2024 & 2032
- Figure 38: Middle East and Africa Aloe Vera Products Industry Revenue (Million), by Distribution Channel 2024 & 2032
- Figure 39: Middle East and Africa Aloe Vera Products Industry Revenue Share (%), by Distribution Channel 2024 & 2032
- Figure 40: Middle East and Africa Aloe Vera Products Industry Revenue (Million), by Country 2024 & 2032
- Figure 41: Middle East and Africa Aloe Vera Products Industry Revenue Share (%), by Country 2024 & 2032
List of Tables
- Table 1: Global Aloe Vera Products Industry Revenue Million Forecast, by Region 2019 & 2032
- Table 2: Global Aloe Vera Products Industry Revenue Million Forecast, by Product Type 2019 & 2032
- Table 3: Global Aloe Vera Products Industry Revenue Million Forecast, by Distribution Channel 2019 & 2032
- Table 4: Global Aloe Vera Products Industry Revenue Million Forecast, by Region 2019 & 2032
- Table 5: Global Aloe Vera Products Industry Revenue Million Forecast, by Country 2019 & 2032
- Table 6: United States Aloe Vera Products Industry Revenue (Million) Forecast, by Application 2019 & 2032
- Table 7: Canada Aloe Vera Products Industry Revenue (Million) Forecast, by Application 2019 & 2032
- Table 8: Mexico Aloe Vera Products Industry Revenue (Million) Forecast, by Application 2019 & 2032
- Table 9: Rest of North America Aloe Vera Products Industry Revenue (Million) Forecast, by Application 2019 & 2032
- Table 10: Global Aloe Vera Products Industry Revenue Million Forecast, by Country 2019 & 2032
- Table 11: Spain Aloe Vera Products Industry Revenue (Million) Forecast, by Application 2019 & 2032
- Table 12: United Kingdom Aloe Vera Products Industry Revenue (Million) Forecast, by Application 2019 & 2032
- Table 13: Germany Aloe Vera Products Industry Revenue (Million) Forecast, by Application 2019 & 2032
- Table 14: France Aloe Vera Products Industry Revenue (Million) Forecast, by Application 2019 & 2032
- Table 15: Italy Aloe Vera Products Industry Revenue (Million) Forecast, by Application 2019 & 2032
- Table 16: Russia Aloe Vera Products Industry Revenue (Million) Forecast, by Application 2019 & 2032
- Table 17: Rest of Europe Aloe Vera Products Industry Revenue (Million) Forecast, by Application 2019 & 2032
- Table 18: Global Aloe Vera Products Industry Revenue Million Forecast, by Country 2019 & 2032
- Table 19: China Aloe Vera Products Industry Revenue (Million) Forecast, by Application 2019 & 2032
- Table 20: Japan Aloe Vera Products Industry Revenue (Million) Forecast, by Application 2019 & 2032
- Table 21: India Aloe Vera Products Industry Revenue (Million) Forecast, by Application 2019 & 2032
- Table 22: Australia Aloe Vera Products Industry Revenue (Million) Forecast, by Application 2019 & 2032
- Table 23: Rest of Asia Pacific Aloe Vera Products Industry Revenue (Million) Forecast, by Application 2019 & 2032
- Table 24: Global Aloe Vera Products Industry Revenue Million Forecast, by Country 2019 & 2032
- Table 25: Brazil Aloe Vera Products Industry Revenue (Million) Forecast, by Application 2019 & 2032
- Table 26: Argentina Aloe Vera Products Industry Revenue (Million) Forecast, by Application 2019 & 2032
- Table 27: Rest of South America Aloe Vera Products Industry Revenue (Million) Forecast, by Application 2019 & 2032
- Table 28: Global Aloe Vera Products Industry Revenue Million Forecast, by Country 2019 & 2032
- Table 29: South Africa Aloe Vera Products Industry Revenue (Million) Forecast, by Application 2019 & 2032
- Table 30: Saudi Arabia Aloe Vera Products Industry Revenue (Million) Forecast, by Application 2019 & 2032
- Table 31: Rest of Middle East and Africa Aloe Vera Products Industry Revenue (Million) Forecast, by Application 2019 & 2032
- Table 32: Global Aloe Vera Products Industry Revenue Million Forecast, by Product Type 2019 & 2032
- Table 33: Global Aloe Vera Products Industry Revenue Million Forecast, by Distribution Channel 2019 & 2032
- Table 34: Global Aloe Vera Products Industry Revenue Million Forecast, by Country 2019 & 2032
- Table 35: United States Aloe Vera Products Industry Revenue (Million) Forecast, by Application 2019 & 2032
- Table 36: Canada Aloe Vera Products Industry Revenue (Million) Forecast, by Application 2019 & 2032
- Table 37: Mexico Aloe Vera Products Industry Revenue (Million) Forecast, by Application 2019 & 2032
- Table 38: Rest of North America Aloe Vera Products Industry Revenue (Million) Forecast, by Application 2019 & 2032
- Table 39: Global Aloe Vera Products Industry Revenue Million Forecast, by Product Type 2019 & 2032
- Table 40: Global Aloe Vera Products Industry Revenue Million Forecast, by Distribution Channel 2019 & 2032
- Table 41: Global Aloe Vera Products Industry Revenue Million Forecast, by Country 2019 & 2032
- Table 42: Spain Aloe Vera Products Industry Revenue (Million) Forecast, by Application 2019 & 2032
- Table 43: United Kingdom Aloe Vera Products Industry Revenue (Million) Forecast, by Application 2019 & 2032
- Table 44: Germany Aloe Vera Products Industry Revenue (Million) Forecast, by Application 2019 & 2032
- Table 45: France Aloe Vera Products Industry Revenue (Million) Forecast, by Application 2019 & 2032
- Table 46: Italy Aloe Vera Products Industry Revenue (Million) Forecast, by Application 2019 & 2032
- Table 47: Russia Aloe Vera Products Industry Revenue (Million) Forecast, by Application 2019 & 2032
- Table 48: Rest of Europe Aloe Vera Products Industry Revenue (Million) Forecast, by Application 2019 & 2032
- Table 49: Global Aloe Vera Products Industry Revenue Million Forecast, by Product Type 2019 & 2032
- Table 50: Global Aloe Vera Products Industry Revenue Million Forecast, by Distribution Channel 2019 & 2032
- Table 51: Global Aloe Vera Products Industry Revenue Million Forecast, by Country 2019 & 2032
- Table 52: China Aloe Vera Products Industry Revenue (Million) Forecast, by Application 2019 & 2032
- Table 53: Japan Aloe Vera Products Industry Revenue (Million) Forecast, by Application 2019 & 2032
- Table 54: India Aloe Vera Products Industry Revenue (Million) Forecast, by Application 2019 & 2032
- Table 55: Australia Aloe Vera Products Industry Revenue (Million) Forecast, by Application 2019 & 2032
- Table 56: Rest of Asia Pacific Aloe Vera Products Industry Revenue (Million) Forecast, by Application 2019 & 2032
- Table 57: Global Aloe Vera Products Industry Revenue Million Forecast, by Product Type 2019 & 2032
- Table 58: Global Aloe Vera Products Industry Revenue Million Forecast, by Distribution Channel 2019 & 2032
- Table 59: Global Aloe Vera Products Industry Revenue Million Forecast, by Country 2019 & 2032
- Table 60: Brazil Aloe Vera Products Industry Revenue (Million) Forecast, by Application 2019 & 2032
- Table 61: Argentina Aloe Vera Products Industry Revenue (Million) Forecast, by Application 2019 & 2032
- Table 62: Rest of South America Aloe Vera Products Industry Revenue (Million) Forecast, by Application 2019 & 2032
- Table 63: Global Aloe Vera Products Industry Revenue Million Forecast, by Product Type 2019 & 2032
- Table 64: Global Aloe Vera Products Industry Revenue Million Forecast, by Distribution Channel 2019 & 2032
- Table 65: Global Aloe Vera Products Industry Revenue Million Forecast, by Country 2019 & 2032
- Table 66: South Africa Aloe Vera Products Industry Revenue (Million) Forecast, by Application 2019 & 2032
- Table 67: Saudi Arabia Aloe Vera Products Industry Revenue (Million) Forecast, by Application 2019 & 2032
- Table 68: Rest of Middle East and Africa Aloe Vera Products Industry Revenue (Million) Forecast, by Application 2019 & 2032
Frequently Asked Questions
1. What is the projected Compound Annual Growth Rate (CAGR) of the Aloe Vera Products Industry?
The projected CAGR is approximately 10.90%.
2. Which companies are prominent players in the Aloe Vera Products Industry?
Key companies in the market include Grace Foods, Tory's Choice Inc, OKF, Alterfood, Okyalo, Houssy Global, Veganic*List Not Exhaustive, Forever Living Products, Simplee Aloe.
3. What are the main segments of the Aloe Vera Products Industry?
The market segments include Product Type, Distribution Channel.
4. Can you provide details about the market size?
The market size is estimated to be USD 155.16 Million as of 2022.
5. What are some drivers contributing to market growth?
Increasing Consumer Awareness Regarding Natural Products; Growing Demand for Anthocyanin in Pharmaceutical Industry.
6. What are the notable trends driving market growth?
Aloe Vera based Juices to Witness Higher Growth.
7. Are there any restraints impacting market growth?
Easy Availability of Synthetic Food Colorant.
8. Can you provide examples of recent developments in the market?
September 2022: 1NE Beverages, a seasoning and beverage brand under the subsidiary of US-based Livinia Foods, launched aloe vera juices available in a range of flavors in India. The company claims the product has antioxidant properties and multiple health benefits ranging from skin, oral, dental, or digestive health.
9. What pricing options are available for accessing the report?
Pricing options include single-user, multi-user, and enterprise licenses priced at USD 4750, USD 5250, and USD 8750 respectively.
10. Is the market size provided in terms of value or volume?
The market size is provided in terms of value, measured in Million.
11. Are there any specific market keywords associated with the report?
Yes, the market keyword associated with the report is "Aloe Vera Products Industry," which aids in identifying and referencing the specific market segment covered.
12. How do I determine which pricing option suits my needs best?
The pricing options vary based on user requirements and access needs. Individual users may opt for single-user licenses, while businesses requiring broader access may choose multi-user or enterprise licenses for cost-effective access to the report.
13. Are there any additional resources or data provided in the Aloe Vera Products Industry report?
While the report offers comprehensive insights, it's advisable to review the specific contents or supplementary materials provided to ascertain if additional resources or data are available.
14. How can I stay updated on further developments or reports in the Aloe Vera Products Industry?
To stay informed about further developments, trends, and reports in the Aloe Vera Products Industry, consider subscribing to industry newsletters, following relevant companies and organizations, or regularly checking reputable industry news sources and publications.
Methodology
Step 1 - Identification of Relevant Samples Size from Population Database


Step 2 - Approaches for Defining Global Market Size (Value, Volume* & Price*)

Note*: In applicable scenarios
Step 3 - Data Sources
Primary Research
- Web Analytics
- Survey Reports
- Research Institute
- Latest Research Reports
- Opinion Leaders
Secondary Research
- Annual Reports
- White Paper
- Latest Press Release
- Industry Association
- Paid Database
- Investor Presentations

Step 4 - Data Triangulation
Involves using different sources of information in order to increase the validity of a study
These sources are likely to be stakeholders in a program - participants, other researchers, program staff, other community members, and so on.
Then we put all data in single framework & apply various statistical tools to find out the dynamic on the market.
During the analysis stage, feedback from the stakeholder groups would be compared to determine areas of agreement as well as areas of divergence


