
Key Insights
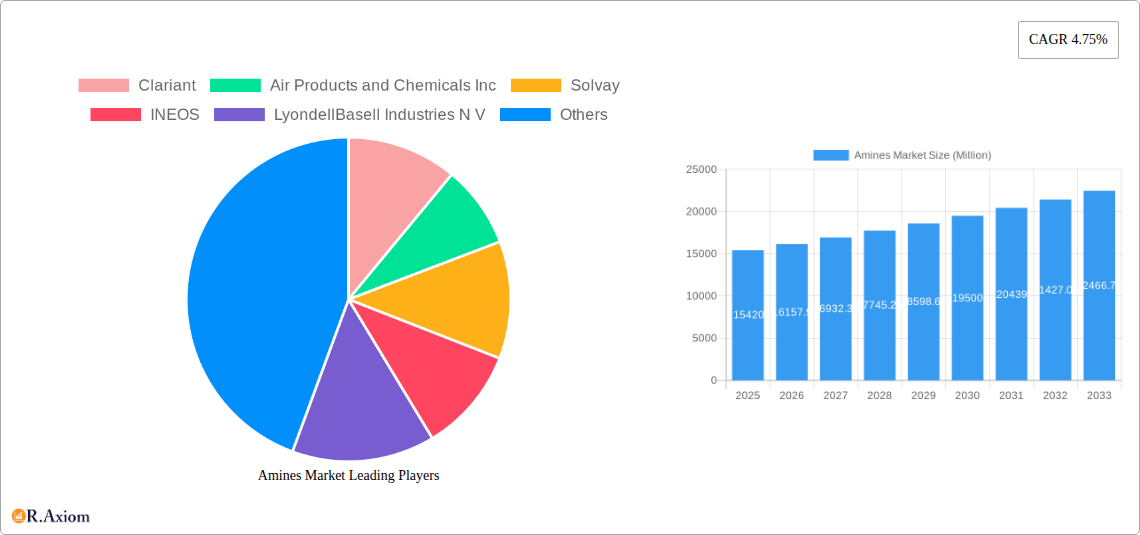
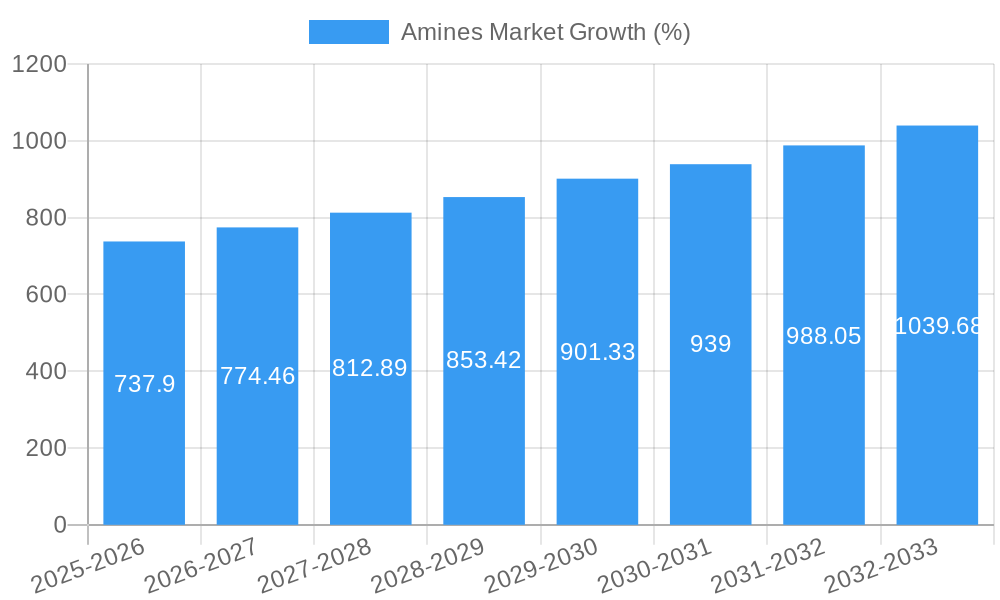
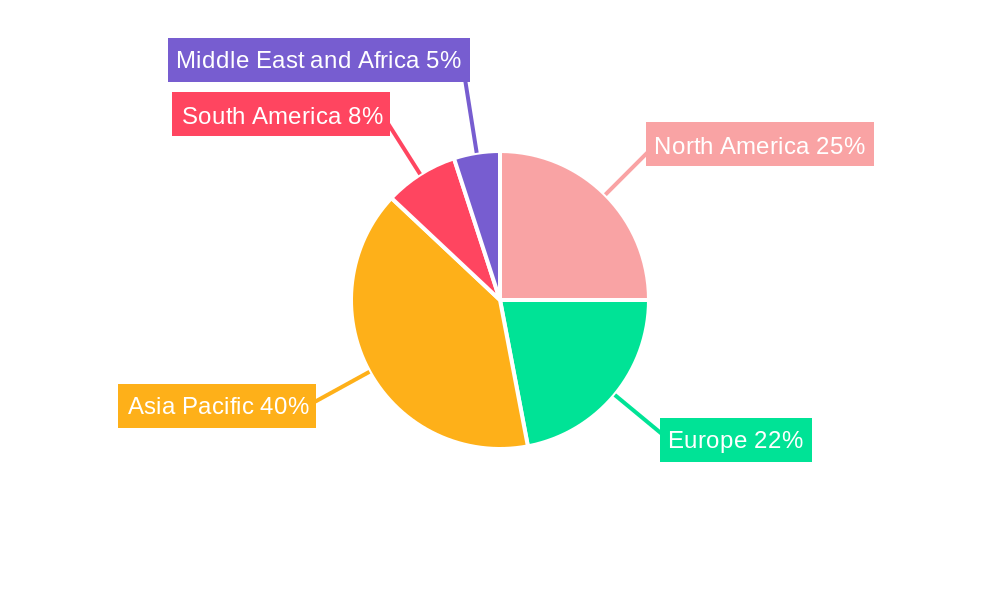
The global amines market, valued at $15.42 billion in 2025, is projected to experience robust growth, driven by a compound annual growth rate (CAGR) of 4.75% from 2025 to 2033. This expansion is fueled by increasing demand across diverse end-use sectors. The personal care industry's reliance on amines for surfactants and emulsifiers, coupled with the burgeoning cleaning product sector's need for effective detergents, significantly contributes to market growth. Furthermore, the robust growth of the rubber and adhesives industries, both heavily reliant on amine-based chemicals for processing and performance enhancement, further bolsters market expansion. Technological advancements leading to the development of more efficient and sustainable amine production processes are also contributing factors. The Asia-Pacific region, particularly China and India, are expected to lead market growth due to expanding industrialization and increasing consumer demand.
Significant market segmentation exists across both amine types and end-use applications. Ethyleneamines, alkylamines, and ethanolamines are major segments, each catering to specific industrial needs. Within end-use applications, rubber, personal care products, and cleaning products represent significant revenue streams. However, growth potential also exists in emerging areas such as agrochemicals and oil & petrochemicals, where amines are increasingly utilized for specialized applications. While challenges such as stringent environmental regulations and fluctuations in raw material prices may present headwinds, the overall market outlook remains positive, indicating considerable opportunities for established players and new entrants alike. The competitive landscape is marked by the presence of both large multinational corporations and specialized chemical manufacturers, each vying for market share through innovation and strategic partnerships.
Amines Market: A Comprehensive Report (2019-2033)
This detailed report provides a comprehensive analysis of the global amines market, offering invaluable insights for industry stakeholders, investors, and strategic decision-makers. The study covers the historical period (2019-2024), the base year (2025), and forecasts the market's trajectory up to 2033. The report employs rigorous methodologies and incorporates extensive primary and secondary research to deliver a nuanced understanding of market dynamics. Expect detailed segmentation by type (Ethyleneamines, Alkylamines, Fatty Amines, Specialty Amines, Ethanolamines) and end-use (Rubber, Personal Care products, Cleaning Products, Adhesives, Paints, and Resins, Agro Chemicals, Oil and Petrochemical, Other End-uses), coupled with growth projections and competitive landscape analysis. The report's value lies in its ability to identify emerging opportunities and potential challenges, empowering informed strategic planning.
Amines Market Concentration & Innovation
The amines market exhibits a moderately concentrated structure, with several multinational corporations holding significant market share. Key players like Clariant, Air Products and Chemicals Inc, Solvay, and BASF SE exert considerable influence through their established production capacities and extensive distribution networks. The market share of these leading companies is estimated at xx%, with the remaining xx% distributed among several regional and smaller players. Innovation within the amines market is driven by increasing demand for sustainable and high-performance products. This is reflected in recent investments in research and development, particularly focusing on bio-based amines and those with reduced environmental impact. Regulatory frameworks, particularly concerning environmental regulations and safety standards, influence both product development and market access. Product substitutes, such as alternative chemicals with similar functionality, pose a competitive threat, though the superior performance and established applications of amines often maintain their market dominance. End-user trends indicate a continued increase in demand across diverse sectors, including personal care, agriculture, and oil & gas. Mergers and acquisitions (M&A) activity within the amines sector has been moderate in recent years, with deal values totaling approximately xx Million in the period 2019-2024, primarily driven by efforts to expand market reach and enhance product portfolios.
- Market Concentration: Oligopolistic, with a few large players dominating.
- Innovation Drivers: Sustainability concerns, demand for high-performance products.
- Regulatory Landscape: Stringent environmental and safety standards.
- M&A Activity: Moderate, driven by expansion and portfolio diversification. Deal values totaled approximately xx Million (2019-2024).
Amines Market Industry Trends & Insights
The global amines market is poised for robust growth, exhibiting a projected Compound Annual Growth Rate (CAGR) of xx% during the forecast period (2025-2033). This growth is fueled by expanding end-use industries, particularly in developing economies. Technological advancements, such as improved production processes and the development of novel amine derivatives, are significantly contributing to increased efficiency and product diversification. Consumer preferences are increasingly shifting towards eco-friendly and sustainable products, demanding innovative amine solutions that minimize environmental impact. The competitive landscape is characterized by intense competition among established players and the emergence of new entrants, especially in niche segments. This rivalry drives innovation and competitive pricing, shaping market dynamics. Market penetration of bio-based amines is expected to increase gradually over the forecast period, driven by heightened environmental awareness and the need for sustainable alternatives. The Asia-Pacific region is expected to witness the highest growth rate, driven by factors like rising industrialization, increasing disposable income and government initiatives supporting chemical sector expansion. The market penetration of specialty amines is also expected to rise due to increasing demand in advanced applications.
Dominant Markets & Segments in Amines Market
The Asia-Pacific region dominates the global amines market, driven by rapid industrialization and expanding end-use industries. Within this region, China and India are key growth drivers. Among the various amine types, ethanolamines currently holds the largest market share due to its wide application across various sectors. However, specialty amines are projected to exhibit the highest growth rate due to their specific applications in emerging technologies. The dominant end-use segment is currently the oil and petrochemical industry, largely due to its use in processes like gas purification and enhanced oil recovery. However, substantial growth is anticipated in the personal care and cleaning products sector due to increasing consumer demand.
Key Drivers for Asia-Pacific Dominance:
- Rapid Industrialization
- Growing Infrastructure Development
- Increased Disposable Income
Dominant Segments:
- Type: Ethanolamines (Largest market share), Specialty Amines (Highest growth rate).
- End-use: Oil and Petrochemical (Largest market share), Personal Care & Cleaning Products (Highest growth rate).
Amines Market Product Developments
Recent product developments in the amines market are focused on sustainability and enhanced performance. Companies are investing heavily in bio-based amines and more environmentally friendly production processes, meeting stricter environmental regulations and consumer demand for greener alternatives. Innovations in amine chemistry are enabling the creation of specialized amines with superior properties, catering to specific applications in sectors like advanced materials and pharmaceuticals. This trend is driven by competitive pressures and the need to address evolving customer requirements, including enhanced performance characteristics, improved safety profiles, and reduced environmental footprint. The development of novel, specialized amines is expected to lead to increased market share in niche applications.
Report Scope & Segmentation Analysis
This report comprehensively segments the amines market by type and end-use. The type segment includes Ethyleneamines, Alkylamines, Fatty Amines, Specialty Amines, and Ethanolamines, each with its growth projections and market size. The end-use segment encompasses Rubber, Personal Care products, Cleaning Products, Adhesives, Paints, and Resins, Agro Chemicals, Oil and Petrochemical, and Other End-uses. Each segment is analyzed for its market size, growth rate, key players, and competitive dynamics. Market growth is influenced by factors like technological advancements, regulatory changes, and changing consumer preferences. Competitive analysis examines market share, strategies, and technological capabilities of key players.
Key Drivers of Amines Market Growth
The amines market is experiencing robust growth due to several key factors. Increasing industrialization across emerging economies, especially in Asia-Pacific, is driving demand in various end-use sectors. Technological advancements lead to the development of innovative amine-based products, expanding applications. Stringent environmental regulations, particularly those related to emissions and waste reduction, are pushing for the adoption of more efficient and environmentally friendly amine derivatives. Government policies supporting the chemical industry in several regions also contribute to market expansion. The growing demand from industries like personal care and agriculture also fuels the market growth.
Challenges in the Amines Market Sector
The amines market faces challenges including volatile raw material prices, which can significantly impact production costs and profitability. Stringent environmental regulations and safety standards increase compliance costs and can limit the production of certain amine types. Intense competition among established players and the emergence of new entrants create pressure on pricing and margins. Supply chain disruptions, particularly related to raw material sourcing and transportation, can affect production and delivery schedules. Fluctuations in global energy prices are another major concern. The cumulative effect of these challenges could impede market growth, reducing the profitability.
Emerging Opportunities in Amines Market
The amines market presents significant opportunities in the development and adoption of bio-based amines, catering to increasing demand for sustainable chemicals. Emerging applications in advanced materials, pharmaceuticals, and electronics offer substantial growth potential. Expanding into new geographic markets, particularly in developing economies, can unlock significant revenue streams. Innovation in production technologies, aimed at enhancing efficiency and reducing environmental impact, opens up new avenues for market expansion. Collaborations and strategic alliances can assist in accessing new technologies, raw materials, and markets. The demand for high-performance and specialty amines is also offering great opportunities to the market.
Leading Players in the Amines Market Market
- Clariant
- Air Products and Chemicals Inc
- Solvay
- INEOS
- LyondellBasell Industries N V
- Celanese Corporation
- Alkyl Amines Chemicals Limited
- INVISTA
- Kemipex
- BASF SE
- Arkema Group
- Huntsman International LLC
- SABIC
- Akzo Nobel N V
- Daicel Corporation
- Mitsubishi Gas Chemical Company Inc
- DowDuPont
- Tosoh Corporation
- *List Not Exhaustive
Key Developments in Amines Market Industry
- July 2022: LyondellBasell announced the expansion of its amine plant in China to meet growing demand for amines in the Asia-Pacific region. This expansion significantly boosts the company's production capacity and strengthens its market position in the region.
- March 2023: Solvay launched a new range of sustainable amine products designed to reduce environmental impact during manufacturing. This initiative positions Solvay as a leader in the environmentally conscious amines market and supports the growing demand for sustainable chemical solutions.
Strategic Outlook for Amines Market Market
The future of the amines market appears bright, driven by continued growth in key end-use sectors, ongoing technological advancements, and the increasing adoption of sustainable practices. Opportunities abound in developing regions and emerging applications. Companies that effectively adapt to evolving regulatory landscapes, prioritize sustainability initiatives, and invest in research and development will be best positioned to capture market share and drive growth in the years to come. The focus on sustainable amines will be a defining factor for future market success.
Amines Market Segmentation
-
1. Type
- 1.1. Ethyleneamines
- 1.2. Alkylamines
- 1.3. Fatty Amines
- 1.4. Specialty Amines
- 1.5. Ethanolamines
-
2. End-use
- 2.1. Rubber
- 2.2. Personal Care products
- 2.3. Cleaning Products
- 2.4. Adhesives, Paints, and Resins
- 2.5. Agro Chemicals
- 2.6. Oil and Petrochemical
- 2.7. Other End-uses
Amines Market Segmentation By Geography
-
1. Asia Pacific
- 1.1. China
- 1.2. India
- 1.3. Japan
- 1.4. South Korea
- 1.5. Australia and New Zealand
- 1.6. Rest of Asia Pacific
-
2. North America
- 2.1. United States
- 2.2. Canada
- 2.3. Mexico
-
3. Europe
- 3.1. Germany
- 3.2. United Kingdom
- 3.3. Italy
- 3.4. France
- 3.5. Rest of Europe
-
4. South America
- 4.1. Brazil
- 4.2. Argentina
- 4.3. Rest of South America
-
5. Middle East and Africa
- 5.1. Saudi Arabia
- 5.2. South Africa
- 5.3. Rest of Middle East and Africa
Amines Market REPORT HIGHLIGHTS
| Aspects | Details |
|---|---|
| Study Period | 2019-2033 |
| Base Year | 2024 |
| Estimated Year | 2025 |
| Forecast Period | 2025-2033 |
| Historical Period | 2019-2024 |
| Growth Rate | CAGR of 4.75% from 2019-2033 |
| Segmentation |
|
Table of Contents
- 1. Introduction
- 1.1. Research Scope
- 1.2. Market Segmentation
- 1.3. Research Methodology
- 1.4. Definitions and Assumptions
- 2. Executive Summary
- 2.1. Introduction
- 3. Market Dynamics
- 3.1. Introduction
- 3.2. Market Drivers
- 3.2.1. ; Growing Demand for Personal Care Products from Asia-Pacific; Accelerating Demand for Pesticides from Developing Countries; Increasing Demand and Usage in Construction Sector
- 3.3. Market Restrains
- 3.3.1. ; Rising Consumption of Wood-free Products; Increasing Usage of Bio-Based Products for Agriculture in Developed Countries
- 3.4. Market Trends
- 3.4.1. Increasing Demand form Pharmaceutical Industry
- 4. Market Factor Analysis
- 4.1. Porters Five Forces
- 4.2. Supply/Value Chain
- 4.3. PESTEL analysis
- 4.4. Market Entropy
- 4.5. Patent/Trademark Analysis
- 5. Global Amines Market Analysis, Insights and Forecast, 2019-2031
- 5.1. Market Analysis, Insights and Forecast - by Type
- 5.1.1. Ethyleneamines
- 5.1.2. Alkylamines
- 5.1.3. Fatty Amines
- 5.1.4. Specialty Amines
- 5.1.5. Ethanolamines
- 5.2. Market Analysis, Insights and Forecast - by End-use
- 5.2.1. Rubber
- 5.2.2. Personal Care products
- 5.2.3. Cleaning Products
- 5.2.4. Adhesives, Paints, and Resins
- 5.2.5. Agro Chemicals
- 5.2.6. Oil and Petrochemical
- 5.2.7. Other End-uses
- 5.3. Market Analysis, Insights and Forecast - by Region
- 5.3.1. Asia Pacific
- 5.3.2. North America
- 5.3.3. Europe
- 5.3.4. South America
- 5.3.5. Middle East and Africa
- 5.1. Market Analysis, Insights and Forecast - by Type
- 6. Asia Pacific Amines Market Analysis, Insights and Forecast, 2019-2031
- 6.1. Market Analysis, Insights and Forecast - by Type
- 6.1.1. Ethyleneamines
- 6.1.2. Alkylamines
- 6.1.3. Fatty Amines
- 6.1.4. Specialty Amines
- 6.1.5. Ethanolamines
- 6.2. Market Analysis, Insights and Forecast - by End-use
- 6.2.1. Rubber
- 6.2.2. Personal Care products
- 6.2.3. Cleaning Products
- 6.2.4. Adhesives, Paints, and Resins
- 6.2.5. Agro Chemicals
- 6.2.6. Oil and Petrochemical
- 6.2.7. Other End-uses
- 6.1. Market Analysis, Insights and Forecast - by Type
- 7. North America Amines Market Analysis, Insights and Forecast, 2019-2031
- 7.1. Market Analysis, Insights and Forecast - by Type
- 7.1.1. Ethyleneamines
- 7.1.2. Alkylamines
- 7.1.3. Fatty Amines
- 7.1.4. Specialty Amines
- 7.1.5. Ethanolamines
- 7.2. Market Analysis, Insights and Forecast - by End-use
- 7.2.1. Rubber
- 7.2.2. Personal Care products
- 7.2.3. Cleaning Products
- 7.2.4. Adhesives, Paints, and Resins
- 7.2.5. Agro Chemicals
- 7.2.6. Oil and Petrochemical
- 7.2.7. Other End-uses
- 7.1. Market Analysis, Insights and Forecast - by Type
- 8. Europe Amines Market Analysis, Insights and Forecast, 2019-2031
- 8.1. Market Analysis, Insights and Forecast - by Type
- 8.1.1. Ethyleneamines
- 8.1.2. Alkylamines
- 8.1.3. Fatty Amines
- 8.1.4. Specialty Amines
- 8.1.5. Ethanolamines
- 8.2. Market Analysis, Insights and Forecast - by End-use
- 8.2.1. Rubber
- 8.2.2. Personal Care products
- 8.2.3. Cleaning Products
- 8.2.4. Adhesives, Paints, and Resins
- 8.2.5. Agro Chemicals
- 8.2.6. Oil and Petrochemical
- 8.2.7. Other End-uses
- 8.1. Market Analysis, Insights and Forecast - by Type
- 9. South America Amines Market Analysis, Insights and Forecast, 2019-2031
- 9.1. Market Analysis, Insights and Forecast - by Type
- 9.1.1. Ethyleneamines
- 9.1.2. Alkylamines
- 9.1.3. Fatty Amines
- 9.1.4. Specialty Amines
- 9.1.5. Ethanolamines
- 9.2. Market Analysis, Insights and Forecast - by End-use
- 9.2.1. Rubber
- 9.2.2. Personal Care products
- 9.2.3. Cleaning Products
- 9.2.4. Adhesives, Paints, and Resins
- 9.2.5. Agro Chemicals
- 9.2.6. Oil and Petrochemical
- 9.2.7. Other End-uses
- 9.1. Market Analysis, Insights and Forecast - by Type
- 10. Middle East and Africa Amines Market Analysis, Insights and Forecast, 2019-2031
- 10.1. Market Analysis, Insights and Forecast - by Type
- 10.1.1. Ethyleneamines
- 10.1.2. Alkylamines
- 10.1.3. Fatty Amines
- 10.1.4. Specialty Amines
- 10.1.5. Ethanolamines
- 10.2. Market Analysis, Insights and Forecast - by End-use
- 10.2.1. Rubber
- 10.2.2. Personal Care products
- 10.2.3. Cleaning Products
- 10.2.4. Adhesives, Paints, and Resins
- 10.2.5. Agro Chemicals
- 10.2.6. Oil and Petrochemical
- 10.2.7. Other End-uses
- 10.1. Market Analysis, Insights and Forecast - by Type
- 11. Asia Pacific Amines Market Analysis, Insights and Forecast, 2019-2031
- 11.1. Market Analysis, Insights and Forecast - By Country/Sub-region
- 11.1.1 China
- 11.1.2 India
- 11.1.3 Japan
- 11.1.4 South Korea
- 11.1.5 Australia and New Zealand
- 11.1.6 Rest of Asia Pacific
- 12. North America Amines Market Analysis, Insights and Forecast, 2019-2031
- 12.1. Market Analysis, Insights and Forecast - By Country/Sub-region
- 12.1.1 United States
- 12.1.2 Canada
- 12.1.3 Mexico
- 13. Europe Amines Market Analysis, Insights and Forecast, 2019-2031
- 13.1. Market Analysis, Insights and Forecast - By Country/Sub-region
- 13.1.1 Germany
- 13.1.2 United Kingdom
- 13.1.3 Italy
- 13.1.4 France
- 13.1.5 Rest of Europe
- 14. South America Amines Market Analysis, Insights and Forecast, 2019-2031
- 14.1. Market Analysis, Insights and Forecast - By Country/Sub-region
- 14.1.1 Brazil
- 14.1.2 Argentina
- 14.1.3 Rest of South America
- 15. Middle East and Africa Amines Market Analysis, Insights and Forecast, 2019-2031
- 15.1. Market Analysis, Insights and Forecast - By Country/Sub-region
- 15.1.1 Saudi Arabia
- 15.1.2 South Africa
- 15.1.3 Rest of Middle East and Africa
- 16. Competitive Analysis
- 16.1. Global Market Share Analysis 2024
- 16.2. Company Profiles
- 16.2.1 Clariant
- 16.2.1.1. Overview
- 16.2.1.2. Products
- 16.2.1.3. SWOT Analysis
- 16.2.1.4. Recent Developments
- 16.2.1.5. Financials (Based on Availability)
- 16.2.2 Air Products and Chemicals Inc
- 16.2.2.1. Overview
- 16.2.2.2. Products
- 16.2.2.3. SWOT Analysis
- 16.2.2.4. Recent Developments
- 16.2.2.5. Financials (Based on Availability)
- 16.2.3 Solvay
- 16.2.3.1. Overview
- 16.2.3.2. Products
- 16.2.3.3. SWOT Analysis
- 16.2.3.4. Recent Developments
- 16.2.3.5. Financials (Based on Availability)
- 16.2.4 INEOS
- 16.2.4.1. Overview
- 16.2.4.2. Products
- 16.2.4.3. SWOT Analysis
- 16.2.4.4. Recent Developments
- 16.2.4.5. Financials (Based on Availability)
- 16.2.5 LyondellBasell Industries N V
- 16.2.5.1. Overview
- 16.2.5.2. Products
- 16.2.5.3. SWOT Analysis
- 16.2.5.4. Recent Developments
- 16.2.5.5. Financials (Based on Availability)
- 16.2.6 Celanese Corporation
- 16.2.6.1. Overview
- 16.2.6.2. Products
- 16.2.6.3. SWOT Analysis
- 16.2.6.4. Recent Developments
- 16.2.6.5. Financials (Based on Availability)
- 16.2.7 Alkyl Amines Chemicals Limited
- 16.2.7.1. Overview
- 16.2.7.2. Products
- 16.2.7.3. SWOT Analysis
- 16.2.7.4. Recent Developments
- 16.2.7.5. Financials (Based on Availability)
- 16.2.8 INVISTA
- 16.2.8.1. Overview
- 16.2.8.2. Products
- 16.2.8.3. SWOT Analysis
- 16.2.8.4. Recent Developments
- 16.2.8.5. Financials (Based on Availability)
- 16.2.9 Kemipex
- 16.2.9.1. Overview
- 16.2.9.2. Products
- 16.2.9.3. SWOT Analysis
- 16.2.9.4. Recent Developments
- 16.2.9.5. Financials (Based on Availability)
- 16.2.10 BASF SE
- 16.2.10.1. Overview
- 16.2.10.2. Products
- 16.2.10.3. SWOT Analysis
- 16.2.10.4. Recent Developments
- 16.2.10.5. Financials (Based on Availability)
- 16.2.11 Arkema Group
- 16.2.11.1. Overview
- 16.2.11.2. Products
- 16.2.11.3. SWOT Analysis
- 16.2.11.4. Recent Developments
- 16.2.11.5. Financials (Based on Availability)
- 16.2.12 Huntsman International LLC
- 16.2.12.1. Overview
- 16.2.12.2. Products
- 16.2.12.3. SWOT Analysis
- 16.2.12.4. Recent Developments
- 16.2.12.5. Financials (Based on Availability)
- 16.2.13 SABIC
- 16.2.13.1. Overview
- 16.2.13.2. Products
- 16.2.13.3. SWOT Analysis
- 16.2.13.4. Recent Developments
- 16.2.13.5. Financials (Based on Availability)
- 16.2.14 Akzo Nobel N V
- 16.2.14.1. Overview
- 16.2.14.2. Products
- 16.2.14.3. SWOT Analysis
- 16.2.14.4. Recent Developments
- 16.2.14.5. Financials (Based on Availability)
- 16.2.15 Daicel Corporation
- 16.2.15.1. Overview
- 16.2.15.2. Products
- 16.2.15.3. SWOT Analysis
- 16.2.15.4. Recent Developments
- 16.2.15.5. Financials (Based on Availability)
- 16.2.16 Mitsubishi Gas Chemical Company Inc
- 16.2.16.1. Overview
- 16.2.16.2. Products
- 16.2.16.3. SWOT Analysis
- 16.2.16.4. Recent Developments
- 16.2.16.5. Financials (Based on Availability)
- 16.2.17 DowDuPont
- 16.2.17.1. Overview
- 16.2.17.2. Products
- 16.2.17.3. SWOT Analysis
- 16.2.17.4. Recent Developments
- 16.2.17.5. Financials (Based on Availability)
- 16.2.18 Tosoh Corporation*List Not Exhaustive
- 16.2.18.1. Overview
- 16.2.18.2. Products
- 16.2.18.3. SWOT Analysis
- 16.2.18.4. Recent Developments
- 16.2.18.5. Financials (Based on Availability)
- 16.2.1 Clariant
List of Figures
- Figure 1: Global Amines Market Revenue Breakdown (Million, %) by Region 2024 & 2032
- Figure 2: Global Amines Market Volume Breakdown (K Tons, %) by Region 2024 & 2032
- Figure 3: Asia Pacific Amines Market Revenue (Million), by Country 2024 & 2032
- Figure 4: Asia Pacific Amines Market Volume (K Tons), by Country 2024 & 2032
- Figure 5: Asia Pacific Amines Market Revenue Share (%), by Country 2024 & 2032
- Figure 6: Asia Pacific Amines Market Volume Share (%), by Country 2024 & 2032
- Figure 7: North America Amines Market Revenue (Million), by Country 2024 & 2032
- Figure 8: North America Amines Market Volume (K Tons), by Country 2024 & 2032
- Figure 9: North America Amines Market Revenue Share (%), by Country 2024 & 2032
- Figure 10: North America Amines Market Volume Share (%), by Country 2024 & 2032
- Figure 11: Europe Amines Market Revenue (Million), by Country 2024 & 2032
- Figure 12: Europe Amines Market Volume (K Tons), by Country 2024 & 2032
- Figure 13: Europe Amines Market Revenue Share (%), by Country 2024 & 2032
- Figure 14: Europe Amines Market Volume Share (%), by Country 2024 & 2032
- Figure 15: South America Amines Market Revenue (Million), by Country 2024 & 2032
- Figure 16: South America Amines Market Volume (K Tons), by Country 2024 & 2032
- Figure 17: South America Amines Market Revenue Share (%), by Country 2024 & 2032
- Figure 18: South America Amines Market Volume Share (%), by Country 2024 & 2032
- Figure 19: Middle East and Africa Amines Market Revenue (Million), by Country 2024 & 2032
- Figure 20: Middle East and Africa Amines Market Volume (K Tons), by Country 2024 & 2032
- Figure 21: Middle East and Africa Amines Market Revenue Share (%), by Country 2024 & 2032
- Figure 22: Middle East and Africa Amines Market Volume Share (%), by Country 2024 & 2032
- Figure 23: Asia Pacific Amines Market Revenue (Million), by Type 2024 & 2032
- Figure 24: Asia Pacific Amines Market Volume (K Tons), by Type 2024 & 2032
- Figure 25: Asia Pacific Amines Market Revenue Share (%), by Type 2024 & 2032
- Figure 26: Asia Pacific Amines Market Volume Share (%), by Type 2024 & 2032
- Figure 27: Asia Pacific Amines Market Revenue (Million), by End-use 2024 & 2032
- Figure 28: Asia Pacific Amines Market Volume (K Tons), by End-use 2024 & 2032
- Figure 29: Asia Pacific Amines Market Revenue Share (%), by End-use 2024 & 2032
- Figure 30: Asia Pacific Amines Market Volume Share (%), by End-use 2024 & 2032
- Figure 31: Asia Pacific Amines Market Revenue (Million), by Country 2024 & 2032
- Figure 32: Asia Pacific Amines Market Volume (K Tons), by Country 2024 & 2032
- Figure 33: Asia Pacific Amines Market Revenue Share (%), by Country 2024 & 2032
- Figure 34: Asia Pacific Amines Market Volume Share (%), by Country 2024 & 2032
- Figure 35: North America Amines Market Revenue (Million), by Type 2024 & 2032
- Figure 36: North America Amines Market Volume (K Tons), by Type 2024 & 2032
- Figure 37: North America Amines Market Revenue Share (%), by Type 2024 & 2032
- Figure 38: North America Amines Market Volume Share (%), by Type 2024 & 2032
- Figure 39: North America Amines Market Revenue (Million), by End-use 2024 & 2032
- Figure 40: North America Amines Market Volume (K Tons), by End-use 2024 & 2032
- Figure 41: North America Amines Market Revenue Share (%), by End-use 2024 & 2032
- Figure 42: North America Amines Market Volume Share (%), by End-use 2024 & 2032
- Figure 43: North America Amines Market Revenue (Million), by Country 2024 & 2032
- Figure 44: North America Amines Market Volume (K Tons), by Country 2024 & 2032
- Figure 45: North America Amines Market Revenue Share (%), by Country 2024 & 2032
- Figure 46: North America Amines Market Volume Share (%), by Country 2024 & 2032
- Figure 47: Europe Amines Market Revenue (Million), by Type 2024 & 2032
- Figure 48: Europe Amines Market Volume (K Tons), by Type 2024 & 2032
- Figure 49: Europe Amines Market Revenue Share (%), by Type 2024 & 2032
- Figure 50: Europe Amines Market Volume Share (%), by Type 2024 & 2032
- Figure 51: Europe Amines Market Revenue (Million), by End-use 2024 & 2032
- Figure 52: Europe Amines Market Volume (K Tons), by End-use 2024 & 2032
- Figure 53: Europe Amines Market Revenue Share (%), by End-use 2024 & 2032
- Figure 54: Europe Amines Market Volume Share (%), by End-use 2024 & 2032
- Figure 55: Europe Amines Market Revenue (Million), by Country 2024 & 2032
- Figure 56: Europe Amines Market Volume (K Tons), by Country 2024 & 2032
- Figure 57: Europe Amines Market Revenue Share (%), by Country 2024 & 2032
- Figure 58: Europe Amines Market Volume Share (%), by Country 2024 & 2032
- Figure 59: South America Amines Market Revenue (Million), by Type 2024 & 2032
- Figure 60: South America Amines Market Volume (K Tons), by Type 2024 & 2032
- Figure 61: South America Amines Market Revenue Share (%), by Type 2024 & 2032
- Figure 62: South America Amines Market Volume Share (%), by Type 2024 & 2032
- Figure 63: South America Amines Market Revenue (Million), by End-use 2024 & 2032
- Figure 64: South America Amines Market Volume (K Tons), by End-use 2024 & 2032
- Figure 65: South America Amines Market Revenue Share (%), by End-use 2024 & 2032
- Figure 66: South America Amines Market Volume Share (%), by End-use 2024 & 2032
- Figure 67: South America Amines Market Revenue (Million), by Country 2024 & 2032
- Figure 68: South America Amines Market Volume (K Tons), by Country 2024 & 2032
- Figure 69: South America Amines Market Revenue Share (%), by Country 2024 & 2032
- Figure 70: South America Amines Market Volume Share (%), by Country 2024 & 2032
- Figure 71: Middle East and Africa Amines Market Revenue (Million), by Type 2024 & 2032
- Figure 72: Middle East and Africa Amines Market Volume (K Tons), by Type 2024 & 2032
- Figure 73: Middle East and Africa Amines Market Revenue Share (%), by Type 2024 & 2032
- Figure 74: Middle East and Africa Amines Market Volume Share (%), by Type 2024 & 2032
- Figure 75: Middle East and Africa Amines Market Revenue (Million), by End-use 2024 & 2032
- Figure 76: Middle East and Africa Amines Market Volume (K Tons), by End-use 2024 & 2032
- Figure 77: Middle East and Africa Amines Market Revenue Share (%), by End-use 2024 & 2032
- Figure 78: Middle East and Africa Amines Market Volume Share (%), by End-use 2024 & 2032
- Figure 79: Middle East and Africa Amines Market Revenue (Million), by Country 2024 & 2032
- Figure 80: Middle East and Africa Amines Market Volume (K Tons), by Country 2024 & 2032
- Figure 81: Middle East and Africa Amines Market Revenue Share (%), by Country 2024 & 2032
- Figure 82: Middle East and Africa Amines Market Volume Share (%), by Country 2024 & 2032
List of Tables
- Table 1: Global Amines Market Revenue Million Forecast, by Region 2019 & 2032
- Table 2: Global Amines Market Volume K Tons Forecast, by Region 2019 & 2032
- Table 3: Global Amines Market Revenue Million Forecast, by Type 2019 & 2032
- Table 4: Global Amines Market Volume K Tons Forecast, by Type 2019 & 2032
- Table 5: Global Amines Market Revenue Million Forecast, by End-use 2019 & 2032
- Table 6: Global Amines Market Volume K Tons Forecast, by End-use 2019 & 2032
- Table 7: Global Amines Market Revenue Million Forecast, by Region 2019 & 2032
- Table 8: Global Amines Market Volume K Tons Forecast, by Region 2019 & 2032
- Table 9: Global Amines Market Revenue Million Forecast, by Country 2019 & 2032
- Table 10: Global Amines Market Volume K Tons Forecast, by Country 2019 & 2032
- Table 11: China Amines Market Revenue (Million) Forecast, by Application 2019 & 2032
- Table 12: China Amines Market Volume (K Tons) Forecast, by Application 2019 & 2032
- Table 13: India Amines Market Revenue (Million) Forecast, by Application 2019 & 2032
- Table 14: India Amines Market Volume (K Tons) Forecast, by Application 2019 & 2032
- Table 15: Japan Amines Market Revenue (Million) Forecast, by Application 2019 & 2032
- Table 16: Japan Amines Market Volume (K Tons) Forecast, by Application 2019 & 2032
- Table 17: South Korea Amines Market Revenue (Million) Forecast, by Application 2019 & 2032
- Table 18: South Korea Amines Market Volume (K Tons) Forecast, by Application 2019 & 2032
- Table 19: Australia and New Zealand Amines Market Revenue (Million) Forecast, by Application 2019 & 2032
- Table 20: Australia and New Zealand Amines Market Volume (K Tons) Forecast, by Application 2019 & 2032
- Table 21: Rest of Asia Pacific Amines Market Revenue (Million) Forecast, by Application 2019 & 2032
- Table 22: Rest of Asia Pacific Amines Market Volume (K Tons) Forecast, by Application 2019 & 2032
- Table 23: Global Amines Market Revenue Million Forecast, by Country 2019 & 2032
- Table 24: Global Amines Market Volume K Tons Forecast, by Country 2019 & 2032
- Table 25: United States Amines Market Revenue (Million) Forecast, by Application 2019 & 2032
- Table 26: United States Amines Market Volume (K Tons) Forecast, by Application 2019 & 2032
- Table 27: Canada Amines Market Revenue (Million) Forecast, by Application 2019 & 2032
- Table 28: Canada Amines Market Volume (K Tons) Forecast, by Application 2019 & 2032
- Table 29: Mexico Amines Market Revenue (Million) Forecast, by Application 2019 & 2032
- Table 30: Mexico Amines Market Volume (K Tons) Forecast, by Application 2019 & 2032
- Table 31: Global Amines Market Revenue Million Forecast, by Country 2019 & 2032
- Table 32: Global Amines Market Volume K Tons Forecast, by Country 2019 & 2032
- Table 33: Germany Amines Market Revenue (Million) Forecast, by Application 2019 & 2032
- Table 34: Germany Amines Market Volume (K Tons) Forecast, by Application 2019 & 2032
- Table 35: United Kingdom Amines Market Revenue (Million) Forecast, by Application 2019 & 2032
- Table 36: United Kingdom Amines Market Volume (K Tons) Forecast, by Application 2019 & 2032
- Table 37: Italy Amines Market Revenue (Million) Forecast, by Application 2019 & 2032
- Table 38: Italy Amines Market Volume (K Tons) Forecast, by Application 2019 & 2032
- Table 39: France Amines Market Revenue (Million) Forecast, by Application 2019 & 2032
- Table 40: France Amines Market Volume (K Tons) Forecast, by Application 2019 & 2032
- Table 41: Rest of Europe Amines Market Revenue (Million) Forecast, by Application 2019 & 2032
- Table 42: Rest of Europe Amines Market Volume (K Tons) Forecast, by Application 2019 & 2032
- Table 43: Global Amines Market Revenue Million Forecast, by Country 2019 & 2032
- Table 44: Global Amines Market Volume K Tons Forecast, by Country 2019 & 2032
- Table 45: Brazil Amines Market Revenue (Million) Forecast, by Application 2019 & 2032
- Table 46: Brazil Amines Market Volume (K Tons) Forecast, by Application 2019 & 2032
- Table 47: Argentina Amines Market Revenue (Million) Forecast, by Application 2019 & 2032
- Table 48: Argentina Amines Market Volume (K Tons) Forecast, by Application 2019 & 2032
- Table 49: Rest of South America Amines Market Revenue (Million) Forecast, by Application 2019 & 2032
- Table 50: Rest of South America Amines Market Volume (K Tons) Forecast, by Application 2019 & 2032
- Table 51: Global Amines Market Revenue Million Forecast, by Country 2019 & 2032
- Table 52: Global Amines Market Volume K Tons Forecast, by Country 2019 & 2032
- Table 53: Saudi Arabia Amines Market Revenue (Million) Forecast, by Application 2019 & 2032
- Table 54: Saudi Arabia Amines Market Volume (K Tons) Forecast, by Application 2019 & 2032
- Table 55: South Africa Amines Market Revenue (Million) Forecast, by Application 2019 & 2032
- Table 56: South Africa Amines Market Volume (K Tons) Forecast, by Application 2019 & 2032
- Table 57: Rest of Middle East and Africa Amines Market Revenue (Million) Forecast, by Application 2019 & 2032
- Table 58: Rest of Middle East and Africa Amines Market Volume (K Tons) Forecast, by Application 2019 & 2032
- Table 59: Global Amines Market Revenue Million Forecast, by Type 2019 & 2032
- Table 60: Global Amines Market Volume K Tons Forecast, by Type 2019 & 2032
- Table 61: Global Amines Market Revenue Million Forecast, by End-use 2019 & 2032
- Table 62: Global Amines Market Volume K Tons Forecast, by End-use 2019 & 2032
- Table 63: Global Amines Market Revenue Million Forecast, by Country 2019 & 2032
- Table 64: Global Amines Market Volume K Tons Forecast, by Country 2019 & 2032
- Table 65: China Amines Market Revenue (Million) Forecast, by Application 2019 & 2032
- Table 66: China Amines Market Volume (K Tons) Forecast, by Application 2019 & 2032
- Table 67: India Amines Market Revenue (Million) Forecast, by Application 2019 & 2032
- Table 68: India Amines Market Volume (K Tons) Forecast, by Application 2019 & 2032
- Table 69: Japan Amines Market Revenue (Million) Forecast, by Application 2019 & 2032
- Table 70: Japan Amines Market Volume (K Tons) Forecast, by Application 2019 & 2032
- Table 71: South Korea Amines Market Revenue (Million) Forecast, by Application 2019 & 2032
- Table 72: South Korea Amines Market Volume (K Tons) Forecast, by Application 2019 & 2032
- Table 73: Australia and New Zealand Amines Market Revenue (Million) Forecast, by Application 2019 & 2032
- Table 74: Australia and New Zealand Amines Market Volume (K Tons) Forecast, by Application 2019 & 2032
- Table 75: Rest of Asia Pacific Amines Market Revenue (Million) Forecast, by Application 2019 & 2032
- Table 76: Rest of Asia Pacific Amines Market Volume (K Tons) Forecast, by Application 2019 & 2032
- Table 77: Global Amines Market Revenue Million Forecast, by Type 2019 & 2032
- Table 78: Global Amines Market Volume K Tons Forecast, by Type 2019 & 2032
- Table 79: Global Amines Market Revenue Million Forecast, by End-use 2019 & 2032
- Table 80: Global Amines Market Volume K Tons Forecast, by End-use 2019 & 2032
- Table 81: Global Amines Market Revenue Million Forecast, by Country 2019 & 2032
- Table 82: Global Amines Market Volume K Tons Forecast, by Country 2019 & 2032
- Table 83: United States Amines Market Revenue (Million) Forecast, by Application 2019 & 2032
- Table 84: United States Amines Market Volume (K Tons) Forecast, by Application 2019 & 2032
- Table 85: Canada Amines Market Revenue (Million) Forecast, by Application 2019 & 2032
- Table 86: Canada Amines Market Volume (K Tons) Forecast, by Application 2019 & 2032
- Table 87: Mexico Amines Market Revenue (Million) Forecast, by Application 2019 & 2032
- Table 88: Mexico Amines Market Volume (K Tons) Forecast, by Application 2019 & 2032
- Table 89: Global Amines Market Revenue Million Forecast, by Type 2019 & 2032
- Table 90: Global Amines Market Volume K Tons Forecast, by Type 2019 & 2032
- Table 91: Global Amines Market Revenue Million Forecast, by End-use 2019 & 2032
- Table 92: Global Amines Market Volume K Tons Forecast, by End-use 2019 & 2032
- Table 93: Global Amines Market Revenue Million Forecast, by Country 2019 & 2032
- Table 94: Global Amines Market Volume K Tons Forecast, by Country 2019 & 2032
- Table 95: Germany Amines Market Revenue (Million) Forecast, by Application 2019 & 2032
- Table 96: Germany Amines Market Volume (K Tons) Forecast, by Application 2019 & 2032
- Table 97: United Kingdom Amines Market Revenue (Million) Forecast, by Application 2019 & 2032
- Table 98: United Kingdom Amines Market Volume (K Tons) Forecast, by Application 2019 & 2032
- Table 99: Italy Amines Market Revenue (Million) Forecast, by Application 2019 & 2032
- Table 100: Italy Amines Market Volume (K Tons) Forecast, by Application 2019 & 2032
- Table 101: France Amines Market Revenue (Million) Forecast, by Application 2019 & 2032
- Table 102: France Amines Market Volume (K Tons) Forecast, by Application 2019 & 2032
- Table 103: Rest of Europe Amines Market Revenue (Million) Forecast, by Application 2019 & 2032
- Table 104: Rest of Europe Amines Market Volume (K Tons) Forecast, by Application 2019 & 2032
- Table 105: Global Amines Market Revenue Million Forecast, by Type 2019 & 2032
- Table 106: Global Amines Market Volume K Tons Forecast, by Type 2019 & 2032
- Table 107: Global Amines Market Revenue Million Forecast, by End-use 2019 & 2032
- Table 108: Global Amines Market Volume K Tons Forecast, by End-use 2019 & 2032
- Table 109: Global Amines Market Revenue Million Forecast, by Country 2019 & 2032
- Table 110: Global Amines Market Volume K Tons Forecast, by Country 2019 & 2032
- Table 111: Brazil Amines Market Revenue (Million) Forecast, by Application 2019 & 2032
- Table 112: Brazil Amines Market Volume (K Tons) Forecast, by Application 2019 & 2032
- Table 113: Argentina Amines Market Revenue (Million) Forecast, by Application 2019 & 2032
- Table 114: Argentina Amines Market Volume (K Tons) Forecast, by Application 2019 & 2032
- Table 115: Rest of South America Amines Market Revenue (Million) Forecast, by Application 2019 & 2032
- Table 116: Rest of South America Amines Market Volume (K Tons) Forecast, by Application 2019 & 2032
- Table 117: Global Amines Market Revenue Million Forecast, by Type 2019 & 2032
- Table 118: Global Amines Market Volume K Tons Forecast, by Type 2019 & 2032
- Table 119: Global Amines Market Revenue Million Forecast, by End-use 2019 & 2032
- Table 120: Global Amines Market Volume K Tons Forecast, by End-use 2019 & 2032
- Table 121: Global Amines Market Revenue Million Forecast, by Country 2019 & 2032
- Table 122: Global Amines Market Volume K Tons Forecast, by Country 2019 & 2032
- Table 123: Saudi Arabia Amines Market Revenue (Million) Forecast, by Application 2019 & 2032
- Table 124: Saudi Arabia Amines Market Volume (K Tons) Forecast, by Application 2019 & 2032
- Table 125: South Africa Amines Market Revenue (Million) Forecast, by Application 2019 & 2032
- Table 126: South Africa Amines Market Volume (K Tons) Forecast, by Application 2019 & 2032
- Table 127: Rest of Middle East and Africa Amines Market Revenue (Million) Forecast, by Application 2019 & 2032
- Table 128: Rest of Middle East and Africa Amines Market Volume (K Tons) Forecast, by Application 2019 & 2032
Frequently Asked Questions
1. What is the projected Compound Annual Growth Rate (CAGR) of the Amines Market?
The projected CAGR is approximately 4.75%.
2. Which companies are prominent players in the Amines Market?
Key companies in the market include Clariant, Air Products and Chemicals Inc, Solvay, INEOS, LyondellBasell Industries N V, Celanese Corporation, Alkyl Amines Chemicals Limited, INVISTA, Kemipex, BASF SE, Arkema Group, Huntsman International LLC, SABIC, Akzo Nobel N V, Daicel Corporation, Mitsubishi Gas Chemical Company Inc, DowDuPont, Tosoh Corporation*List Not Exhaustive.
3. What are the main segments of the Amines Market?
The market segments include Type, End-use.
4. Can you provide details about the market size?
The market size is estimated to be USD 15.42 Million as of 2022.
5. What are some drivers contributing to market growth?
; Growing Demand for Personal Care Products from Asia-Pacific; Accelerating Demand for Pesticides from Developing Countries; Increasing Demand and Usage in Construction Sector.
6. What are the notable trends driving market growth?
Increasing Demand form Pharmaceutical Industry.
7. Are there any restraints impacting market growth?
; Rising Consumption of Wood-free Products; Increasing Usage of Bio-Based Products for Agriculture in Developed Countries.
8. Can you provide examples of recent developments in the market?
In 2022, LyondellBasell announced the expansion of its amine plant in China to meet growing demand for amines in the Asia-Pacific region.
9. What pricing options are available for accessing the report?
Pricing options include single-user, multi-user, and enterprise licenses priced at USD 4750, USD 5250, and USD 8750 respectively.
10. Is the market size provided in terms of value or volume?
The market size is provided in terms of value, measured in Million and volume, measured in K Tons.
11. Are there any specific market keywords associated with the report?
Yes, the market keyword associated with the report is "Amines Market," which aids in identifying and referencing the specific market segment covered.
12. How do I determine which pricing option suits my needs best?
The pricing options vary based on user requirements and access needs. Individual users may opt for single-user licenses, while businesses requiring broader access may choose multi-user or enterprise licenses for cost-effective access to the report.
13. Are there any additional resources or data provided in the Amines Market report?
While the report offers comprehensive insights, it's advisable to review the specific contents or supplementary materials provided to ascertain if additional resources or data are available.
14. How can I stay updated on further developments or reports in the Amines Market?
To stay informed about further developments, trends, and reports in the Amines Market, consider subscribing to industry newsletters, following relevant companies and organizations, or regularly checking reputable industry news sources and publications.
Methodology
Step 1 - Identification of Relevant Samples Size from Population Database


Step 2 - Approaches for Defining Global Market Size (Value, Volume* & Price*)

Note*: In applicable scenarios
Step 3 - Data Sources
Primary Research
- Web Analytics
- Survey Reports
- Research Institute
- Latest Research Reports
- Opinion Leaders
Secondary Research
- Annual Reports
- White Paper
- Latest Press Release
- Industry Association
- Paid Database
- Investor Presentations

Step 4 - Data Triangulation
Involves using different sources of information in order to increase the validity of a study
These sources are likely to be stakeholders in a program - participants, other researchers, program staff, other community members, and so on.
Then we put all data in single framework & apply various statistical tools to find out the dynamic on the market.
During the analysis stage, feedback from the stakeholder groups would be compared to determine areas of agreement as well as areas of divergence


