
Key Insights
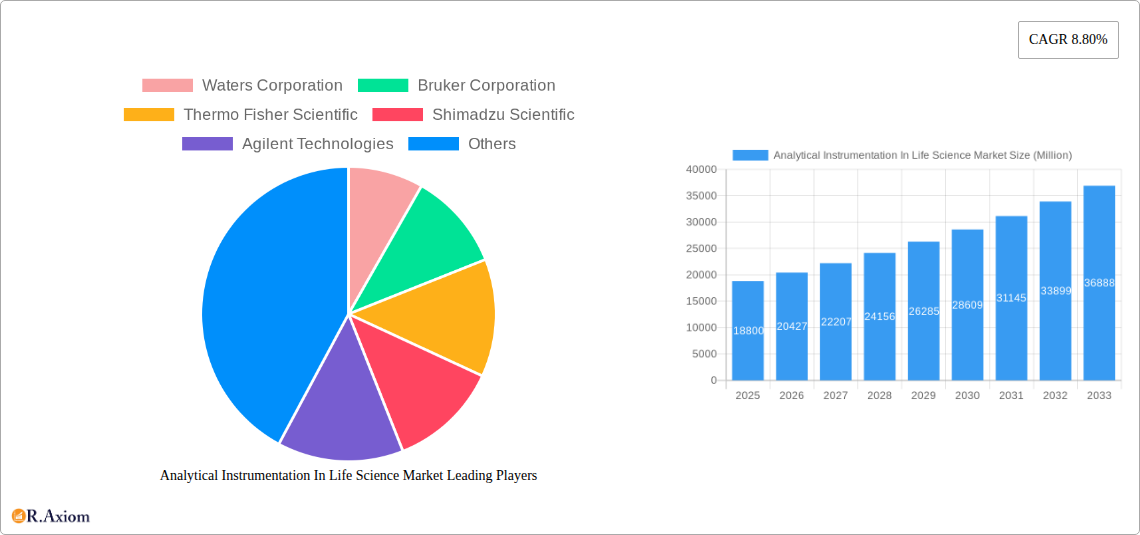
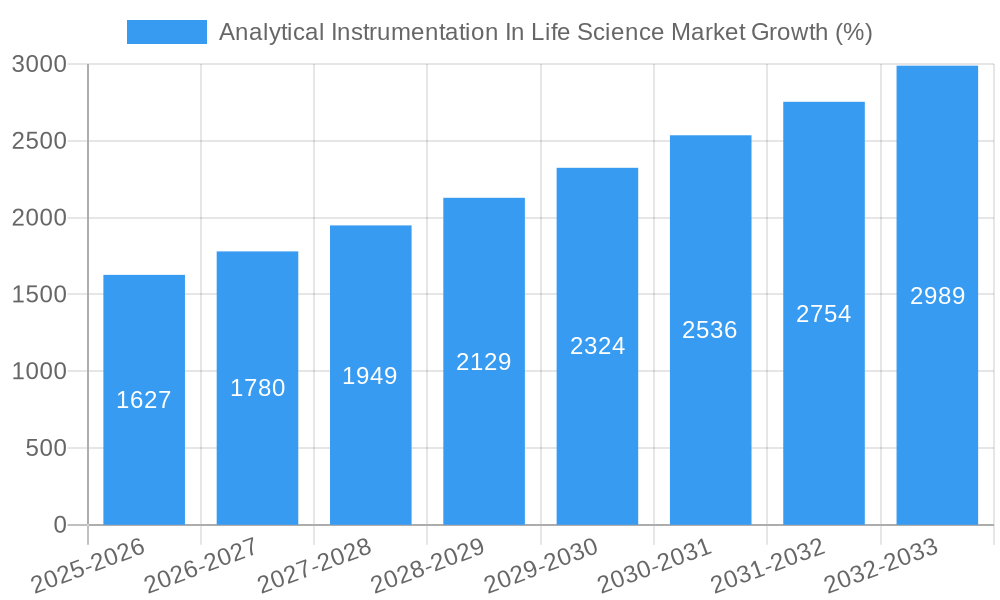
The global Analytical Instrumentation in Life Science market is poised for substantial growth, projected to reach \$18.80 billion in 2025 and exhibiting a robust Compound Annual Growth Rate (CAGR) of 8.80% from 2025 to 2033. This expansion is fueled by several key drivers. The increasing prevalence of chronic diseases necessitates advanced diagnostic tools and research, driving demand for sophisticated analytical instrumentation. Furthermore, the burgeoning biopharmaceutical and nutraceutical industries, with their focus on drug discovery, development, and quality control, significantly contribute to market growth. Technological advancements, such as miniaturization, automation, and improved sensitivity of instruments, are also major catalysts. Regulatory pressures demanding higher quality control and stringent testing standards further underpin market expansion. Growth is particularly strong in regions like North America and Asia-Pacific, driven by robust healthcare infrastructure and increasing R&D investments. However, the market faces certain challenges, including the high cost of advanced instruments and the need for skilled personnel to operate and maintain them.
The market segmentation reveals significant opportunities within specific product categories and end-user verticals. Chromatographs, spectrometers (mass, elemental analysis, and molecular analysis), and analytical microscopes are experiencing high demand, reflecting the diverse analytical needs of life science research and development. The biopharmaceutical and pharmaceutical sectors dominate end-user demand, emphasizing the crucial role of analytical instrumentation in drug development and quality assurance. Competition within the market is intense, with established players such as Waters Corporation, Bruker Corporation, Thermo Fisher Scientific, Shimadzu Scientific, and Agilent Technologies vying for market share through innovation, strategic partnerships, and geographic expansion. Future market growth will hinge on continued technological innovation, regulatory compliance, and the increasing adoption of advanced analytical techniques across the life sciences sector. The market's trajectory indicates significant opportunities for both established and emerging players in the coming years.
This detailed report provides a comprehensive analysis of the Analytical Instrumentation in Life Science Market, covering market size, segmentation, growth drivers, challenges, opportunities, and key players. The study period spans from 2019 to 2033, with 2025 serving as the base and estimated year. This report is invaluable for industry stakeholders, investors, and researchers seeking actionable insights into this dynamic market.
Analytical Instrumentation In Life Science Market Concentration & Innovation
The Analytical Instrumentation in Life Science market exhibits a moderately concentrated landscape, dominated by a handful of multinational corporations. Key players like Waters Corporation, Bruker Corporation, Thermo Fisher Scientific, Shimadzu Scientific, and Agilent Technologies hold significant market share, collectively accounting for an estimated xx% in 2025. This concentration stems from significant R&D investments, established distribution networks, and a strong brand reputation. However, the market also witnesses the emergence of smaller, specialized players focusing on niche applications and innovative technologies.
Market innovation is primarily driven by advancements in miniaturization, automation, and data analytics. The development of high-throughput screening platforms, coupled with sophisticated software for data interpretation, is transforming the industry. Regulatory frameworks, such as those governing medical device approvals and data privacy, play a significant role in shaping market dynamics. The increasing prevalence of product substitutes, particularly in chromatography and spectroscopy, fosters competition and drives innovation. End-user trends, such as the growing demand for personalized medicine and point-of-care diagnostics, are fueling demand for faster, more accurate, and portable analytical instrumentation. M&A activities have been significant, with deal values exceeding xx Million in the past five years, primarily aimed at expanding product portfolios and geographical reach. Several strategic alliances and partnerships have also been formed to accelerate technology development and market penetration. The average M&A deal size in the period 2019-2024 is estimated at xx Million.
Analytical Instrumentation In Life Science Market Industry Trends & Insights
The Analytical Instrumentation in Life Science market is poised for substantial growth, driven by several key factors. The rising prevalence of chronic diseases globally, coupled with increased demand for personalized medicine and advanced diagnostics, is a major catalyst. Technological advancements, such as the development of mass spectrometry imaging and next-generation sequencing technologies, are pushing the boundaries of analytical capabilities. The pharmaceutical and biopharmaceutical industries are major consumers, driving demand for sophisticated instrumentation for drug discovery, development, and quality control. The market is witnessing a shift towards automated and integrated solutions, streamlining workflows and enhancing efficiency. Consumer preferences are increasingly focused on improved accuracy, speed, and ease of use. The competitive landscape is characterized by both intense rivalry among established players and the entry of new entrants with disruptive technologies. The market is expected to witness a CAGR of xx% during the forecast period (2025-2033), with market penetration increasing in emerging economies. The global market size is projected to reach xx Million by 2033.
Dominant Markets & Segments in Analytical Instrumentation In Life Science Market
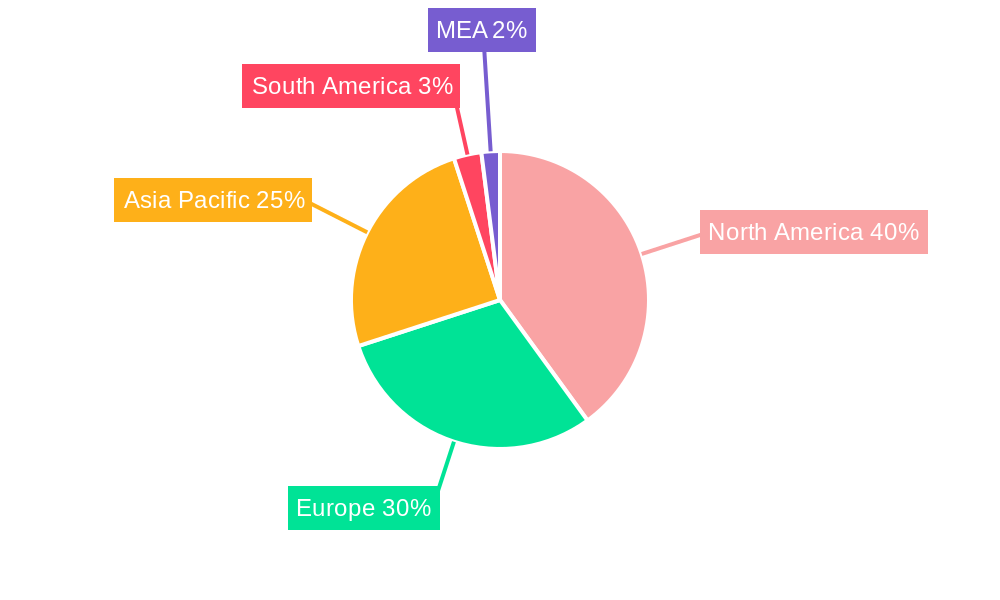
The North American region currently holds the largest market share, driven by strong R&D investments, a well-established healthcare infrastructure, and the presence of major market players. However, the Asia-Pacific region is anticipated to exhibit the fastest growth rate during the forecast period, fueled by rising healthcare expenditure, expanding pharmaceutical industries, and increasing government support for life science research.
By Type of Product:
- Chromatographs: This segment holds a substantial share, driven by the widespread use in various analytical applications within the life science sector.
- Spectrometers (Mass, Elemental Analysis, and Molecular Analysis): This segment is experiencing rapid growth due to advancements in mass spectrometry technologies and their increasing applications in proteomics, metabolomics, and other areas.
- Gas Analyzer, Liquid Analyzer, Analytical X-ray Instrumentation, and Analytical Microscopes: These segments are witnessing steady growth, driven by specific niche applications and technological improvements.
By End User Vertical:
- Biopharmaceutical and Nutraceutical: This segment is a major driver of market growth, fueled by the increasing demand for advanced analytical techniques in drug development and quality control.
- Pharmaceutical: This segment demonstrates consistent growth driven by stringent regulatory requirements and the need for precise analytical data throughout the drug lifecycle.
Key Drivers:
- Robust R&D investments in life science research across various nations.
- Stringent regulatory requirements necessitating precise analytical instrumentation.
- Increasing demand for high-throughput screening and automated workflows.
- The rise of personalized medicine and point-of-care diagnostics.
- Expanding pharmaceutical and biopharmaceutical industries globally.
Analytical Instrumentation In Life Science Market Product Developments
Recent product innovations focus on enhancing speed, sensitivity, and ease of use. Miniaturized systems, portable devices, and cloud-based data analysis platforms are gaining traction. Advanced technologies like mass spectrometry imaging and next-generation sequencing are revolutionizing analytical capabilities, offering improved resolution and throughput. The market is witnessing a shift toward integrated solutions that combine multiple analytical techniques, providing more comprehensive data analysis. These innovations offer competitive advantages through enhanced analytical performance, workflow efficiencies, and reduced operational costs.
Report Scope & Segmentation Analysis
This report provides a comprehensive segmentation of the Analytical Instrumentation in Life Science market based on product type (Chromatographs, Spectrometers, Gas Analyzers, Liquid Analyzers, Analytical X-ray Instrumentation, Analytical Microscopes) and end-user vertical (Biopharmaceutical and Nutraceutical, Pharmaceutical). Each segment is analyzed individually based on historical data (2019-2024), current estimates (2025), and future projections (2025-2033), including market size and growth rates. Competitive dynamics within each segment are also thoroughly evaluated. The report includes detailed insights into the specific technologies involved, application areas, challenges faced, and competitive landscape, incorporating market share information, growth predictions, and insights into industry specific competitive dynamics.
Key Drivers of Analytical Instrumentation In Life Science Market Growth
Technological advancements, particularly in mass spectrometry, chromatography, and spectroscopy, are driving significant growth. The increasing demand for high-throughput screening and automation in drug discovery and development fuels market expansion. Stringent regulatory requirements for quality control and safety in the pharmaceutical and biopharmaceutical industries necessitate advanced analytical instrumentation. Rising healthcare expenditure and investment in life science research in developing economies are also creating substantial growth opportunities.
Challenges in the Analytical Instrumentation In Life Science Market Sector
Regulatory hurdles and stringent approval processes for new analytical instruments pose a significant challenge. Supply chain disruptions can impact the availability and cost of components, affecting production and delivery timelines. Intense competition among established players and the emergence of new entrants with innovative technologies create pressure on pricing and margins. The high cost of advanced instrumentation also limits market accessibility in certain regions. These factors, if not appropriately addressed, could hinder market growth by an estimated xx% over the next decade.
Emerging Opportunities in Analytical Instrumentation In Life Science Market
Emerging opportunities lie in the development of point-of-care diagnostics and portable analytical devices for remote and resource-limited settings. The growing demand for personalized medicine and companion diagnostics opens new avenues for specialized analytical instrumentation. The integration of artificial intelligence and machine learning in data analysis is enhancing the speed and accuracy of analytical workflows. Expanding into emerging markets with growing healthcare infrastructure and research activities offers significant potential.
Leading Players in the Analytical Instrumentation In Life Science Market Market
- Waters Corporation
- Bruker Corporation
- Thermo Fisher Scientific
- Shimadzu Scientific
- Agilent Technologies
Key Developments in Analytical Instrumentation In Life Science Industry
- March 2023: The COVID-19 pandemic spurred significant investment in India's healthcare infrastructure and R&D, with the government announcing a national digital health ecosystem and a new pharmaceutical program in subsequent budgets. This boosted demand for analytical instruments, accelerating market growth in the region.
- March 2023: The UK's life sciences manufacturing sector received a GBP 277 million (USD 350.19 Million) investment, fostering a globally competitive environment and driving demand for high-quality analytical instrumentation.
Strategic Outlook for Analytical Instrumentation In Life Science Market Market
The Analytical Instrumentation in Life Science market is poised for continued growth, driven by technological innovation, increasing healthcare expenditure, and the expansion of the pharmaceutical and biopharmaceutical industries. The adoption of advanced analytical techniques, coupled with the growing demand for personalized medicine and point-of-care diagnostics, presents significant opportunities for market expansion. Strategic partnerships and collaborations will be crucial for players to capitalize on these opportunities and navigate the competitive landscape effectively. The market is expected to witness a sustained growth trajectory, with significant potential for market expansion in both established and emerging economies.
Analytical Instrumentation In Life Science Market Segmentation
-
1. Type of Product
- 1.1. Chromatographs
- 1.2. Spectrom
- 1.3. Gas Analyzer
- 1.4. Liquid Analyzer
- 1.5. Analytic
-
2. End User Vertical
- 2.1. Biopharmaceutical and Nutraceutical
- 2.2. Pharmaceutical
Analytical Instrumentation In Life Science Market Segmentation By Geography
- 1. North America
- 2. Europe
- 3. Asia Pacific
- 4. Rest of the World
Analytical Instrumentation In Life Science Market REPORT HIGHLIGHTS
| Aspects | Details |
|---|---|
| Study Period | 2019-2033 |
| Base Year | 2024 |
| Estimated Year | 2025 |
| Forecast Period | 2025-2033 |
| Historical Period | 2019-2024 |
| Growth Rate | CAGR of 8.80% from 2019-2033 |
| Segmentation |
|
Table of Contents
- 1. Introduction
- 1.1. Research Scope
- 1.2. Market Segmentation
- 1.3. Research Methodology
- 1.4. Definitions and Assumptions
- 2. Executive Summary
- 2.1. Introduction
- 3. Market Dynamics
- 3.1. Introduction
- 3.2. Market Drivers
- 3.2.1. Surge in demand of Analytical Instrumentation in Pharmaceutical Industry; Government support and incentives
- 3.3. Market Restrains
- 3.3.1. High Initial Cost
- 3.4. Market Trends
- 3.4.1. Pharmaceutical Industry to Grow with Significant Growth Rate
- 4. Market Factor Analysis
- 4.1. Porters Five Forces
- 4.2. Supply/Value Chain
- 4.3. PESTEL analysis
- 4.4. Market Entropy
- 4.5. Patent/Trademark Analysis
- 5. Global Analytical Instrumentation In Life Science Market Analysis, Insights and Forecast, 2019-2031
- 5.1. Market Analysis, Insights and Forecast - by Type of Product
- 5.1.1. Chromatographs
- 5.1.2. Spectrom
- 5.1.3. Gas Analyzer
- 5.1.4. Liquid Analyzer
- 5.1.5. Analytic
- 5.2. Market Analysis, Insights and Forecast - by End User Vertical
- 5.2.1. Biopharmaceutical and Nutraceutical
- 5.2.2. Pharmaceutical
- 5.3. Market Analysis, Insights and Forecast - by Region
- 5.3.1. North America
- 5.3.2. Europe
- 5.3.3. Asia Pacific
- 5.3.4. Rest of the World
- 5.1. Market Analysis, Insights and Forecast - by Type of Product
- 6. North America Analytical Instrumentation In Life Science Market Analysis, Insights and Forecast, 2019-2031
- 6.1. Market Analysis, Insights and Forecast - by Type of Product
- 6.1.1. Chromatographs
- 6.1.2. Spectrom
- 6.1.3. Gas Analyzer
- 6.1.4. Liquid Analyzer
- 6.1.5. Analytic
- 6.2. Market Analysis, Insights and Forecast - by End User Vertical
- 6.2.1. Biopharmaceutical and Nutraceutical
- 6.2.2. Pharmaceutical
- 6.1. Market Analysis, Insights and Forecast - by Type of Product
- 7. Europe Analytical Instrumentation In Life Science Market Analysis, Insights and Forecast, 2019-2031
- 7.1. Market Analysis, Insights and Forecast - by Type of Product
- 7.1.1. Chromatographs
- 7.1.2. Spectrom
- 7.1.3. Gas Analyzer
- 7.1.4. Liquid Analyzer
- 7.1.5. Analytic
- 7.2. Market Analysis, Insights and Forecast - by End User Vertical
- 7.2.1. Biopharmaceutical and Nutraceutical
- 7.2.2. Pharmaceutical
- 7.1. Market Analysis, Insights and Forecast - by Type of Product
- 8. Asia Pacific Analytical Instrumentation In Life Science Market Analysis, Insights and Forecast, 2019-2031
- 8.1. Market Analysis, Insights and Forecast - by Type of Product
- 8.1.1. Chromatographs
- 8.1.2. Spectrom
- 8.1.3. Gas Analyzer
- 8.1.4. Liquid Analyzer
- 8.1.5. Analytic
- 8.2. Market Analysis, Insights and Forecast - by End User Vertical
- 8.2.1. Biopharmaceutical and Nutraceutical
- 8.2.2. Pharmaceutical
- 8.1. Market Analysis, Insights and Forecast - by Type of Product
- 9. Rest of the World Analytical Instrumentation In Life Science Market Analysis, Insights and Forecast, 2019-2031
- 9.1. Market Analysis, Insights and Forecast - by Type of Product
- 9.1.1. Chromatographs
- 9.1.2. Spectrom
- 9.1.3. Gas Analyzer
- 9.1.4. Liquid Analyzer
- 9.1.5. Analytic
- 9.2. Market Analysis, Insights and Forecast - by End User Vertical
- 9.2.1. Biopharmaceutical and Nutraceutical
- 9.2.2. Pharmaceutical
- 9.1. Market Analysis, Insights and Forecast - by Type of Product
- 10. North America Analytical Instrumentation In Life Science Market Analysis, Insights and Forecast, 2019-2031
- 10.1. Market Analysis, Insights and Forecast - By Country/Sub-region
- 10.1.1 United States
- 10.1.2 Canada
- 10.1.3 Mexico
- 11. Europe Analytical Instrumentation In Life Science Market Analysis, Insights and Forecast, 2019-2031
- 11.1. Market Analysis, Insights and Forecast - By Country/Sub-region
- 11.1.1 Germany
- 11.1.2 United Kingdom
- 11.1.3 France
- 11.1.4 Spain
- 11.1.5 Italy
- 11.1.6 Spain
- 11.1.7 Belgium
- 11.1.8 Netherland
- 11.1.9 Nordics
- 11.1.10 Rest of Europe
- 12. Asia Pacific Analytical Instrumentation In Life Science Market Analysis, Insights and Forecast, 2019-2031
- 12.1. Market Analysis, Insights and Forecast - By Country/Sub-region
- 12.1.1 China
- 12.1.2 Japan
- 12.1.3 India
- 12.1.4 South Korea
- 12.1.5 Southeast Asia
- 12.1.6 Australia
- 12.1.7 Indonesia
- 12.1.8 Phillipes
- 12.1.9 Singapore
- 12.1.10 Thailandc
- 12.1.11 Rest of Asia Pacific
- 13. South America Analytical Instrumentation In Life Science Market Analysis, Insights and Forecast, 2019-2031
- 13.1. Market Analysis, Insights and Forecast - By Country/Sub-region
- 13.1.1 Brazil
- 13.1.2 Argentina
- 13.1.3 Peru
- 13.1.4 Chile
- 13.1.5 Colombia
- 13.1.6 Ecuador
- 13.1.7 Venezuela
- 13.1.8 Rest of South America
- 14. North America Analytical Instrumentation In Life Science Market Analysis, Insights and Forecast, 2019-2031
- 14.1. Market Analysis, Insights and Forecast - By Country/Sub-region
- 14.1.1 United States
- 14.1.2 Canada
- 14.1.3 Mexico
- 15. MEA Analytical Instrumentation In Life Science Market Analysis, Insights and Forecast, 2019-2031
- 15.1. Market Analysis, Insights and Forecast - By Country/Sub-region
- 15.1.1 United Arab Emirates
- 15.1.2 Saudi Arabia
- 15.1.3 South Africa
- 15.1.4 Rest of Middle East and Africa
- 16. Competitive Analysis
- 16.1. Global Market Share Analysis 2024
- 16.2. Company Profiles
- 16.2.1 Waters Corporation
- 16.2.1.1. Overview
- 16.2.1.2. Products
- 16.2.1.3. SWOT Analysis
- 16.2.1.4. Recent Developments
- 16.2.1.5. Financials (Based on Availability)
- 16.2.2 Bruker Corporation
- 16.2.2.1. Overview
- 16.2.2.2. Products
- 16.2.2.3. SWOT Analysis
- 16.2.2.4. Recent Developments
- 16.2.2.5. Financials (Based on Availability)
- 16.2.3 Thermo Fisher Scientific
- 16.2.3.1. Overview
- 16.2.3.2. Products
- 16.2.3.3. SWOT Analysis
- 16.2.3.4. Recent Developments
- 16.2.3.5. Financials (Based on Availability)
- 16.2.4 Shimadzu Scientific
- 16.2.4.1. Overview
- 16.2.4.2. Products
- 16.2.4.3. SWOT Analysis
- 16.2.4.4. Recent Developments
- 16.2.4.5. Financials (Based on Availability)
- 16.2.5 Agilent Technologies
- 16.2.5.1. Overview
- 16.2.5.2. Products
- 16.2.5.3. SWOT Analysis
- 16.2.5.4. Recent Developments
- 16.2.5.5. Financials (Based on Availability)
- 16.2.1 Waters Corporation
List of Figures
- Figure 1: Global Analytical Instrumentation In Life Science Market Revenue Breakdown (Million, %) by Region 2024 & 2032
- Figure 2: Global Analytical Instrumentation In Life Science Market Volume Breakdown (K Unit, %) by Region 2024 & 2032
- Figure 3: North America Analytical Instrumentation In Life Science Market Revenue (Million), by Country 2024 & 2032
- Figure 4: North America Analytical Instrumentation In Life Science Market Volume (K Unit), by Country 2024 & 2032
- Figure 5: North America Analytical Instrumentation In Life Science Market Revenue Share (%), by Country 2024 & 2032
- Figure 6: North America Analytical Instrumentation In Life Science Market Volume Share (%), by Country 2024 & 2032
- Figure 7: Europe Analytical Instrumentation In Life Science Market Revenue (Million), by Country 2024 & 2032
- Figure 8: Europe Analytical Instrumentation In Life Science Market Volume (K Unit), by Country 2024 & 2032
- Figure 9: Europe Analytical Instrumentation In Life Science Market Revenue Share (%), by Country 2024 & 2032
- Figure 10: Europe Analytical Instrumentation In Life Science Market Volume Share (%), by Country 2024 & 2032
- Figure 11: Asia Pacific Analytical Instrumentation In Life Science Market Revenue (Million), by Country 2024 & 2032
- Figure 12: Asia Pacific Analytical Instrumentation In Life Science Market Volume (K Unit), by Country 2024 & 2032
- Figure 13: Asia Pacific Analytical Instrumentation In Life Science Market Revenue Share (%), by Country 2024 & 2032
- Figure 14: Asia Pacific Analytical Instrumentation In Life Science Market Volume Share (%), by Country 2024 & 2032
- Figure 15: South America Analytical Instrumentation In Life Science Market Revenue (Million), by Country 2024 & 2032
- Figure 16: South America Analytical Instrumentation In Life Science Market Volume (K Unit), by Country 2024 & 2032
- Figure 17: South America Analytical Instrumentation In Life Science Market Revenue Share (%), by Country 2024 & 2032
- Figure 18: South America Analytical Instrumentation In Life Science Market Volume Share (%), by Country 2024 & 2032
- Figure 19: North America Analytical Instrumentation In Life Science Market Revenue (Million), by Country 2024 & 2032
- Figure 20: North America Analytical Instrumentation In Life Science Market Volume (K Unit), by Country 2024 & 2032
- Figure 21: North America Analytical Instrumentation In Life Science Market Revenue Share (%), by Country 2024 & 2032
- Figure 22: North America Analytical Instrumentation In Life Science Market Volume Share (%), by Country 2024 & 2032
- Figure 23: MEA Analytical Instrumentation In Life Science Market Revenue (Million), by Country 2024 & 2032
- Figure 24: MEA Analytical Instrumentation In Life Science Market Volume (K Unit), by Country 2024 & 2032
- Figure 25: MEA Analytical Instrumentation In Life Science Market Revenue Share (%), by Country 2024 & 2032
- Figure 26: MEA Analytical Instrumentation In Life Science Market Volume Share (%), by Country 2024 & 2032
- Figure 27: North America Analytical Instrumentation In Life Science Market Revenue (Million), by Type of Product 2024 & 2032
- Figure 28: North America Analytical Instrumentation In Life Science Market Volume (K Unit), by Type of Product 2024 & 2032
- Figure 29: North America Analytical Instrumentation In Life Science Market Revenue Share (%), by Type of Product 2024 & 2032
- Figure 30: North America Analytical Instrumentation In Life Science Market Volume Share (%), by Type of Product 2024 & 2032
- Figure 31: North America Analytical Instrumentation In Life Science Market Revenue (Million), by End User Vertical 2024 & 2032
- Figure 32: North America Analytical Instrumentation In Life Science Market Volume (K Unit), by End User Vertical 2024 & 2032
- Figure 33: North America Analytical Instrumentation In Life Science Market Revenue Share (%), by End User Vertical 2024 & 2032
- Figure 34: North America Analytical Instrumentation In Life Science Market Volume Share (%), by End User Vertical 2024 & 2032
- Figure 35: North America Analytical Instrumentation In Life Science Market Revenue (Million), by Country 2024 & 2032
- Figure 36: North America Analytical Instrumentation In Life Science Market Volume (K Unit), by Country 2024 & 2032
- Figure 37: North America Analytical Instrumentation In Life Science Market Revenue Share (%), by Country 2024 & 2032
- Figure 38: North America Analytical Instrumentation In Life Science Market Volume Share (%), by Country 2024 & 2032
- Figure 39: Europe Analytical Instrumentation In Life Science Market Revenue (Million), by Type of Product 2024 & 2032
- Figure 40: Europe Analytical Instrumentation In Life Science Market Volume (K Unit), by Type of Product 2024 & 2032
- Figure 41: Europe Analytical Instrumentation In Life Science Market Revenue Share (%), by Type of Product 2024 & 2032
- Figure 42: Europe Analytical Instrumentation In Life Science Market Volume Share (%), by Type of Product 2024 & 2032
- Figure 43: Europe Analytical Instrumentation In Life Science Market Revenue (Million), by End User Vertical 2024 & 2032
- Figure 44: Europe Analytical Instrumentation In Life Science Market Volume (K Unit), by End User Vertical 2024 & 2032
- Figure 45: Europe Analytical Instrumentation In Life Science Market Revenue Share (%), by End User Vertical 2024 & 2032
- Figure 46: Europe Analytical Instrumentation In Life Science Market Volume Share (%), by End User Vertical 2024 & 2032
- Figure 47: Europe Analytical Instrumentation In Life Science Market Revenue (Million), by Country 2024 & 2032
- Figure 48: Europe Analytical Instrumentation In Life Science Market Volume (K Unit), by Country 2024 & 2032
- Figure 49: Europe Analytical Instrumentation In Life Science Market Revenue Share (%), by Country 2024 & 2032
- Figure 50: Europe Analytical Instrumentation In Life Science Market Volume Share (%), by Country 2024 & 2032
- Figure 51: Asia Pacific Analytical Instrumentation In Life Science Market Revenue (Million), by Type of Product 2024 & 2032
- Figure 52: Asia Pacific Analytical Instrumentation In Life Science Market Volume (K Unit), by Type of Product 2024 & 2032
- Figure 53: Asia Pacific Analytical Instrumentation In Life Science Market Revenue Share (%), by Type of Product 2024 & 2032
- Figure 54: Asia Pacific Analytical Instrumentation In Life Science Market Volume Share (%), by Type of Product 2024 & 2032
- Figure 55: Asia Pacific Analytical Instrumentation In Life Science Market Revenue (Million), by End User Vertical 2024 & 2032
- Figure 56: Asia Pacific Analytical Instrumentation In Life Science Market Volume (K Unit), by End User Vertical 2024 & 2032
- Figure 57: Asia Pacific Analytical Instrumentation In Life Science Market Revenue Share (%), by End User Vertical 2024 & 2032
- Figure 58: Asia Pacific Analytical Instrumentation In Life Science Market Volume Share (%), by End User Vertical 2024 & 2032
- Figure 59: Asia Pacific Analytical Instrumentation In Life Science Market Revenue (Million), by Country 2024 & 2032
- Figure 60: Asia Pacific Analytical Instrumentation In Life Science Market Volume (K Unit), by Country 2024 & 2032
- Figure 61: Asia Pacific Analytical Instrumentation In Life Science Market Revenue Share (%), by Country 2024 & 2032
- Figure 62: Asia Pacific Analytical Instrumentation In Life Science Market Volume Share (%), by Country 2024 & 2032
- Figure 63: Rest of the World Analytical Instrumentation In Life Science Market Revenue (Million), by Type of Product 2024 & 2032
- Figure 64: Rest of the World Analytical Instrumentation In Life Science Market Volume (K Unit), by Type of Product 2024 & 2032
- Figure 65: Rest of the World Analytical Instrumentation In Life Science Market Revenue Share (%), by Type of Product 2024 & 2032
- Figure 66: Rest of the World Analytical Instrumentation In Life Science Market Volume Share (%), by Type of Product 2024 & 2032
- Figure 67: Rest of the World Analytical Instrumentation In Life Science Market Revenue (Million), by End User Vertical 2024 & 2032
- Figure 68: Rest of the World Analytical Instrumentation In Life Science Market Volume (K Unit), by End User Vertical 2024 & 2032
- Figure 69: Rest of the World Analytical Instrumentation In Life Science Market Revenue Share (%), by End User Vertical 2024 & 2032
- Figure 70: Rest of the World Analytical Instrumentation In Life Science Market Volume Share (%), by End User Vertical 2024 & 2032
- Figure 71: Rest of the World Analytical Instrumentation In Life Science Market Revenue (Million), by Country 2024 & 2032
- Figure 72: Rest of the World Analytical Instrumentation In Life Science Market Volume (K Unit), by Country 2024 & 2032
- Figure 73: Rest of the World Analytical Instrumentation In Life Science Market Revenue Share (%), by Country 2024 & 2032
- Figure 74: Rest of the World Analytical Instrumentation In Life Science Market Volume Share (%), by Country 2024 & 2032
List of Tables
- Table 1: Global Analytical Instrumentation In Life Science Market Revenue Million Forecast, by Region 2019 & 2032
- Table 2: Global Analytical Instrumentation In Life Science Market Volume K Unit Forecast, by Region 2019 & 2032
- Table 3: Global Analytical Instrumentation In Life Science Market Revenue Million Forecast, by Type of Product 2019 & 2032
- Table 4: Global Analytical Instrumentation In Life Science Market Volume K Unit Forecast, by Type of Product 2019 & 2032
- Table 5: Global Analytical Instrumentation In Life Science Market Revenue Million Forecast, by End User Vertical 2019 & 2032
- Table 6: Global Analytical Instrumentation In Life Science Market Volume K Unit Forecast, by End User Vertical 2019 & 2032
- Table 7: Global Analytical Instrumentation In Life Science Market Revenue Million Forecast, by Region 2019 & 2032
- Table 8: Global Analytical Instrumentation In Life Science Market Volume K Unit Forecast, by Region 2019 & 2032
- Table 9: Global Analytical Instrumentation In Life Science Market Revenue Million Forecast, by Country 2019 & 2032
- Table 10: Global Analytical Instrumentation In Life Science Market Volume K Unit Forecast, by Country 2019 & 2032
- Table 11: United States Analytical Instrumentation In Life Science Market Revenue (Million) Forecast, by Application 2019 & 2032
- Table 12: United States Analytical Instrumentation In Life Science Market Volume (K Unit) Forecast, by Application 2019 & 2032
- Table 13: Canada Analytical Instrumentation In Life Science Market Revenue (Million) Forecast, by Application 2019 & 2032
- Table 14: Canada Analytical Instrumentation In Life Science Market Volume (K Unit) Forecast, by Application 2019 & 2032
- Table 15: Mexico Analytical Instrumentation In Life Science Market Revenue (Million) Forecast, by Application 2019 & 2032
- Table 16: Mexico Analytical Instrumentation In Life Science Market Volume (K Unit) Forecast, by Application 2019 & 2032
- Table 17: Global Analytical Instrumentation In Life Science Market Revenue Million Forecast, by Country 2019 & 2032
- Table 18: Global Analytical Instrumentation In Life Science Market Volume K Unit Forecast, by Country 2019 & 2032
- Table 19: Germany Analytical Instrumentation In Life Science Market Revenue (Million) Forecast, by Application 2019 & 2032
- Table 20: Germany Analytical Instrumentation In Life Science Market Volume (K Unit) Forecast, by Application 2019 & 2032
- Table 21: United Kingdom Analytical Instrumentation In Life Science Market Revenue (Million) Forecast, by Application 2019 & 2032
- Table 22: United Kingdom Analytical Instrumentation In Life Science Market Volume (K Unit) Forecast, by Application 2019 & 2032
- Table 23: France Analytical Instrumentation In Life Science Market Revenue (Million) Forecast, by Application 2019 & 2032
- Table 24: France Analytical Instrumentation In Life Science Market Volume (K Unit) Forecast, by Application 2019 & 2032
- Table 25: Spain Analytical Instrumentation In Life Science Market Revenue (Million) Forecast, by Application 2019 & 2032
- Table 26: Spain Analytical Instrumentation In Life Science Market Volume (K Unit) Forecast, by Application 2019 & 2032
- Table 27: Italy Analytical Instrumentation In Life Science Market Revenue (Million) Forecast, by Application 2019 & 2032
- Table 28: Italy Analytical Instrumentation In Life Science Market Volume (K Unit) Forecast, by Application 2019 & 2032
- Table 29: Spain Analytical Instrumentation In Life Science Market Revenue (Million) Forecast, by Application 2019 & 2032
- Table 30: Spain Analytical Instrumentation In Life Science Market Volume (K Unit) Forecast, by Application 2019 & 2032
- Table 31: Belgium Analytical Instrumentation In Life Science Market Revenue (Million) Forecast, by Application 2019 & 2032
- Table 32: Belgium Analytical Instrumentation In Life Science Market Volume (K Unit) Forecast, by Application 2019 & 2032
- Table 33: Netherland Analytical Instrumentation In Life Science Market Revenue (Million) Forecast, by Application 2019 & 2032
- Table 34: Netherland Analytical Instrumentation In Life Science Market Volume (K Unit) Forecast, by Application 2019 & 2032
- Table 35: Nordics Analytical Instrumentation In Life Science Market Revenue (Million) Forecast, by Application 2019 & 2032
- Table 36: Nordics Analytical Instrumentation In Life Science Market Volume (K Unit) Forecast, by Application 2019 & 2032
- Table 37: Rest of Europe Analytical Instrumentation In Life Science Market Revenue (Million) Forecast, by Application 2019 & 2032
- Table 38: Rest of Europe Analytical Instrumentation In Life Science Market Volume (K Unit) Forecast, by Application 2019 & 2032
- Table 39: Global Analytical Instrumentation In Life Science Market Revenue Million Forecast, by Country 2019 & 2032
- Table 40: Global Analytical Instrumentation In Life Science Market Volume K Unit Forecast, by Country 2019 & 2032
- Table 41: China Analytical Instrumentation In Life Science Market Revenue (Million) Forecast, by Application 2019 & 2032
- Table 42: China Analytical Instrumentation In Life Science Market Volume (K Unit) Forecast, by Application 2019 & 2032
- Table 43: Japan Analytical Instrumentation In Life Science Market Revenue (Million) Forecast, by Application 2019 & 2032
- Table 44: Japan Analytical Instrumentation In Life Science Market Volume (K Unit) Forecast, by Application 2019 & 2032
- Table 45: India Analytical Instrumentation In Life Science Market Revenue (Million) Forecast, by Application 2019 & 2032
- Table 46: India Analytical Instrumentation In Life Science Market Volume (K Unit) Forecast, by Application 2019 & 2032
- Table 47: South Korea Analytical Instrumentation In Life Science Market Revenue (Million) Forecast, by Application 2019 & 2032
- Table 48: South Korea Analytical Instrumentation In Life Science Market Volume (K Unit) Forecast, by Application 2019 & 2032
- Table 49: Southeast Asia Analytical Instrumentation In Life Science Market Revenue (Million) Forecast, by Application 2019 & 2032
- Table 50: Southeast Asia Analytical Instrumentation In Life Science Market Volume (K Unit) Forecast, by Application 2019 & 2032
- Table 51: Australia Analytical Instrumentation In Life Science Market Revenue (Million) Forecast, by Application 2019 & 2032
- Table 52: Australia Analytical Instrumentation In Life Science Market Volume (K Unit) Forecast, by Application 2019 & 2032
- Table 53: Indonesia Analytical Instrumentation In Life Science Market Revenue (Million) Forecast, by Application 2019 & 2032
- Table 54: Indonesia Analytical Instrumentation In Life Science Market Volume (K Unit) Forecast, by Application 2019 & 2032
- Table 55: Phillipes Analytical Instrumentation In Life Science Market Revenue (Million) Forecast, by Application 2019 & 2032
- Table 56: Phillipes Analytical Instrumentation In Life Science Market Volume (K Unit) Forecast, by Application 2019 & 2032
- Table 57: Singapore Analytical Instrumentation In Life Science Market Revenue (Million) Forecast, by Application 2019 & 2032
- Table 58: Singapore Analytical Instrumentation In Life Science Market Volume (K Unit) Forecast, by Application 2019 & 2032
- Table 59: Thailandc Analytical Instrumentation In Life Science Market Revenue (Million) Forecast, by Application 2019 & 2032
- Table 60: Thailandc Analytical Instrumentation In Life Science Market Volume (K Unit) Forecast, by Application 2019 & 2032
- Table 61: Rest of Asia Pacific Analytical Instrumentation In Life Science Market Revenue (Million) Forecast, by Application 2019 & 2032
- Table 62: Rest of Asia Pacific Analytical Instrumentation In Life Science Market Volume (K Unit) Forecast, by Application 2019 & 2032
- Table 63: Global Analytical Instrumentation In Life Science Market Revenue Million Forecast, by Country 2019 & 2032
- Table 64: Global Analytical Instrumentation In Life Science Market Volume K Unit Forecast, by Country 2019 & 2032
- Table 65: Brazil Analytical Instrumentation In Life Science Market Revenue (Million) Forecast, by Application 2019 & 2032
- Table 66: Brazil Analytical Instrumentation In Life Science Market Volume (K Unit) Forecast, by Application 2019 & 2032
- Table 67: Argentina Analytical Instrumentation In Life Science Market Revenue (Million) Forecast, by Application 2019 & 2032
- Table 68: Argentina Analytical Instrumentation In Life Science Market Volume (K Unit) Forecast, by Application 2019 & 2032
- Table 69: Peru Analytical Instrumentation In Life Science Market Revenue (Million) Forecast, by Application 2019 & 2032
- Table 70: Peru Analytical Instrumentation In Life Science Market Volume (K Unit) Forecast, by Application 2019 & 2032
- Table 71: Chile Analytical Instrumentation In Life Science Market Revenue (Million) Forecast, by Application 2019 & 2032
- Table 72: Chile Analytical Instrumentation In Life Science Market Volume (K Unit) Forecast, by Application 2019 & 2032
- Table 73: Colombia Analytical Instrumentation In Life Science Market Revenue (Million) Forecast, by Application 2019 & 2032
- Table 74: Colombia Analytical Instrumentation In Life Science Market Volume (K Unit) Forecast, by Application 2019 & 2032
- Table 75: Ecuador Analytical Instrumentation In Life Science Market Revenue (Million) Forecast, by Application 2019 & 2032
- Table 76: Ecuador Analytical Instrumentation In Life Science Market Volume (K Unit) Forecast, by Application 2019 & 2032
- Table 77: Venezuela Analytical Instrumentation In Life Science Market Revenue (Million) Forecast, by Application 2019 & 2032
- Table 78: Venezuela Analytical Instrumentation In Life Science Market Volume (K Unit) Forecast, by Application 2019 & 2032
- Table 79: Rest of South America Analytical Instrumentation In Life Science Market Revenue (Million) Forecast, by Application 2019 & 2032
- Table 80: Rest of South America Analytical Instrumentation In Life Science Market Volume (K Unit) Forecast, by Application 2019 & 2032
- Table 81: Global Analytical Instrumentation In Life Science Market Revenue Million Forecast, by Country 2019 & 2032
- Table 82: Global Analytical Instrumentation In Life Science Market Volume K Unit Forecast, by Country 2019 & 2032
- Table 83: United States Analytical Instrumentation In Life Science Market Revenue (Million) Forecast, by Application 2019 & 2032
- Table 84: United States Analytical Instrumentation In Life Science Market Volume (K Unit) Forecast, by Application 2019 & 2032
- Table 85: Canada Analytical Instrumentation In Life Science Market Revenue (Million) Forecast, by Application 2019 & 2032
- Table 86: Canada Analytical Instrumentation In Life Science Market Volume (K Unit) Forecast, by Application 2019 & 2032
- Table 87: Mexico Analytical Instrumentation In Life Science Market Revenue (Million) Forecast, by Application 2019 & 2032
- Table 88: Mexico Analytical Instrumentation In Life Science Market Volume (K Unit) Forecast, by Application 2019 & 2032
- Table 89: Global Analytical Instrumentation In Life Science Market Revenue Million Forecast, by Country 2019 & 2032
- Table 90: Global Analytical Instrumentation In Life Science Market Volume K Unit Forecast, by Country 2019 & 2032
- Table 91: United Arab Emirates Analytical Instrumentation In Life Science Market Revenue (Million) Forecast, by Application 2019 & 2032
- Table 92: United Arab Emirates Analytical Instrumentation In Life Science Market Volume (K Unit) Forecast, by Application 2019 & 2032
- Table 93: Saudi Arabia Analytical Instrumentation In Life Science Market Revenue (Million) Forecast, by Application 2019 & 2032
- Table 94: Saudi Arabia Analytical Instrumentation In Life Science Market Volume (K Unit) Forecast, by Application 2019 & 2032
- Table 95: South Africa Analytical Instrumentation In Life Science Market Revenue (Million) Forecast, by Application 2019 & 2032
- Table 96: South Africa Analytical Instrumentation In Life Science Market Volume (K Unit) Forecast, by Application 2019 & 2032
- Table 97: Rest of Middle East and Africa Analytical Instrumentation In Life Science Market Revenue (Million) Forecast, by Application 2019 & 2032
- Table 98: Rest of Middle East and Africa Analytical Instrumentation In Life Science Market Volume (K Unit) Forecast, by Application 2019 & 2032
- Table 99: Global Analytical Instrumentation In Life Science Market Revenue Million Forecast, by Type of Product 2019 & 2032
- Table 100: Global Analytical Instrumentation In Life Science Market Volume K Unit Forecast, by Type of Product 2019 & 2032
- Table 101: Global Analytical Instrumentation In Life Science Market Revenue Million Forecast, by End User Vertical 2019 & 2032
- Table 102: Global Analytical Instrumentation In Life Science Market Volume K Unit Forecast, by End User Vertical 2019 & 2032
- Table 103: Global Analytical Instrumentation In Life Science Market Revenue Million Forecast, by Country 2019 & 2032
- Table 104: Global Analytical Instrumentation In Life Science Market Volume K Unit Forecast, by Country 2019 & 2032
- Table 105: Global Analytical Instrumentation In Life Science Market Revenue Million Forecast, by Type of Product 2019 & 2032
- Table 106: Global Analytical Instrumentation In Life Science Market Volume K Unit Forecast, by Type of Product 2019 & 2032
- Table 107: Global Analytical Instrumentation In Life Science Market Revenue Million Forecast, by End User Vertical 2019 & 2032
- Table 108: Global Analytical Instrumentation In Life Science Market Volume K Unit Forecast, by End User Vertical 2019 & 2032
- Table 109: Global Analytical Instrumentation In Life Science Market Revenue Million Forecast, by Country 2019 & 2032
- Table 110: Global Analytical Instrumentation In Life Science Market Volume K Unit Forecast, by Country 2019 & 2032
- Table 111: Global Analytical Instrumentation In Life Science Market Revenue Million Forecast, by Type of Product 2019 & 2032
- Table 112: Global Analytical Instrumentation In Life Science Market Volume K Unit Forecast, by Type of Product 2019 & 2032
- Table 113: Global Analytical Instrumentation In Life Science Market Revenue Million Forecast, by End User Vertical 2019 & 2032
- Table 114: Global Analytical Instrumentation In Life Science Market Volume K Unit Forecast, by End User Vertical 2019 & 2032
- Table 115: Global Analytical Instrumentation In Life Science Market Revenue Million Forecast, by Country 2019 & 2032
- Table 116: Global Analytical Instrumentation In Life Science Market Volume K Unit Forecast, by Country 2019 & 2032
- Table 117: Global Analytical Instrumentation In Life Science Market Revenue Million Forecast, by Type of Product 2019 & 2032
- Table 118: Global Analytical Instrumentation In Life Science Market Volume K Unit Forecast, by Type of Product 2019 & 2032
- Table 119: Global Analytical Instrumentation In Life Science Market Revenue Million Forecast, by End User Vertical 2019 & 2032
- Table 120: Global Analytical Instrumentation In Life Science Market Volume K Unit Forecast, by End User Vertical 2019 & 2032
- Table 121: Global Analytical Instrumentation In Life Science Market Revenue Million Forecast, by Country 2019 & 2032
- Table 122: Global Analytical Instrumentation In Life Science Market Volume K Unit Forecast, by Country 2019 & 2032
Frequently Asked Questions
1. What is the projected Compound Annual Growth Rate (CAGR) of the Analytical Instrumentation In Life Science Market?
The projected CAGR is approximately 8.80%.
2. Which companies are prominent players in the Analytical Instrumentation In Life Science Market?
Key companies in the market include Waters Corporation, Bruker Corporation, Thermo Fisher Scientific, Shimadzu Scientific, Agilent Technologies.
3. What are the main segments of the Analytical Instrumentation In Life Science Market?
The market segments include Type of Product, End User Vertical.
4. Can you provide details about the market size?
The market size is estimated to be USD 18.80 Million as of 2022.
5. What are some drivers contributing to market growth?
Surge in demand of Analytical Instrumentation in Pharmaceutical Industry; Government support and incentives.
6. What are the notable trends driving market growth?
Pharmaceutical Industry to Grow with Significant Growth Rate.
7. Are there any restraints impacting market growth?
High Initial Cost.
8. Can you provide examples of recent developments in the market?
March 2023 - The COVID-19 pandemic increased investment in India's healthcare infrastructure and research and development. The government of India announced in Budget 2022 that the country focused on building a national digital health ecosystem. In Union Budget 2023, the Government of India announced a new pharmaceutical program and further collaborations for private and public medical faculties and private research and development teams.
9. What pricing options are available for accessing the report?
Pricing options include single-user, multi-user, and enterprise licenses priced at USD 4750, USD 5250, and USD 8750 respectively.
10. Is the market size provided in terms of value or volume?
The market size is provided in terms of value, measured in Million and volume, measured in K Unit.
11. Are there any specific market keywords associated with the report?
Yes, the market keyword associated with the report is "Analytical Instrumentation In Life Science Market," which aids in identifying and referencing the specific market segment covered.
12. How do I determine which pricing option suits my needs best?
The pricing options vary based on user requirements and access needs. Individual users may opt for single-user licenses, while businesses requiring broader access may choose multi-user or enterprise licenses for cost-effective access to the report.
13. Are there any additional resources or data provided in the Analytical Instrumentation In Life Science Market report?
While the report offers comprehensive insights, it's advisable to review the specific contents or supplementary materials provided to ascertain if additional resources or data are available.
14. How can I stay updated on further developments or reports in the Analytical Instrumentation In Life Science Market?
To stay informed about further developments, trends, and reports in the Analytical Instrumentation In Life Science Market, consider subscribing to industry newsletters, following relevant companies and organizations, or regularly checking reputable industry news sources and publications.
Methodology
Step 1 - Identification of Relevant Samples Size from Population Database


Step 2 - Approaches for Defining Global Market Size (Value, Volume* & Price*)

Note*: In applicable scenarios
Step 3 - Data Sources
Primary Research
- Web Analytics
- Survey Reports
- Research Institute
- Latest Research Reports
- Opinion Leaders
Secondary Research
- Annual Reports
- White Paper
- Latest Press Release
- Industry Association
- Paid Database
- Investor Presentations

Step 4 - Data Triangulation
Involves using different sources of information in order to increase the validity of a study
These sources are likely to be stakeholders in a program - participants, other researchers, program staff, other community members, and so on.
Then we put all data in single framework & apply various statistical tools to find out the dynamic on the market.
During the analysis stage, feedback from the stakeholder groups would be compared to determine areas of agreement as well as areas of divergence


