
Key Insights
The anaplastic astrocytoma (AA) treatment market, while smaller than some other cancer segments, exhibits significant growth potential driven by increasing prevalence, advancements in targeted therapies, and a rising awareness of the disease. The market's compound annual growth rate (CAGR) of 9.60% from 2019 to 2024 suggests a robust trajectory, likely continuing into the forecast period (2025-2033). Key therapeutic segments include chemotherapy (including targeted drug therapy and monoclonal antibodies) and radiation therapy. While chemotherapy remains a significant component, the growing adoption of targeted therapies, offering greater efficacy and reduced side effects, is a major driver of market expansion. The market is geographically diverse, with North America likely holding the largest share due to advanced healthcare infrastructure and high per capita healthcare expenditure. However, Asia Pacific is projected to witness substantial growth fueled by increasing cancer incidence and improving healthcare access in emerging economies. Market restraints include the relatively low prevalence of AA compared to other brain cancers, challenges in early diagnosis, and the high cost of advanced therapies, particularly targeted agents. Companies like Merck, Roche, and Amgen, known for their oncology portfolios, are likely key players, alongside other pharmaceutical and biotech firms involved in developing and commercializing AA treatments.
Further growth will depend on several factors. Continued research and development leading to the approval of novel therapies are crucial. Improved diagnostic techniques enabling earlier detection and intervention will also contribute significantly. Government initiatives promoting cancer awareness and access to affordable treatment options in developing regions can further stimulate market growth. Competition among pharmaceutical companies is expected to remain intense, driving innovation and potentially leading to price reductions in some segments. The overall market outlook for AA treatment remains positive, with promising opportunities for companies specializing in innovative therapies and diagnostic tools.
Anaplastic Astrocytoma Industry: A Comprehensive Market Report (2019-2033)
This detailed report provides a comprehensive analysis of the Anaplastic Astrocytoma industry, encompassing market size, segmentation, competitive landscape, and future growth projections from 2019 to 2033. The study period covers historical data (2019-2024), a base year (2025), an estimated year (2025), and a forecast period (2025-2033). This report is essential for industry stakeholders, investors, researchers, and healthcare professionals seeking actionable insights into this critical area of oncology. The report incorporates high-impact keywords to enhance search visibility and provide maximum value to its users. All financial values are expressed in Millions.
Anaplastic Astrocytoma Industry Market Concentration & Innovation
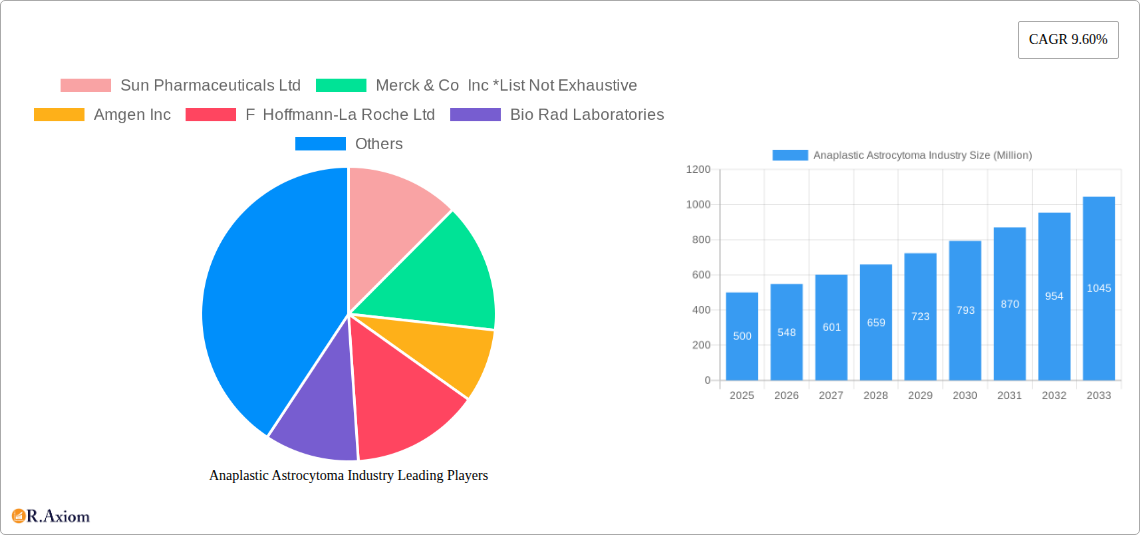
The Anaplastic Astrocytoma market exhibits a moderately concentrated landscape, with a few major players holding significant market share. The market share of the top five companies accounts for approximately xx% of the global revenue. Sun Pharmaceuticals Ltd, Merck & Co Inc, Amgen Inc, F Hoffmann-La Roche Ltd, and Pfizer Inc are some key players exhibiting considerable influence due to their extensive R&D efforts and established distribution networks. However, the market also encompasses numerous smaller companies and emerging biotech firms actively engaged in developing innovative treatments and therapies.
Innovation within the Anaplastic Astrocytoma treatment landscape is driven primarily by advancements in targeted therapies, immunotherapy, and radiation techniques. Regulatory frameworks such as the FDA approval process significantly influence the introduction of new drugs and therapies. Product substitutes are limited, emphasizing the importance of continuous innovation to improve treatment efficacy and patient outcomes. End-user trends, such as increasing demand for personalized medicine and minimally invasive procedures, further shape the market. Mergers and acquisitions (M&A) activities are frequently observed, reflecting the strategic consolidation and expansion efforts of major industry participants. The total value of M&A deals in the Anaplastic Astrocytoma industry during the study period is estimated at xx Million.
- Market Share: Top 5 Companies – xx% (2025)
- M&A Deal Value (2019-2024): xx Million
- Key Innovation Drivers: Targeted therapies, immunotherapy, radiation advancements.
Anaplastic Astrocytoma Industry Industry Trends & Insights
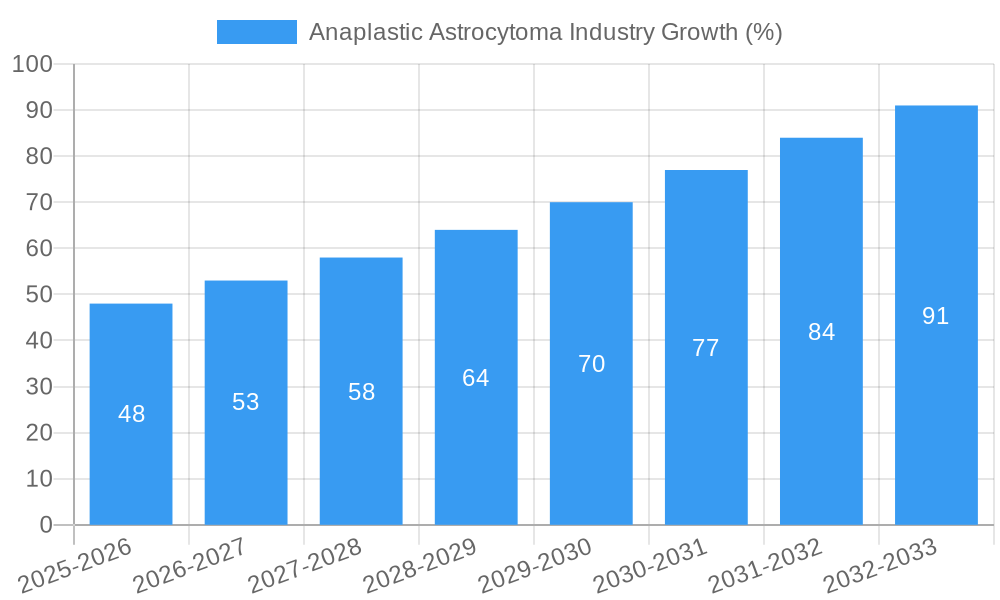
The Anaplastic Astrocytoma market is characterized by a significant growth trajectory, primarily fueled by increasing prevalence of the disease, rising healthcare expenditure, and the launch of innovative treatment modalities. The market is expected to register a Compound Annual Growth Rate (CAGR) of xx% during the forecast period (2025-2033). Market penetration of novel therapies, such as targeted drug therapies and immunotherapies, is expected to grow significantly, replacing conventional chemotherapy regimens in certain patient segments. Technological disruptions, such as advancements in genomic sequencing and artificial intelligence (AI)-driven drug discovery, are expected to accelerate innovation in the field. Consumer preferences are shifting towards personalized medicine approaches, demanding more targeted and less toxic treatment options. Competitive dynamics are intense, with leading pharmaceutical companies engaged in aggressive R&D and strategic collaborations to maintain their market position.
Dominant Markets & Segments in Anaplastic Astrocytoma Industry
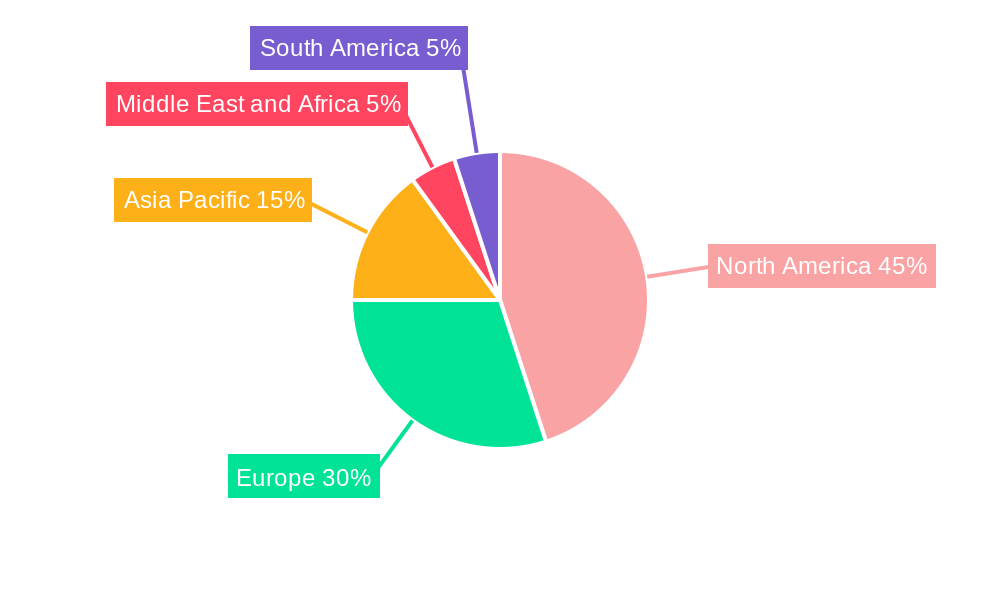
The North American region currently dominates the Anaplastic Astrocytoma market, driven by high healthcare expenditure, advanced infrastructure, and a significant patient population. Within the segment analysis:
- By Therapy: Chemotherapy remains the dominant therapy, but targeted drug therapy and radiation therapy segments are demonstrating faster growth due to their improved efficacy and reduced side effects. The targeted drug therapy segment is projected to exhibit the highest CAGR during the forecast period.
- By Type of Disease: Glioblastoma multiforme represents the largest segment due to its high prevalence. However, the Anaplastic Astrocytoma segment itself also holds substantial market value.
Key Drivers for North American Dominance:
- Advanced healthcare infrastructure
- High healthcare spending
- Extensive clinical research capabilities
- Strong regulatory support for novel therapies.
Anaplastic Astrocytoma Industry Product Developments
Recent product innovations in the Anaplastic Astrocytoma market include the development of novel targeted therapies and immunotherapies aimed at improving treatment efficacy and minimizing side effects. These advancements leverage breakthroughs in genomic understanding and personalized medicine approaches. The market is witnessing a shift toward therapies that offer greater precision and improved patient outcomes, leading to enhanced market competitiveness. Many companies are focusing on combination therapies to further enhance therapeutic effectiveness.
Report Scope & Segmentation Analysis
This report provides a detailed segmentation analysis of the Anaplastic Astrocytoma market by therapy (Chemotherapy, Targeted Drug Therapy, Radiation Therapy, Other Monoclonal Antibodies) and by type of disease (Glioblastoma Multiforme, Anaplastic Astrocytoma, Anaplastic Oligodendroglioma, Anaplastic Oligoastrocytoma, Other Types of Disease). Each segment is analyzed in terms of market size, growth projections, and competitive dynamics. The report projects significant growth across all segments, with targeted therapies and immunotherapies expected to outpace conventional chemotherapy in the coming years.
Key Drivers of Anaplastic Astrocytoma Industry Growth
Several factors are driving the growth of the Anaplastic Astrocytoma industry, including:
- Rising prevalence of Anaplastic Astrocytoma: The increasing incidence of brain tumors globally is a significant driver of market growth.
- Technological advancements: Developments in targeted therapies and immunotherapies are improving treatment outcomes and fueling market expansion.
- Increased healthcare spending: Higher healthcare expenditure in developed and emerging economies supports investment in novel therapies.
- Favorable regulatory environment: The supportive regulatory environment in many countries facilitates the approval and launch of new treatments.
Challenges in the Anaplastic Astrocytoma Industry Sector
The Anaplastic Astrocytoma industry faces several challenges, including:
- High cost of therapies: The high cost of novel therapies can limit patient access and affordability.
- Complex regulatory pathways: The stringent regulatory requirements for drug approvals can delay market entry for new treatments.
- Intense competition: The highly competitive market environment necessitates continuous innovation and efficient marketing strategies.
- Adverse effects of treatments: Side effects associated with some therapies can pose challenges for patients and healthcare providers.
Emerging Opportunities in Anaplastic Astrocytoma Industry
The Anaplastic Astrocytoma industry presents several emerging opportunities, such as:
- Personalized medicine: The use of genetic information to tailor treatment plans offers significant growth potential.
- Combination therapies: The development of combination therapies that enhance efficacy and reduce side effects is a promising area.
- Liquid biopsies: Liquid biopsies offer less invasive methods for disease monitoring and treatment response assessment.
- Expansion into emerging markets: Untapped markets in developing countries provide substantial opportunities for growth.
Leading Players in the Anaplastic Astrocytoma Industry Market
- Sun Pharmaceuticals Ltd
- Merck & Co Inc
- Amgen Inc
- F Hoffmann-La Roche Ltd
- Bio Rad Laboratories
- AbbVie Inc
- Arbor Pharmaceuticals
- Bristol-Myers Squibb Company
- Pfizer Inc
Key Developments in Anaplastic Astrocytoma Industry Industry
- March 2022: The Ivy Brain Tumor Center at the Barrow Neurological Institute in the US launched a Phase 0/Ib clinical trial of AstraZeneca's AZD1390 in recurrent grade IV glioma patients. This highlights ongoing efforts in developing novel treatment options for aggressive brain cancers.
- January 2023: Stanford University and The Invus Group formed a collaboration to develop treatments for glioblastoma. This collaboration represents a significant investment in research and development, reflecting the high unmet need for improved glioblastoma therapies.
Strategic Outlook for Anaplastic Astrocytoma Industry Market
The Anaplastic Astrocytoma market is poised for significant growth in the coming years, driven by the increasing prevalence of the disease, advancements in therapeutic approaches, and rising healthcare expenditure. Continued investment in R&D, focusing on personalized medicine and combination therapies, will be crucial for driving innovation and improving patient outcomes. Companies focusing on developing targeted therapies with minimal side effects and improved efficacy are likely to gain a competitive edge in this rapidly evolving market. Expansion into emerging markets will also contribute to substantial future growth.
Anaplastic Astrocytoma Industry Segmentation
-
1. Type of Disease
- 1.1. Glioblastoma Multiforme
- 1.2. Anaplastic Astrocytoma
- 1.3. Anaplastic Oligodendroglioma
- 1.4. Anaplastic Oligoastrocytoma
- 1.5. Other Types of Disease
-
2. Therapy
-
2.1. Chemotherapy
- 2.1.1. Temozolomide
- 2.1.2. Bevacizumab
- 2.1.3. Carmustine
- 2.1.4. Other Types of Chemotherapy
-
2.2. Targeted Drug Therapy
- 2.2.1. Epidermal Growth Factor Receptor (EGFR) Inhibitors
- 2.2.2. Other Monoclonal Antibodies
- 2.3. Radiation Therapy
-
2.1. Chemotherapy
Anaplastic Astrocytoma Industry Segmentation By Geography
-
1. North America
- 1.1. United States
- 1.2. Canada
- 1.3. Mexico
-
2. Europe
- 2.1. Germany
- 2.2. United Kingdom
- 2.3. France
- 2.4. Italy
- 2.5. Spain
- 2.6. Rest of Europe
-
3. Asia Pacific
- 3.1. China
- 3.2. Japan
- 3.3. India
- 3.4. Australia
- 3.5. South Korea
- 3.6. Rest of Asia Pacific
-
4. Middle East and Africa
- 4.1. GCC
- 4.2. South Africa
- 4.3. Rest of Middle East and Africa
-
5. South America
- 5.1. Brazil
- 5.2. Argentina
- 5.3. Rest of South America
Anaplastic Astrocytoma Industry REPORT HIGHLIGHTS
| Aspects | Details |
|---|---|
| Study Period | 2019-2033 |
| Base Year | 2024 |
| Estimated Year | 2025 |
| Forecast Period | 2025-2033 |
| Historical Period | 2019-2024 |
| Growth Rate | CAGR of 9.60% from 2019-2033 |
| Segmentation |
|
Table of Contents
- 1. Introduction
- 1.1. Research Scope
- 1.2. Market Segmentation
- 1.3. Research Methodology
- 1.4. Definitions and Assumptions
- 2. Executive Summary
- 2.1. Introduction
- 3. Market Dynamics
- 3.1. Introduction
- 3.2. Market Drivers
- 3.2.1. High Burden of Brain Cancer and Malignant Gliomas; Rising Funding for Research and Development
- 3.3. Market Restrains
- 3.3.1. Diminishing Preference for Chemotherapy; Low Approval Rates for Novel Therapeutics for Glioma
- 3.4. Market Trends
- 3.4.1. The Glioblastoma Multiforme Segment is Expected to Hold a Significant Growth Over The Forecast Period
- 4. Market Factor Analysis
- 4.1. Porters Five Forces
- 4.2. Supply/Value Chain
- 4.3. PESTEL analysis
- 4.4. Market Entropy
- 4.5. Patent/Trademark Analysis
- 5. Global Anaplastic Astrocytoma Industry Analysis, Insights and Forecast, 2019-2031
- 5.1. Market Analysis, Insights and Forecast - by Type of Disease
- 5.1.1. Glioblastoma Multiforme
- 5.1.2. Anaplastic Astrocytoma
- 5.1.3. Anaplastic Oligodendroglioma
- 5.1.4. Anaplastic Oligoastrocytoma
- 5.1.5. Other Types of Disease
- 5.2. Market Analysis, Insights and Forecast - by Therapy
- 5.2.1. Chemotherapy
- 5.2.1.1. Temozolomide
- 5.2.1.2. Bevacizumab
- 5.2.1.3. Carmustine
- 5.2.1.4. Other Types of Chemotherapy
- 5.2.2. Targeted Drug Therapy
- 5.2.2.1. Epidermal Growth Factor Receptor (EGFR) Inhibitors
- 5.2.2.2. Other Monoclonal Antibodies
- 5.2.3. Radiation Therapy
- 5.2.1. Chemotherapy
- 5.3. Market Analysis, Insights and Forecast - by Region
- 5.3.1. North America
- 5.3.2. Europe
- 5.3.3. Asia Pacific
- 5.3.4. Middle East and Africa
- 5.3.5. South America
- 5.1. Market Analysis, Insights and Forecast - by Type of Disease
- 6. North America Anaplastic Astrocytoma Industry Analysis, Insights and Forecast, 2019-2031
- 6.1. Market Analysis, Insights and Forecast - by Type of Disease
- 6.1.1. Glioblastoma Multiforme
- 6.1.2. Anaplastic Astrocytoma
- 6.1.3. Anaplastic Oligodendroglioma
- 6.1.4. Anaplastic Oligoastrocytoma
- 6.1.5. Other Types of Disease
- 6.2. Market Analysis, Insights and Forecast - by Therapy
- 6.2.1. Chemotherapy
- 6.2.1.1. Temozolomide
- 6.2.1.2. Bevacizumab
- 6.2.1.3. Carmustine
- 6.2.1.4. Other Types of Chemotherapy
- 6.2.2. Targeted Drug Therapy
- 6.2.2.1. Epidermal Growth Factor Receptor (EGFR) Inhibitors
- 6.2.2.2. Other Monoclonal Antibodies
- 6.2.3. Radiation Therapy
- 6.2.1. Chemotherapy
- 6.1. Market Analysis, Insights and Forecast - by Type of Disease
- 7. Europe Anaplastic Astrocytoma Industry Analysis, Insights and Forecast, 2019-2031
- 7.1. Market Analysis, Insights and Forecast - by Type of Disease
- 7.1.1. Glioblastoma Multiforme
- 7.1.2. Anaplastic Astrocytoma
- 7.1.3. Anaplastic Oligodendroglioma
- 7.1.4. Anaplastic Oligoastrocytoma
- 7.1.5. Other Types of Disease
- 7.2. Market Analysis, Insights and Forecast - by Therapy
- 7.2.1. Chemotherapy
- 7.2.1.1. Temozolomide
- 7.2.1.2. Bevacizumab
- 7.2.1.3. Carmustine
- 7.2.1.4. Other Types of Chemotherapy
- 7.2.2. Targeted Drug Therapy
- 7.2.2.1. Epidermal Growth Factor Receptor (EGFR) Inhibitors
- 7.2.2.2. Other Monoclonal Antibodies
- 7.2.3. Radiation Therapy
- 7.2.1. Chemotherapy
- 7.1. Market Analysis, Insights and Forecast - by Type of Disease
- 8. Asia Pacific Anaplastic Astrocytoma Industry Analysis, Insights and Forecast, 2019-2031
- 8.1. Market Analysis, Insights and Forecast - by Type of Disease
- 8.1.1. Glioblastoma Multiforme
- 8.1.2. Anaplastic Astrocytoma
- 8.1.3. Anaplastic Oligodendroglioma
- 8.1.4. Anaplastic Oligoastrocytoma
- 8.1.5. Other Types of Disease
- 8.2. Market Analysis, Insights and Forecast - by Therapy
- 8.2.1. Chemotherapy
- 8.2.1.1. Temozolomide
- 8.2.1.2. Bevacizumab
- 8.2.1.3. Carmustine
- 8.2.1.4. Other Types of Chemotherapy
- 8.2.2. Targeted Drug Therapy
- 8.2.2.1. Epidermal Growth Factor Receptor (EGFR) Inhibitors
- 8.2.2.2. Other Monoclonal Antibodies
- 8.2.3. Radiation Therapy
- 8.2.1. Chemotherapy
- 8.1. Market Analysis, Insights and Forecast - by Type of Disease
- 9. Middle East and Africa Anaplastic Astrocytoma Industry Analysis, Insights and Forecast, 2019-2031
- 9.1. Market Analysis, Insights and Forecast - by Type of Disease
- 9.1.1. Glioblastoma Multiforme
- 9.1.2. Anaplastic Astrocytoma
- 9.1.3. Anaplastic Oligodendroglioma
- 9.1.4. Anaplastic Oligoastrocytoma
- 9.1.5. Other Types of Disease
- 9.2. Market Analysis, Insights and Forecast - by Therapy
- 9.2.1. Chemotherapy
- 9.2.1.1. Temozolomide
- 9.2.1.2. Bevacizumab
- 9.2.1.3. Carmustine
- 9.2.1.4. Other Types of Chemotherapy
- 9.2.2. Targeted Drug Therapy
- 9.2.2.1. Epidermal Growth Factor Receptor (EGFR) Inhibitors
- 9.2.2.2. Other Monoclonal Antibodies
- 9.2.3. Radiation Therapy
- 9.2.1. Chemotherapy
- 9.1. Market Analysis, Insights and Forecast - by Type of Disease
- 10. South America Anaplastic Astrocytoma Industry Analysis, Insights and Forecast, 2019-2031
- 10.1. Market Analysis, Insights and Forecast - by Type of Disease
- 10.1.1. Glioblastoma Multiforme
- 10.1.2. Anaplastic Astrocytoma
- 10.1.3. Anaplastic Oligodendroglioma
- 10.1.4. Anaplastic Oligoastrocytoma
- 10.1.5. Other Types of Disease
- 10.2. Market Analysis, Insights and Forecast - by Therapy
- 10.2.1. Chemotherapy
- 10.2.1.1. Temozolomide
- 10.2.1.2. Bevacizumab
- 10.2.1.3. Carmustine
- 10.2.1.4. Other Types of Chemotherapy
- 10.2.2. Targeted Drug Therapy
- 10.2.2.1. Epidermal Growth Factor Receptor (EGFR) Inhibitors
- 10.2.2.2. Other Monoclonal Antibodies
- 10.2.3. Radiation Therapy
- 10.2.1. Chemotherapy
- 10.1. Market Analysis, Insights and Forecast - by Type of Disease
- 11. North America Anaplastic Astrocytoma Industry Analysis, Insights and Forecast, 2019-2031
- 11.1. Market Analysis, Insights and Forecast - By Country/Sub-region
- 11.1.1 United States
- 11.1.2 Canada
- 11.1.3 Mexico
- 12. Europe Anaplastic Astrocytoma Industry Analysis, Insights and Forecast, 2019-2031
- 12.1. Market Analysis, Insights and Forecast - By Country/Sub-region
- 12.1.1 Germany
- 12.1.2 United Kingdom
- 12.1.3 France
- 12.1.4 Italy
- 12.1.5 Spain
- 12.1.6 Rest of Europe
- 13. Asia Pacific Anaplastic Astrocytoma Industry Analysis, Insights and Forecast, 2019-2031
- 13.1. Market Analysis, Insights and Forecast - By Country/Sub-region
- 13.1.1 China
- 13.1.2 Japan
- 13.1.3 India
- 13.1.4 Australia
- 13.1.5 South Korea
- 13.1.6 Rest of Asia Pacific
- 14. Middle East and Africa Anaplastic Astrocytoma Industry Analysis, Insights and Forecast, 2019-2031
- 14.1. Market Analysis, Insights and Forecast - By Country/Sub-region
- 14.1.1 GCC
- 14.1.2 South Africa
- 14.1.3 Rest of Middle East and Africa
- 15. South America Anaplastic Astrocytoma Industry Analysis, Insights and Forecast, 2019-2031
- 15.1. Market Analysis, Insights and Forecast - By Country/Sub-region
- 15.1.1 Brazil
- 15.1.2 Argentina
- 15.1.3 Rest of South America
- 16. Competitive Analysis
- 16.1. Global Market Share Analysis 2024
- 16.2. Company Profiles
- 16.2.1 Sun Pharmaceuticals Ltd
- 16.2.1.1. Overview
- 16.2.1.2. Products
- 16.2.1.3. SWOT Analysis
- 16.2.1.4. Recent Developments
- 16.2.1.5. Financials (Based on Availability)
- 16.2.2 Merck & Co Inc *List Not Exhaustive
- 16.2.2.1. Overview
- 16.2.2.2. Products
- 16.2.2.3. SWOT Analysis
- 16.2.2.4. Recent Developments
- 16.2.2.5. Financials (Based on Availability)
- 16.2.3 Amgen Inc
- 16.2.3.1. Overview
- 16.2.3.2. Products
- 16.2.3.3. SWOT Analysis
- 16.2.3.4. Recent Developments
- 16.2.3.5. Financials (Based on Availability)
- 16.2.4 F Hoffmann-La Roche Ltd
- 16.2.4.1. Overview
- 16.2.4.2. Products
- 16.2.4.3. SWOT Analysis
- 16.2.4.4. Recent Developments
- 16.2.4.5. Financials (Based on Availability)
- 16.2.5 Bio Rad Laboratories
- 16.2.5.1. Overview
- 16.2.5.2. Products
- 16.2.5.3. SWOT Analysis
- 16.2.5.4. Recent Developments
- 16.2.5.5. Financials (Based on Availability)
- 16.2.6 AbbVie Inc
- 16.2.6.1. Overview
- 16.2.6.2. Products
- 16.2.6.3. SWOT Analysis
- 16.2.6.4. Recent Developments
- 16.2.6.5. Financials (Based on Availability)
- 16.2.7 Arbor Pharmaceuticals
- 16.2.7.1. Overview
- 16.2.7.2. Products
- 16.2.7.3. SWOT Analysis
- 16.2.7.4. Recent Developments
- 16.2.7.5. Financials (Based on Availability)
- 16.2.8 Bristol-Myers Squibb Company
- 16.2.8.1. Overview
- 16.2.8.2. Products
- 16.2.8.3. SWOT Analysis
- 16.2.8.4. Recent Developments
- 16.2.8.5. Financials (Based on Availability)
- 16.2.9 Pfizer Inc
- 16.2.9.1. Overview
- 16.2.9.2. Products
- 16.2.9.3. SWOT Analysis
- 16.2.9.4. Recent Developments
- 16.2.9.5. Financials (Based on Availability)
- 16.2.1 Sun Pharmaceuticals Ltd
List of Figures
- Figure 1: Global Anaplastic Astrocytoma Industry Revenue Breakdown (Million, %) by Region 2024 & 2032
- Figure 2: North America Anaplastic Astrocytoma Industry Revenue (Million), by Country 2024 & 2032
- Figure 3: North America Anaplastic Astrocytoma Industry Revenue Share (%), by Country 2024 & 2032
- Figure 4: Europe Anaplastic Astrocytoma Industry Revenue (Million), by Country 2024 & 2032
- Figure 5: Europe Anaplastic Astrocytoma Industry Revenue Share (%), by Country 2024 & 2032
- Figure 6: Asia Pacific Anaplastic Astrocytoma Industry Revenue (Million), by Country 2024 & 2032
- Figure 7: Asia Pacific Anaplastic Astrocytoma Industry Revenue Share (%), by Country 2024 & 2032
- Figure 8: Middle East and Africa Anaplastic Astrocytoma Industry Revenue (Million), by Country 2024 & 2032
- Figure 9: Middle East and Africa Anaplastic Astrocytoma Industry Revenue Share (%), by Country 2024 & 2032
- Figure 10: South America Anaplastic Astrocytoma Industry Revenue (Million), by Country 2024 & 2032
- Figure 11: South America Anaplastic Astrocytoma Industry Revenue Share (%), by Country 2024 & 2032
- Figure 12: North America Anaplastic Astrocytoma Industry Revenue (Million), by Type of Disease 2024 & 2032
- Figure 13: North America Anaplastic Astrocytoma Industry Revenue Share (%), by Type of Disease 2024 & 2032
- Figure 14: North America Anaplastic Astrocytoma Industry Revenue (Million), by Therapy 2024 & 2032
- Figure 15: North America Anaplastic Astrocytoma Industry Revenue Share (%), by Therapy 2024 & 2032
- Figure 16: North America Anaplastic Astrocytoma Industry Revenue (Million), by Country 2024 & 2032
- Figure 17: North America Anaplastic Astrocytoma Industry Revenue Share (%), by Country 2024 & 2032
- Figure 18: Europe Anaplastic Astrocytoma Industry Revenue (Million), by Type of Disease 2024 & 2032
- Figure 19: Europe Anaplastic Astrocytoma Industry Revenue Share (%), by Type of Disease 2024 & 2032
- Figure 20: Europe Anaplastic Astrocytoma Industry Revenue (Million), by Therapy 2024 & 2032
- Figure 21: Europe Anaplastic Astrocytoma Industry Revenue Share (%), by Therapy 2024 & 2032
- Figure 22: Europe Anaplastic Astrocytoma Industry Revenue (Million), by Country 2024 & 2032
- Figure 23: Europe Anaplastic Astrocytoma Industry Revenue Share (%), by Country 2024 & 2032
- Figure 24: Asia Pacific Anaplastic Astrocytoma Industry Revenue (Million), by Type of Disease 2024 & 2032
- Figure 25: Asia Pacific Anaplastic Astrocytoma Industry Revenue Share (%), by Type of Disease 2024 & 2032
- Figure 26: Asia Pacific Anaplastic Astrocytoma Industry Revenue (Million), by Therapy 2024 & 2032
- Figure 27: Asia Pacific Anaplastic Astrocytoma Industry Revenue Share (%), by Therapy 2024 & 2032
- Figure 28: Asia Pacific Anaplastic Astrocytoma Industry Revenue (Million), by Country 2024 & 2032
- Figure 29: Asia Pacific Anaplastic Astrocytoma Industry Revenue Share (%), by Country 2024 & 2032
- Figure 30: Middle East and Africa Anaplastic Astrocytoma Industry Revenue (Million), by Type of Disease 2024 & 2032
- Figure 31: Middle East and Africa Anaplastic Astrocytoma Industry Revenue Share (%), by Type of Disease 2024 & 2032
- Figure 32: Middle East and Africa Anaplastic Astrocytoma Industry Revenue (Million), by Therapy 2024 & 2032
- Figure 33: Middle East and Africa Anaplastic Astrocytoma Industry Revenue Share (%), by Therapy 2024 & 2032
- Figure 34: Middle East and Africa Anaplastic Astrocytoma Industry Revenue (Million), by Country 2024 & 2032
- Figure 35: Middle East and Africa Anaplastic Astrocytoma Industry Revenue Share (%), by Country 2024 & 2032
- Figure 36: South America Anaplastic Astrocytoma Industry Revenue (Million), by Type of Disease 2024 & 2032
- Figure 37: South America Anaplastic Astrocytoma Industry Revenue Share (%), by Type of Disease 2024 & 2032
- Figure 38: South America Anaplastic Astrocytoma Industry Revenue (Million), by Therapy 2024 & 2032
- Figure 39: South America Anaplastic Astrocytoma Industry Revenue Share (%), by Therapy 2024 & 2032
- Figure 40: South America Anaplastic Astrocytoma Industry Revenue (Million), by Country 2024 & 2032
- Figure 41: South America Anaplastic Astrocytoma Industry Revenue Share (%), by Country 2024 & 2032
List of Tables
- Table 1: Global Anaplastic Astrocytoma Industry Revenue Million Forecast, by Region 2019 & 2032
- Table 2: Global Anaplastic Astrocytoma Industry Revenue Million Forecast, by Type of Disease 2019 & 2032
- Table 3: Global Anaplastic Astrocytoma Industry Revenue Million Forecast, by Therapy 2019 & 2032
- Table 4: Global Anaplastic Astrocytoma Industry Revenue Million Forecast, by Region 2019 & 2032
- Table 5: Global Anaplastic Astrocytoma Industry Revenue Million Forecast, by Country 2019 & 2032
- Table 6: United States Anaplastic Astrocytoma Industry Revenue (Million) Forecast, by Application 2019 & 2032
- Table 7: Canada Anaplastic Astrocytoma Industry Revenue (Million) Forecast, by Application 2019 & 2032
- Table 8: Mexico Anaplastic Astrocytoma Industry Revenue (Million) Forecast, by Application 2019 & 2032
- Table 9: Global Anaplastic Astrocytoma Industry Revenue Million Forecast, by Country 2019 & 2032
- Table 10: Germany Anaplastic Astrocytoma Industry Revenue (Million) Forecast, by Application 2019 & 2032
- Table 11: United Kingdom Anaplastic Astrocytoma Industry Revenue (Million) Forecast, by Application 2019 & 2032
- Table 12: France Anaplastic Astrocytoma Industry Revenue (Million) Forecast, by Application 2019 & 2032
- Table 13: Italy Anaplastic Astrocytoma Industry Revenue (Million) Forecast, by Application 2019 & 2032
- Table 14: Spain Anaplastic Astrocytoma Industry Revenue (Million) Forecast, by Application 2019 & 2032
- Table 15: Rest of Europe Anaplastic Astrocytoma Industry Revenue (Million) Forecast, by Application 2019 & 2032
- Table 16: Global Anaplastic Astrocytoma Industry Revenue Million Forecast, by Country 2019 & 2032
- Table 17: China Anaplastic Astrocytoma Industry Revenue (Million) Forecast, by Application 2019 & 2032
- Table 18: Japan Anaplastic Astrocytoma Industry Revenue (Million) Forecast, by Application 2019 & 2032
- Table 19: India Anaplastic Astrocytoma Industry Revenue (Million) Forecast, by Application 2019 & 2032
- Table 20: Australia Anaplastic Astrocytoma Industry Revenue (Million) Forecast, by Application 2019 & 2032
- Table 21: South Korea Anaplastic Astrocytoma Industry Revenue (Million) Forecast, by Application 2019 & 2032
- Table 22: Rest of Asia Pacific Anaplastic Astrocytoma Industry Revenue (Million) Forecast, by Application 2019 & 2032
- Table 23: Global Anaplastic Astrocytoma Industry Revenue Million Forecast, by Country 2019 & 2032
- Table 24: GCC Anaplastic Astrocytoma Industry Revenue (Million) Forecast, by Application 2019 & 2032
- Table 25: South Africa Anaplastic Astrocytoma Industry Revenue (Million) Forecast, by Application 2019 & 2032
- Table 26: Rest of Middle East and Africa Anaplastic Astrocytoma Industry Revenue (Million) Forecast, by Application 2019 & 2032
- Table 27: Global Anaplastic Astrocytoma Industry Revenue Million Forecast, by Country 2019 & 2032
- Table 28: Brazil Anaplastic Astrocytoma Industry Revenue (Million) Forecast, by Application 2019 & 2032
- Table 29: Argentina Anaplastic Astrocytoma Industry Revenue (Million) Forecast, by Application 2019 & 2032
- Table 30: Rest of South America Anaplastic Astrocytoma Industry Revenue (Million) Forecast, by Application 2019 & 2032
- Table 31: Global Anaplastic Astrocytoma Industry Revenue Million Forecast, by Type of Disease 2019 & 2032
- Table 32: Global Anaplastic Astrocytoma Industry Revenue Million Forecast, by Therapy 2019 & 2032
- Table 33: Global Anaplastic Astrocytoma Industry Revenue Million Forecast, by Country 2019 & 2032
- Table 34: United States Anaplastic Astrocytoma Industry Revenue (Million) Forecast, by Application 2019 & 2032
- Table 35: Canada Anaplastic Astrocytoma Industry Revenue (Million) Forecast, by Application 2019 & 2032
- Table 36: Mexico Anaplastic Astrocytoma Industry Revenue (Million) Forecast, by Application 2019 & 2032
- Table 37: Global Anaplastic Astrocytoma Industry Revenue Million Forecast, by Type of Disease 2019 & 2032
- Table 38: Global Anaplastic Astrocytoma Industry Revenue Million Forecast, by Therapy 2019 & 2032
- Table 39: Global Anaplastic Astrocytoma Industry Revenue Million Forecast, by Country 2019 & 2032
- Table 40: Germany Anaplastic Astrocytoma Industry Revenue (Million) Forecast, by Application 2019 & 2032
- Table 41: United Kingdom Anaplastic Astrocytoma Industry Revenue (Million) Forecast, by Application 2019 & 2032
- Table 42: France Anaplastic Astrocytoma Industry Revenue (Million) Forecast, by Application 2019 & 2032
- Table 43: Italy Anaplastic Astrocytoma Industry Revenue (Million) Forecast, by Application 2019 & 2032
- Table 44: Spain Anaplastic Astrocytoma Industry Revenue (Million) Forecast, by Application 2019 & 2032
- Table 45: Rest of Europe Anaplastic Astrocytoma Industry Revenue (Million) Forecast, by Application 2019 & 2032
- Table 46: Global Anaplastic Astrocytoma Industry Revenue Million Forecast, by Type of Disease 2019 & 2032
- Table 47: Global Anaplastic Astrocytoma Industry Revenue Million Forecast, by Therapy 2019 & 2032
- Table 48: Global Anaplastic Astrocytoma Industry Revenue Million Forecast, by Country 2019 & 2032
- Table 49: China Anaplastic Astrocytoma Industry Revenue (Million) Forecast, by Application 2019 & 2032
- Table 50: Japan Anaplastic Astrocytoma Industry Revenue (Million) Forecast, by Application 2019 & 2032
- Table 51: India Anaplastic Astrocytoma Industry Revenue (Million) Forecast, by Application 2019 & 2032
- Table 52: Australia Anaplastic Astrocytoma Industry Revenue (Million) Forecast, by Application 2019 & 2032
- Table 53: South Korea Anaplastic Astrocytoma Industry Revenue (Million) Forecast, by Application 2019 & 2032
- Table 54: Rest of Asia Pacific Anaplastic Astrocytoma Industry Revenue (Million) Forecast, by Application 2019 & 2032
- Table 55: Global Anaplastic Astrocytoma Industry Revenue Million Forecast, by Type of Disease 2019 & 2032
- Table 56: Global Anaplastic Astrocytoma Industry Revenue Million Forecast, by Therapy 2019 & 2032
- Table 57: Global Anaplastic Astrocytoma Industry Revenue Million Forecast, by Country 2019 & 2032
- Table 58: GCC Anaplastic Astrocytoma Industry Revenue (Million) Forecast, by Application 2019 & 2032
- Table 59: South Africa Anaplastic Astrocytoma Industry Revenue (Million) Forecast, by Application 2019 & 2032
- Table 60: Rest of Middle East and Africa Anaplastic Astrocytoma Industry Revenue (Million) Forecast, by Application 2019 & 2032
- Table 61: Global Anaplastic Astrocytoma Industry Revenue Million Forecast, by Type of Disease 2019 & 2032
- Table 62: Global Anaplastic Astrocytoma Industry Revenue Million Forecast, by Therapy 2019 & 2032
- Table 63: Global Anaplastic Astrocytoma Industry Revenue Million Forecast, by Country 2019 & 2032
- Table 64: Brazil Anaplastic Astrocytoma Industry Revenue (Million) Forecast, by Application 2019 & 2032
- Table 65: Argentina Anaplastic Astrocytoma Industry Revenue (Million) Forecast, by Application 2019 & 2032
- Table 66: Rest of South America Anaplastic Astrocytoma Industry Revenue (Million) Forecast, by Application 2019 & 2032
Frequently Asked Questions
1. What is the projected Compound Annual Growth Rate (CAGR) of the Anaplastic Astrocytoma Industry?
The projected CAGR is approximately 9.60%.
2. Which companies are prominent players in the Anaplastic Astrocytoma Industry?
Key companies in the market include Sun Pharmaceuticals Ltd, Merck & Co Inc *List Not Exhaustive, Amgen Inc, F Hoffmann-La Roche Ltd, Bio Rad Laboratories, AbbVie Inc, Arbor Pharmaceuticals, Bristol-Myers Squibb Company, Pfizer Inc.
3. What are the main segments of the Anaplastic Astrocytoma Industry?
The market segments include Type of Disease, Therapy.
4. Can you provide details about the market size?
The market size is estimated to be USD XX Million as of 2022.
5. What are some drivers contributing to market growth?
High Burden of Brain Cancer and Malignant Gliomas; Rising Funding for Research and Development.
6. What are the notable trends driving market growth?
The Glioblastoma Multiforme Segment is Expected to Hold a Significant Growth Over The Forecast Period.
7. Are there any restraints impacting market growth?
Diminishing Preference for Chemotherapy; Low Approval Rates for Novel Therapeutics for Glioma.
8. Can you provide examples of recent developments in the market?
January 2023: Stanford University and The Invus Group, an investment firm, formed a collaboration to develop treatments for glioblastoma, a type of brain cancer. The collaboration between Stanford University and the Invus Group will enable the development of medication to treat glioblastoma.
9. What pricing options are available for accessing the report?
Pricing options include single-user, multi-user, and enterprise licenses priced at USD 4750, USD 5250, and USD 8750 respectively.
10. Is the market size provided in terms of value or volume?
The market size is provided in terms of value, measured in Million.
11. Are there any specific market keywords associated with the report?
Yes, the market keyword associated with the report is "Anaplastic Astrocytoma Industry," which aids in identifying and referencing the specific market segment covered.
12. How do I determine which pricing option suits my needs best?
The pricing options vary based on user requirements and access needs. Individual users may opt for single-user licenses, while businesses requiring broader access may choose multi-user or enterprise licenses for cost-effective access to the report.
13. Are there any additional resources or data provided in the Anaplastic Astrocytoma Industry report?
While the report offers comprehensive insights, it's advisable to review the specific contents or supplementary materials provided to ascertain if additional resources or data are available.
14. How can I stay updated on further developments or reports in the Anaplastic Astrocytoma Industry?
To stay informed about further developments, trends, and reports in the Anaplastic Astrocytoma Industry, consider subscribing to industry newsletters, following relevant companies and organizations, or regularly checking reputable industry news sources and publications.
Methodology
Step 1 - Identification of Relevant Samples Size from Population Database


Step 2 - Approaches for Defining Global Market Size (Value, Volume* & Price*)

Note*: In applicable scenarios
Step 3 - Data Sources
Primary Research
- Web Analytics
- Survey Reports
- Research Institute
- Latest Research Reports
- Opinion Leaders
Secondary Research
- Annual Reports
- White Paper
- Latest Press Release
- Industry Association
- Paid Database
- Investor Presentations

Step 4 - Data Triangulation
Involves using different sources of information in order to increase the validity of a study
These sources are likely to be stakeholders in a program - participants, other researchers, program staff, other community members, and so on.
Then we put all data in single framework & apply various statistical tools to find out the dynamic on the market.
During the analysis stage, feedback from the stakeholder groups would be compared to determine areas of agreement as well as areas of divergence


