

Key Insights
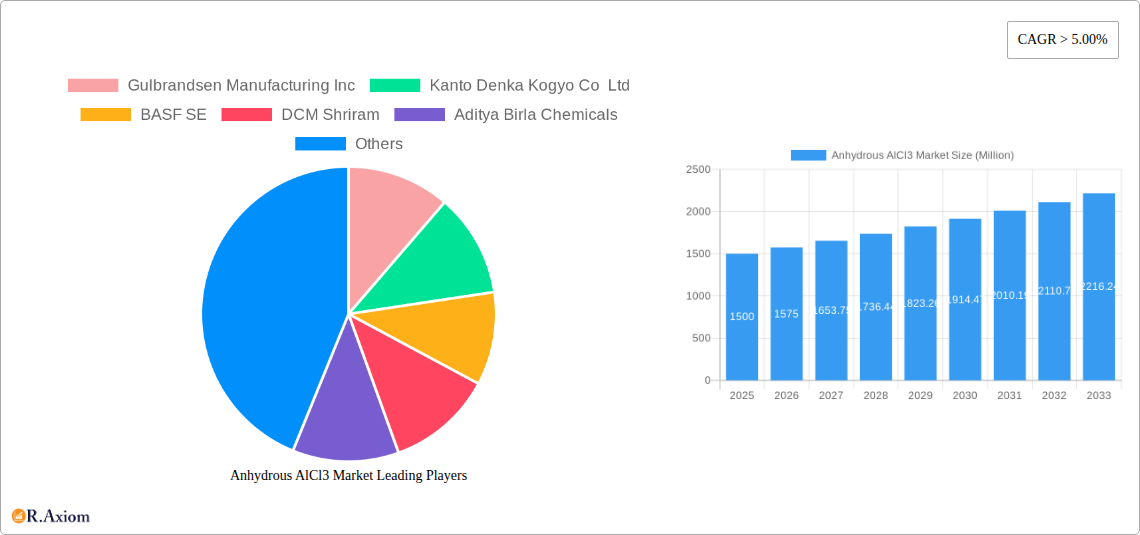
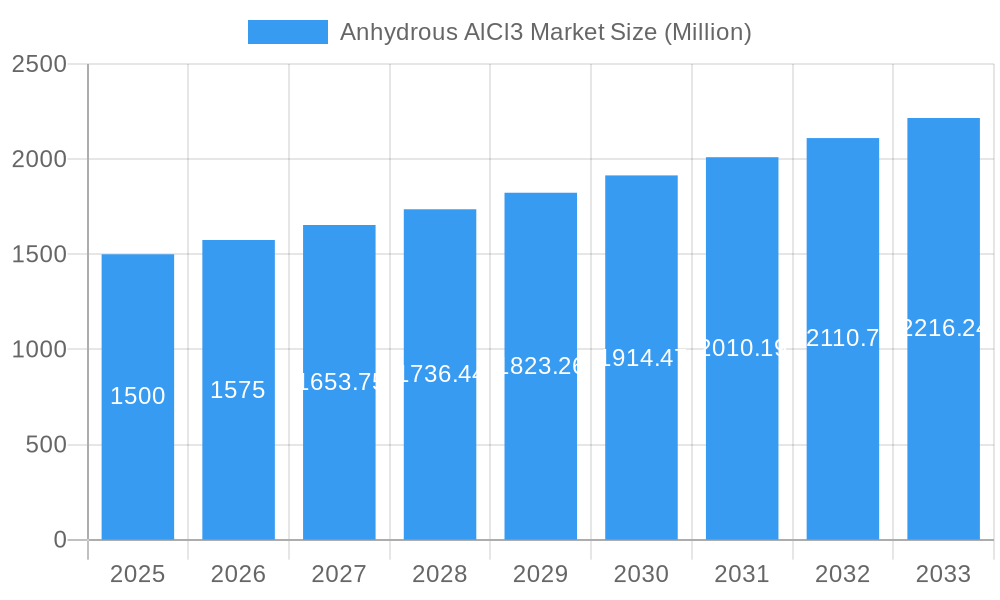
The anhydrous aluminum chloride (Anhydrous AlCl3) market is experiencing robust growth, driven by increasing demand across diverse applications. The market's compound annual growth rate (CAGR) exceeding 5% signifies a consistently expanding market size. Key application segments include pharmaceuticals, where Anhydrous AlCl3 serves as a catalyst and reagent in various synthesis processes; pesticides, contributing to the production of effective insecticides and herbicides; and chemical manufacturing, playing a crucial role in alkylation and isomerization reactions. The pigments industry utilizes Anhydrous AlCl3 for colorant production, while other applications encompass diverse sectors. The granular and crystalline forms are prevalent, reflecting diverse processing and application needs. Geographically, the Asia-Pacific region, particularly China and India, is a significant market driver, fueled by rapid industrialization and substantial chemical production. North America and Europe also contribute significantly, with established chemical industries and stringent environmental regulations driving innovation and adoption of efficient and high-quality Anhydrous AlCl3. However, fluctuations in raw material prices and stringent environmental regulations pose challenges to market growth.
Anhydrous AlCl3 Market Market Size (In Billion)
The competitive landscape features a mix of established multinational corporations like BASF SE and smaller specialized manufacturers. These companies are actively engaged in research and development to enhance product quality, explore new applications, and address environmental concerns. The forecast period (2025-2033) anticipates continued market expansion driven by increasing demand from emerging economies and technological advancements leading to more efficient and sustainable Anhydrous AlCl3 production and utilization. Strategic partnerships and collaborations among industry players will also play a role in shaping the market's trajectory. Ongoing innovations in catalyst technology and the development of eco-friendly production methods will further drive market growth. The market's future hinges on addressing environmental concerns, optimizing production processes, and adapting to evolving regulatory landscapes.
Anhydrous AlCl3 Market Company Market Share
Anhydrous AlCl3 Market: A Comprehensive Market Report (2019-2033)
This detailed report provides a comprehensive analysis of the Anhydrous AlCl3 market, offering actionable insights for industry stakeholders. The study covers the period from 2019 to 2033, with 2025 serving as the base and estimated year. The report segments the market by application (Pharmaceuticals, Pesticides, Chemical Manufacturing, Pigments, Other Applications) and form (Powder, Granules, Crystals), providing granular market sizing and growth projections. Key players such as Gulbrandsen Manufacturing Inc, Kanto Denka Kogyo Co Ltd, BASF SE, DCM Shriram, Aditya Birla Chemicals, Base Metal Group, Nippon Light Metal Company Ltd, Gujarat Alkali & Chemicals Ltd, Upra Chem Pvt Ltd, Shandong Kunbao New Materials Group Co Ltd, and Anmol Chloro Chem are analyzed for their market share, competitive strategies, and future outlook.
Anhydrous AlCl3 Market Concentration & Innovation
This section analyzes the competitive landscape of the anhydrous AlCl3 market, examining market concentration, innovation drivers, regulatory frameworks, product substitutes, end-user trends, and M&A activities. The market is moderately concentrated, with the top five players holding an estimated xx% market share in 2025. Innovation is driven by the need for higher purity AlCl3 and more efficient production processes. Stringent environmental regulations are shaping the industry, pushing for sustainable manufacturing practices. The key substitutes are other Lewis acids, but AlCl3 maintains its dominance due to its cost-effectiveness and versatility. End-user trends indicate a growing demand from the pharmaceutical and chemical manufacturing sectors. M&A activity in the past five years has been relatively low, with only xx deals valued at approximately $xx Million.
- Market Concentration: Moderately concentrated, top 5 players holding xx% market share (2025).
- Innovation Drivers: Higher purity requirements, efficient production processes, and sustainable manufacturing.
- Regulatory Framework: Stringent environmental regulations driving sustainable practices.
- Product Substitutes: Other Lewis acids, but AlCl3 retains dominance.
- End-User Trends: Growing demand from pharmaceutical and chemical manufacturing.
- M&A Activity: Low activity in recent years; xx deals totaling approximately $xx Million.
Anhydrous AlCl3 Market Industry Trends & Insights
The Anhydrous AlCl3 market is experiencing steady growth, driven by increasing demand from various industries. The CAGR for the forecast period (2025-2033) is estimated at xx%. Market penetration in key regions such as Asia Pacific and North America is high, while emerging economies are showing significant growth potential. Technological advancements in production processes and applications are contributing to market expansion. Consumer preferences are increasingly focused on sustainability and high-quality products. Competitive dynamics are intense, with companies focusing on innovation, cost optimization, and strategic partnerships.
Dominant Markets & Segments in Anhydrous AlCl3 Market
The Asia Pacific region dominates the Anhydrous AlCl3 market, driven by robust industrial growth and a large manufacturing base. China and India are the key contributors to regional growth. The Chemical Manufacturing segment holds the largest market share in terms of application, followed by the Pharmaceuticals sector. Powder form dominates the market due to its ease of handling and versatility.
- Leading Region: Asia Pacific (China and India are key contributors).
- Leading Application Segment: Chemical Manufacturing.
- Leading Form Segment: Powder.
- Key Drivers for Asia Pacific: Rapid industrialization, strong economic growth, and increasing manufacturing output.
- Key Drivers for Chemical Manufacturing: Growing demand for various chemical intermediates and catalysts.
- Key Drivers for Powder Form: Ease of handling and broad applicability.
Anhydrous AlCl3 Market Product Developments
Recent product developments focus on enhancing the purity of Anhydrous AlCl3 and optimizing its performance in various applications. New production techniques are being implemented to improve efficiency and reduce environmental impact. Companies are emphasizing the development of customized solutions to meet the specific needs of various industries. These innovations contribute to competitive advantages by delivering superior product quality and performance.
Report Scope & Segmentation Analysis
This report segments the Anhydrous AlCl3 market by application (Pharmaceuticals, Pesticides, Chemical Manufacturing, Pigments, Other Applications) and form (Powder, Granules, Crystals). Each segment’s market size, growth projections, and competitive landscape are analyzed in detail. The pharmaceutical application segment is projected to exhibit significant growth due to increasing demand for various pharmaceutical intermediates. The chemical manufacturing segment dominates currently but is anticipated to experience moderate growth. The pesticides segment is expected to grow moderately due to the increasing demand for agricultural chemicals. The pigments segment demonstrates steady growth driven by the paints and coatings industry. Powder form of anhydrous AlCl3 is expected to dominate the market due to its ease of handling and versatility.
Key Drivers of Anhydrous AlCl3 Market Growth
The Anhydrous AlCl3 market is driven by several factors, including the growing demand from chemical manufacturing, pharmaceuticals, and other industries. Technological advancements in production methods are leading to higher purity and efficiency. Government regulations promoting sustainable practices are also contributing to market expansion. Favorable economic conditions in key regions further fuel market growth.
Challenges in the Anhydrous AlCl3 Market Sector
Challenges include stringent environmental regulations, potential supply chain disruptions, and intense competition from other Lewis acid substitutes. These factors may impact market growth and profitability. Fluctuations in raw material prices also pose a significant challenge.
Emerging Opportunities in Anhydrous AlCl3 Market
Emerging opportunities include the exploration of new applications in advanced materials and nanotechnology. The development of sustainable and eco-friendly production methods presents a significant opportunity. Expanding into emerging markets offers considerable growth potential.
Leading Players in the Anhydrous AlCl3 Market Market
- Gulbrandsen Manufacturing Inc
- Kanto Denka Kogyo Co Ltd
- BASF SE
- DCM Shriram
- Aditya Birla Chemicals
- Base Metal Group
- Nippon Light Metal Company Ltd
- Gujarat Alkali & Chemicals Ltd
- Upra Chem Pvt Ltd
- Shandong Kunbao New Materials Group Co Ltd
- Anmol Chloro Chem
Key Developments in Anhydrous AlCl3 Market Industry
- 2022-Q4: BASF SE announced the expansion of its Anhydrous AlCl3 production facility in Germany.
- 2023-Q1: Kanto Denka Kogyo Co Ltd launched a new high-purity Anhydrous AlCl3 product.
- 2023-Q2: A new joint venture was formed between two smaller players to improve supply chain resilience. (Further details xx)
Strategic Outlook for Anhydrous AlCl3 Market Market
The Anhydrous AlCl3 market is poised for continued growth, driven by innovation, expanding applications, and favorable economic conditions. Focus on sustainability and technological advancements will be crucial for success. Companies should invest in R&D to develop high-value products and explore new market segments. Strategic partnerships and collaborations will further enhance market positioning.
Anhydrous AlCl3 Market Segmentation
-
1. Form
- 1.1. Powder
- 1.2. Granules
- 1.3. Crystals
-
2. Application
- 2.1. Pharmaceuticals
- 2.2. Pesticides
- 2.3. Chemical Manufacturing
- 2.4. Pigments
- 2.5. Other Applications
Anhydrous AlCl3 Market Segmentation By Geography
-
1. Asia Pacific
- 1.1. China
- 1.2. India
- 1.3. Japan
- 1.4. South Korea
- 1.5. Rest of Asia Pacific
-
2. North America
- 2.1. United States
- 2.2. Canada
- 2.3. Mexico
-
3. Europe
- 3.1. Germany
- 3.2. United Kingdom
- 3.3. Italy
- 3.4. France
- 3.5. Rest of Europe
-
4. South America
- 4.1. Brazil
- 4.2. Argentina
- 4.3. Rest of South America
-
5. Middle East and Africa
- 5.1. Saudi Arabia
- 5.2. South Africa
- 5.3. Rest of Middle East and Africa
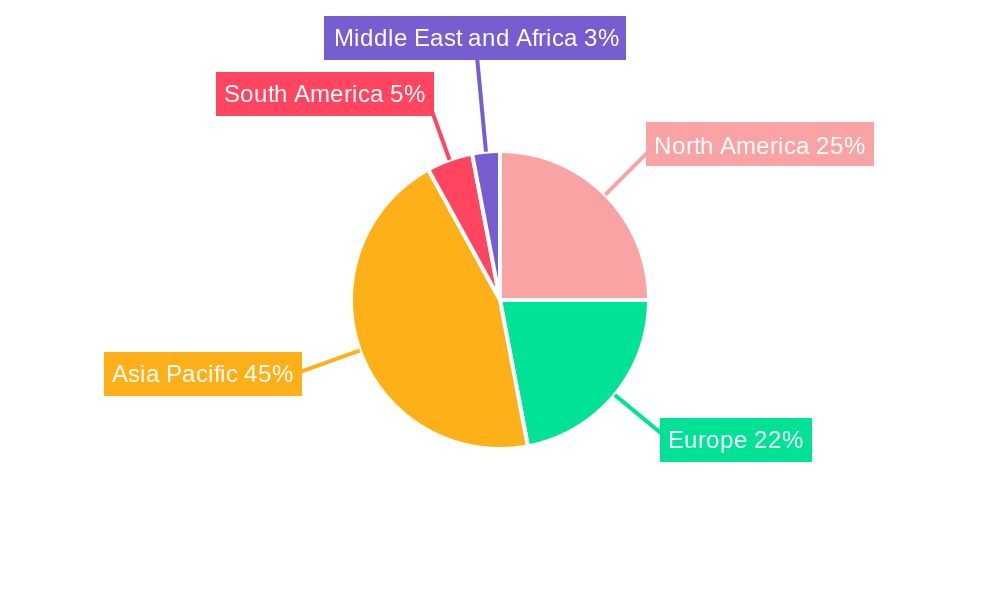
Anhydrous AlCl3 Market Regional Market Share
Geographic Coverage of Anhydrous AlCl3 Market
Anhydrous AlCl3 Market REPORT HIGHLIGHTS
| Aspects | Details |
|---|---|
| Study Period | 2020-2034 |
| Base Year | 2025 |
| Estimated Year | 2026 |
| Forecast Period | 2026-2034 |
| Historical Period | 2020-2025 |
| Growth Rate | CAGR of > 5.00% from 2020-2034 |
| Segmentation |
|
Table of Contents
- 1. Introduction
- 1.1. Research Scope
- 1.2. Market Segmentation
- 1.3. Research Objective
- 1.4. Definitions and Assumptions
- 2. Executive Summary
- 2.1. Market Snapshot
- 3. Market Dynamics
- 3.1. Market Drivers
- 3.2. Market Restrains
- 3.3. Market Trends
- 3.4. Market Opportunities
- 4. Market Factor Analysis
- 4.1. Porters Five Forces
- 4.1.1. Bargaining Power of Suppliers
- 4.1.2. Bargaining Power of Buyers
- 4.1.3. Threat of New Entrants
- 4.1.4. Threat of Substitutes
- 4.1.5. Competitive Rivalry
- 4.2. PESTEL analysis
- 4.3. BCG Analysis
- 4.3.1. Stars (High Growth, High Market Share)
- 4.3.2. Cash Cows (Low Growth, High Market Share)
- 4.3.3. Question Mark (High Growth, Low Market Share)
- 4.3.4. Dogs (Low Growth, Low Market Share)
- 4.4. Ansoff Matrix Analysis
- 4.5. Supply Chain Analysis
- 4.6. Regulatory Landscape
- 4.7. Current Market Potential and Opportunity Assessment (TAM–SAM–SOM Framework)
- 4.8. RAX Analyst Note
- 4.1. Porters Five Forces
- 5. Market Analysis, Insights and Forecast 2021-2033
- 5.1. Market Analysis, Insights and Forecast - by Form
- 5.1.1. Powder
- 5.1.2. Granules
- 5.1.3. Crystals
- 5.2. Market Analysis, Insights and Forecast - by Application
- 5.2.1. Pharmaceuticals
- 5.2.2. Pesticides
- 5.2.3. Chemical Manufacturing
- 5.2.4. Pigments
- 5.2.5. Other Applications
- 5.3. Market Analysis, Insights and Forecast - by Region
- 5.3.1. Asia Pacific
- 5.3.2. North America
- 5.3.3. Europe
- 5.3.4. South America
- 5.3.5. Middle East and Africa
- 5.1. Market Analysis, Insights and Forecast - by Form
- 6. Global Anhydrous AlCl3 Market Analysis, Insights and Forecast, 2021-2033
- 6.1. Market Analysis, Insights and Forecast - by Form
- 6.1.1. Powder
- 6.1.2. Granules
- 6.1.3. Crystals
- 6.2. Market Analysis, Insights and Forecast - by Application
- 6.2.1. Pharmaceuticals
- 6.2.2. Pesticides
- 6.2.3. Chemical Manufacturing
- 6.2.4. Pigments
- 6.2.5. Other Applications
- 6.1. Market Analysis, Insights and Forecast - by Form
- 7. Asia Pacific Anhydrous AlCl3 Market Analysis, Insights and Forecast, 2020-2032
- 7.1. Market Analysis, Insights and Forecast - by Form
- 7.1.1. Powder
- 7.1.2. Granules
- 7.1.3. Crystals
- 7.2. Market Analysis, Insights and Forecast - by Application
- 7.2.1. Pharmaceuticals
- 7.2.2. Pesticides
- 7.2.3. Chemical Manufacturing
- 7.2.4. Pigments
- 7.2.5. Other Applications
- 7.1. Market Analysis, Insights and Forecast - by Form
- 8. North America Anhydrous AlCl3 Market Analysis, Insights and Forecast, 2020-2032
- 8.1. Market Analysis, Insights and Forecast - by Form
- 8.1.1. Powder
- 8.1.2. Granules
- 8.1.3. Crystals
- 8.2. Market Analysis, Insights and Forecast - by Application
- 8.2.1. Pharmaceuticals
- 8.2.2. Pesticides
- 8.2.3. Chemical Manufacturing
- 8.2.4. Pigments
- 8.2.5. Other Applications
- 8.1. Market Analysis, Insights and Forecast - by Form
- 9. Europe Anhydrous AlCl3 Market Analysis, Insights and Forecast, 2020-2032
- 9.1. Market Analysis, Insights and Forecast - by Form
- 9.1.1. Powder
- 9.1.2. Granules
- 9.1.3. Crystals
- 9.2. Market Analysis, Insights and Forecast - by Application
- 9.2.1. Pharmaceuticals
- 9.2.2. Pesticides
- 9.2.3. Chemical Manufacturing
- 9.2.4. Pigments
- 9.2.5. Other Applications
- 9.1. Market Analysis, Insights and Forecast - by Form
- 10. South America Anhydrous AlCl3 Market Analysis, Insights and Forecast, 2020-2032
- 10.1. Market Analysis, Insights and Forecast - by Form
- 10.1.1. Powder
- 10.1.2. Granules
- 10.1.3. Crystals
- 10.2. Market Analysis, Insights and Forecast - by Application
- 10.2.1. Pharmaceuticals
- 10.2.2. Pesticides
- 10.2.3. Chemical Manufacturing
- 10.2.4. Pigments
- 10.2.5. Other Applications
- 10.1. Market Analysis, Insights and Forecast - by Form
- 11. Middle East and Africa Anhydrous AlCl3 Market Analysis, Insights and Forecast, 2020-2032
- 11.1. Market Analysis, Insights and Forecast - by Form
- 11.1.1. Powder
- 11.1.2. Granules
- 11.1.3. Crystals
- 11.2. Market Analysis, Insights and Forecast - by Application
- 11.2.1. Pharmaceuticals
- 11.2.2. Pesticides
- 11.2.3. Chemical Manufacturing
- 11.2.4. Pigments
- 11.2.5. Other Applications
- 11.1. Market Analysis, Insights and Forecast - by Form
- 12. Competitive Analysis
- 12.1. Company Profiles
- 12.1.1 Gulbrandsen Manufacturing Inc
- 12.1.1.1. Company Overview
- 12.1.1.2. Products
- 12.1.1.3. Company Financials
- 12.1.1.4. SWOT Analysis
- 12.1.2 Kanto Denka Kogyo Co Ltd
- 12.1.2.1. Company Overview
- 12.1.2.2. Products
- 12.1.2.3. Company Financials
- 12.1.2.4. SWOT Analysis
- 12.1.3 BASF SE
- 12.1.3.1. Company Overview
- 12.1.3.2. Products
- 12.1.3.3. Company Financials
- 12.1.3.4. SWOT Analysis
- 12.1.4 DCM Shriram
- 12.1.4.1. Company Overview
- 12.1.4.2. Products
- 12.1.4.3. Company Financials
- 12.1.4.4. SWOT Analysis
- 12.1.5 Aditya Birla Chemicals
- 12.1.5.1. Company Overview
- 12.1.5.2. Products
- 12.1.5.3. Company Financials
- 12.1.5.4. SWOT Analysis
- 12.1.6 Base Metal Group
- 12.1.6.1. Company Overview
- 12.1.6.2. Products
- 12.1.6.3. Company Financials
- 12.1.6.4. SWOT Analysis
- 12.1.7 Nippon Light Metal Company Ltd
- 12.1.7.1. Company Overview
- 12.1.7.2. Products
- 12.1.7.3. Company Financials
- 12.1.7.4. SWOT Analysis
- 12.1.8 Gujarat Alkali & Chemicals Ltd
- 12.1.8.1. Company Overview
- 12.1.8.2. Products
- 12.1.8.3. Company Financials
- 12.1.8.4. SWOT Analysis
- 12.1.9 Upra Chem Pvt Ltd *List Not Exhaustive
- 12.1.9.1. Company Overview
- 12.1.9.2. Products
- 12.1.9.3. Company Financials
- 12.1.9.4. SWOT Analysis
- 12.1.10 Shandong Kunbao New Materials Group Co Ltd
- 12.1.10.1. Company Overview
- 12.1.10.2. Products
- 12.1.10.3. Company Financials
- 12.1.10.4. SWOT Analysis
- 12.1.11 Anmol Chloro Chem
- 12.1.11.1. Company Overview
- 12.1.11.2. Products
- 12.1.11.3. Company Financials
- 12.1.11.4. SWOT Analysis
- 12.1.1 Gulbrandsen Manufacturing Inc
- 12.2. Market Entropy
- 12.2.1 Company's Key Areas Served
- 12.2.2 Recent Developments
- 12.3. Company Market Share Analysis 2025
- 12.3.1 Top 5 Companies Market Share Analysis
- 12.3.2 Top 3 Companies Market Share Analysis
- 12.4. List of Potential Customers
- 13. Research Methodology
List of Figures
- Figure 1: Global Anhydrous AlCl3 Market Revenue Breakdown (Million, %) by Region 2025 & 2033
- Figure 2: Global Anhydrous AlCl3 Market Volume Breakdown (Million, %) by Region 2025 & 2033
- Figure 3: Asia Pacific Anhydrous AlCl3 Market Revenue (Million), by Form 2025 & 2033
- Figure 4: Asia Pacific Anhydrous AlCl3 Market Volume (Million), by Form 2025 & 2033
- Figure 5: Asia Pacific Anhydrous AlCl3 Market Revenue Share (%), by Form 2025 & 2033
- Figure 6: Asia Pacific Anhydrous AlCl3 Market Volume Share (%), by Form 2025 & 2033
- Figure 7: Asia Pacific Anhydrous AlCl3 Market Revenue (Million), by Application 2025 & 2033
- Figure 8: Asia Pacific Anhydrous AlCl3 Market Volume (Million), by Application 2025 & 2033
- Figure 9: Asia Pacific Anhydrous AlCl3 Market Revenue Share (%), by Application 2025 & 2033
- Figure 10: Asia Pacific Anhydrous AlCl3 Market Volume Share (%), by Application 2025 & 2033
- Figure 11: Asia Pacific Anhydrous AlCl3 Market Revenue (Million), by Country 2025 & 2033
- Figure 12: Asia Pacific Anhydrous AlCl3 Market Volume (Million), by Country 2025 & 2033
- Figure 13: Asia Pacific Anhydrous AlCl3 Market Revenue Share (%), by Country 2025 & 2033
- Figure 14: Asia Pacific Anhydrous AlCl3 Market Volume Share (%), by Country 2025 & 2033
- Figure 15: North America Anhydrous AlCl3 Market Revenue (Million), by Form 2025 & 2033
- Figure 16: North America Anhydrous AlCl3 Market Volume (Million), by Form 2025 & 2033
- Figure 17: North America Anhydrous AlCl3 Market Revenue Share (%), by Form 2025 & 2033
- Figure 18: North America Anhydrous AlCl3 Market Volume Share (%), by Form 2025 & 2033
- Figure 19: North America Anhydrous AlCl3 Market Revenue (Million), by Application 2025 & 2033
- Figure 20: North America Anhydrous AlCl3 Market Volume (Million), by Application 2025 & 2033
- Figure 21: North America Anhydrous AlCl3 Market Revenue Share (%), by Application 2025 & 2033
- Figure 22: North America Anhydrous AlCl3 Market Volume Share (%), by Application 2025 & 2033
- Figure 23: North America Anhydrous AlCl3 Market Revenue (Million), by Country 2025 & 2033
- Figure 24: North America Anhydrous AlCl3 Market Volume (Million), by Country 2025 & 2033
- Figure 25: North America Anhydrous AlCl3 Market Revenue Share (%), by Country 2025 & 2033
- Figure 26: North America Anhydrous AlCl3 Market Volume Share (%), by Country 2025 & 2033
- Figure 27: Europe Anhydrous AlCl3 Market Revenue (Million), by Form 2025 & 2033
- Figure 28: Europe Anhydrous AlCl3 Market Volume (Million), by Form 2025 & 2033
- Figure 29: Europe Anhydrous AlCl3 Market Revenue Share (%), by Form 2025 & 2033
- Figure 30: Europe Anhydrous AlCl3 Market Volume Share (%), by Form 2025 & 2033
- Figure 31: Europe Anhydrous AlCl3 Market Revenue (Million), by Application 2025 & 2033
- Figure 32: Europe Anhydrous AlCl3 Market Volume (Million), by Application 2025 & 2033
- Figure 33: Europe Anhydrous AlCl3 Market Revenue Share (%), by Application 2025 & 2033
- Figure 34: Europe Anhydrous AlCl3 Market Volume Share (%), by Application 2025 & 2033
- Figure 35: Europe Anhydrous AlCl3 Market Revenue (Million), by Country 2025 & 2033
- Figure 36: Europe Anhydrous AlCl3 Market Volume (Million), by Country 2025 & 2033
- Figure 37: Europe Anhydrous AlCl3 Market Revenue Share (%), by Country 2025 & 2033
- Figure 38: Europe Anhydrous AlCl3 Market Volume Share (%), by Country 2025 & 2033
- Figure 39: South America Anhydrous AlCl3 Market Revenue (Million), by Form 2025 & 2033
- Figure 40: South America Anhydrous AlCl3 Market Volume (Million), by Form 2025 & 2033
- Figure 41: South America Anhydrous AlCl3 Market Revenue Share (%), by Form 2025 & 2033
- Figure 42: South America Anhydrous AlCl3 Market Volume Share (%), by Form 2025 & 2033
- Figure 43: South America Anhydrous AlCl3 Market Revenue (Million), by Application 2025 & 2033
- Figure 44: South America Anhydrous AlCl3 Market Volume (Million), by Application 2025 & 2033
- Figure 45: South America Anhydrous AlCl3 Market Revenue Share (%), by Application 2025 & 2033
- Figure 46: South America Anhydrous AlCl3 Market Volume Share (%), by Application 2025 & 2033
- Figure 47: South America Anhydrous AlCl3 Market Revenue (Million), by Country 2025 & 2033
- Figure 48: South America Anhydrous AlCl3 Market Volume (Million), by Country 2025 & 2033
- Figure 49: South America Anhydrous AlCl3 Market Revenue Share (%), by Country 2025 & 2033
- Figure 50: South America Anhydrous AlCl3 Market Volume Share (%), by Country 2025 & 2033
- Figure 51: Middle East and Africa Anhydrous AlCl3 Market Revenue (Million), by Form 2025 & 2033
- Figure 52: Middle East and Africa Anhydrous AlCl3 Market Volume (Million), by Form 2025 & 2033
- Figure 53: Middle East and Africa Anhydrous AlCl3 Market Revenue Share (%), by Form 2025 & 2033
- Figure 54: Middle East and Africa Anhydrous AlCl3 Market Volume Share (%), by Form 2025 & 2033
- Figure 55: Middle East and Africa Anhydrous AlCl3 Market Revenue (Million), by Application 2025 & 2033
- Figure 56: Middle East and Africa Anhydrous AlCl3 Market Volume (Million), by Application 2025 & 2033
- Figure 57: Middle East and Africa Anhydrous AlCl3 Market Revenue Share (%), by Application 2025 & 2033
- Figure 58: Middle East and Africa Anhydrous AlCl3 Market Volume Share (%), by Application 2025 & 2033
- Figure 59: Middle East and Africa Anhydrous AlCl3 Market Revenue (Million), by Country 2025 & 2033
- Figure 60: Middle East and Africa Anhydrous AlCl3 Market Volume (Million), by Country 2025 & 2033
- Figure 61: Middle East and Africa Anhydrous AlCl3 Market Revenue Share (%), by Country 2025 & 2033
- Figure 62: Middle East and Africa Anhydrous AlCl3 Market Volume Share (%), by Country 2025 & 2033
List of Tables
- Table 1: Global Anhydrous AlCl3 Market Revenue Million Forecast, by Form 2020 & 2033
- Table 2: Global Anhydrous AlCl3 Market Volume Million Forecast, by Form 2020 & 2033
- Table 3: Global Anhydrous AlCl3 Market Revenue Million Forecast, by Application 2020 & 2033
- Table 4: Global Anhydrous AlCl3 Market Volume Million Forecast, by Application 2020 & 2033
- Table 5: Global Anhydrous AlCl3 Market Revenue Million Forecast, by Region 2020 & 2033
- Table 6: Global Anhydrous AlCl3 Market Volume Million Forecast, by Region 2020 & 2033
- Table 7: Global Anhydrous AlCl3 Market Revenue Million Forecast, by Form 2020 & 2033
- Table 8: Global Anhydrous AlCl3 Market Volume Million Forecast, by Form 2020 & 2033
- Table 9: Global Anhydrous AlCl3 Market Revenue Million Forecast, by Application 2020 & 2033
- Table 10: Global Anhydrous AlCl3 Market Volume Million Forecast, by Application 2020 & 2033
- Table 11: Global Anhydrous AlCl3 Market Revenue Million Forecast, by Country 2020 & 2033
- Table 12: Global Anhydrous AlCl3 Market Volume Million Forecast, by Country 2020 & 2033
- Table 13: China Anhydrous AlCl3 Market Revenue (Million) Forecast, by Application 2020 & 2033
- Table 14: China Anhydrous AlCl3 Market Volume (Million) Forecast, by Application 2020 & 2033
- Table 15: India Anhydrous AlCl3 Market Revenue (Million) Forecast, by Application 2020 & 2033
- Table 16: India Anhydrous AlCl3 Market Volume (Million) Forecast, by Application 2020 & 2033
- Table 17: Japan Anhydrous AlCl3 Market Revenue (Million) Forecast, by Application 2020 & 2033
- Table 18: Japan Anhydrous AlCl3 Market Volume (Million) Forecast, by Application 2020 & 2033
- Table 19: South Korea Anhydrous AlCl3 Market Revenue (Million) Forecast, by Application 2020 & 2033
- Table 20: South Korea Anhydrous AlCl3 Market Volume (Million) Forecast, by Application 2020 & 2033
- Table 21: Rest of Asia Pacific Anhydrous AlCl3 Market Revenue (Million) Forecast, by Application 2020 & 2033
- Table 22: Rest of Asia Pacific Anhydrous AlCl3 Market Volume (Million) Forecast, by Application 2020 & 2033
- Table 23: Global Anhydrous AlCl3 Market Revenue Million Forecast, by Form 2020 & 2033
- Table 24: Global Anhydrous AlCl3 Market Volume Million Forecast, by Form 2020 & 2033
- Table 25: Global Anhydrous AlCl3 Market Revenue Million Forecast, by Application 2020 & 2033
- Table 26: Global Anhydrous AlCl3 Market Volume Million Forecast, by Application 2020 & 2033
- Table 27: Global Anhydrous AlCl3 Market Revenue Million Forecast, by Country 2020 & 2033
- Table 28: Global Anhydrous AlCl3 Market Volume Million Forecast, by Country 2020 & 2033
- Table 29: United States Anhydrous AlCl3 Market Revenue (Million) Forecast, by Application 2020 & 2033
- Table 30: United States Anhydrous AlCl3 Market Volume (Million) Forecast, by Application 2020 & 2033
- Table 31: Canada Anhydrous AlCl3 Market Revenue (Million) Forecast, by Application 2020 & 2033
- Table 32: Canada Anhydrous AlCl3 Market Volume (Million) Forecast, by Application 2020 & 2033
- Table 33: Mexico Anhydrous AlCl3 Market Revenue (Million) Forecast, by Application 2020 & 2033
- Table 34: Mexico Anhydrous AlCl3 Market Volume (Million) Forecast, by Application 2020 & 2033
- Table 35: Global Anhydrous AlCl3 Market Revenue Million Forecast, by Form 2020 & 2033
- Table 36: Global Anhydrous AlCl3 Market Volume Million Forecast, by Form 2020 & 2033
- Table 37: Global Anhydrous AlCl3 Market Revenue Million Forecast, by Application 2020 & 2033
- Table 38: Global Anhydrous AlCl3 Market Volume Million Forecast, by Application 2020 & 2033
- Table 39: Global Anhydrous AlCl3 Market Revenue Million Forecast, by Country 2020 & 2033
- Table 40: Global Anhydrous AlCl3 Market Volume Million Forecast, by Country 2020 & 2033
- Table 41: Germany Anhydrous AlCl3 Market Revenue (Million) Forecast, by Application 2020 & 2033
- Table 42: Germany Anhydrous AlCl3 Market Volume (Million) Forecast, by Application 2020 & 2033
- Table 43: United Kingdom Anhydrous AlCl3 Market Revenue (Million) Forecast, by Application 2020 & 2033
- Table 44: United Kingdom Anhydrous AlCl3 Market Volume (Million) Forecast, by Application 2020 & 2033
- Table 45: Italy Anhydrous AlCl3 Market Revenue (Million) Forecast, by Application 2020 & 2033
- Table 46: Italy Anhydrous AlCl3 Market Volume (Million) Forecast, by Application 2020 & 2033
- Table 47: France Anhydrous AlCl3 Market Revenue (Million) Forecast, by Application 2020 & 2033
- Table 48: France Anhydrous AlCl3 Market Volume (Million) Forecast, by Application 2020 & 2033
- Table 49: Rest of Europe Anhydrous AlCl3 Market Revenue (Million) Forecast, by Application 2020 & 2033
- Table 50: Rest of Europe Anhydrous AlCl3 Market Volume (Million) Forecast, by Application 2020 & 2033
- Table 51: Global Anhydrous AlCl3 Market Revenue Million Forecast, by Form 2020 & 2033
- Table 52: Global Anhydrous AlCl3 Market Volume Million Forecast, by Form 2020 & 2033
- Table 53: Global Anhydrous AlCl3 Market Revenue Million Forecast, by Application 2020 & 2033
- Table 54: Global Anhydrous AlCl3 Market Volume Million Forecast, by Application 2020 & 2033
- Table 55: Global Anhydrous AlCl3 Market Revenue Million Forecast, by Country 2020 & 2033
- Table 56: Global Anhydrous AlCl3 Market Volume Million Forecast, by Country 2020 & 2033
- Table 57: Brazil Anhydrous AlCl3 Market Revenue (Million) Forecast, by Application 2020 & 2033
- Table 58: Brazil Anhydrous AlCl3 Market Volume (Million) Forecast, by Application 2020 & 2033
- Table 59: Argentina Anhydrous AlCl3 Market Revenue (Million) Forecast, by Application 2020 & 2033
- Table 60: Argentina Anhydrous AlCl3 Market Volume (Million) Forecast, by Application 2020 & 2033
- Table 61: Rest of South America Anhydrous AlCl3 Market Revenue (Million) Forecast, by Application 2020 & 2033
- Table 62: Rest of South America Anhydrous AlCl3 Market Volume (Million) Forecast, by Application 2020 & 2033
- Table 63: Global Anhydrous AlCl3 Market Revenue Million Forecast, by Form 2020 & 2033
- Table 64: Global Anhydrous AlCl3 Market Volume Million Forecast, by Form 2020 & 2033
- Table 65: Global Anhydrous AlCl3 Market Revenue Million Forecast, by Application 2020 & 2033
- Table 66: Global Anhydrous AlCl3 Market Volume Million Forecast, by Application 2020 & 2033
- Table 67: Global Anhydrous AlCl3 Market Revenue Million Forecast, by Country 2020 & 2033
- Table 68: Global Anhydrous AlCl3 Market Volume Million Forecast, by Country 2020 & 2033
- Table 69: Saudi Arabia Anhydrous AlCl3 Market Revenue (Million) Forecast, by Application 2020 & 2033
- Table 70: Saudi Arabia Anhydrous AlCl3 Market Volume (Million) Forecast, by Application 2020 & 2033
- Table 71: South Africa Anhydrous AlCl3 Market Revenue (Million) Forecast, by Application 2020 & 2033
- Table 72: South Africa Anhydrous AlCl3 Market Volume (Million) Forecast, by Application 2020 & 2033
- Table 73: Rest of Middle East and Africa Anhydrous AlCl3 Market Revenue (Million) Forecast, by Application 2020 & 2033
- Table 74: Rest of Middle East and Africa Anhydrous AlCl3 Market Volume (Million) Forecast, by Application 2020 & 2033
Frequently Asked Questions
1. What is the projected Compound Annual Growth Rate (CAGR) of the Anhydrous AlCl3 Market?
The projected CAGR is approximately > 5.00%.
2. Which companies are prominent players in the Anhydrous AlCl3 Market?
Key companies in the market include Gulbrandsen Manufacturing Inc, Kanto Denka Kogyo Co Ltd, BASF SE, DCM Shriram, Aditya Birla Chemicals, Base Metal Group, Nippon Light Metal Company Ltd, Gujarat Alkali & Chemicals Ltd, Upra Chem Pvt Ltd *List Not Exhaustive, Shandong Kunbao New Materials Group Co Ltd, Anmol Chloro Chem.
3. What are the main segments of the Anhydrous AlCl3 Market?
The market segments include Form, Application.
4. Can you provide details about the market size?
The market size is estimated to be USD XX Million as of 2022.
5. What are some drivers contributing to market growth?
Growing Demand from the Chemical Manufacturing and Pigment Industry; Rising Demand from the Pharmaceutical Sector; Other drivers.
6. What are the notable trends driving market growth?
Increasing Demand from Pigments Sector.
7. Are there any restraints impacting market growth?
Difficult to Store Anhydrous Aluminum Chloride; Other Restraints.
8. Can you provide examples of recent developments in the market?
N/A
9. What pricing options are available for accessing the report?
Pricing options include single-user, multi-user, and enterprise licenses priced at USD 4750, USD 5250, and USD 8750 respectively.
10. Is the market size provided in terms of value or volume?
The market size is provided in terms of value, measured in Million and volume, measured in Million.
11. Are there any specific market keywords associated with the report?
Yes, the market keyword associated with the report is "Anhydrous AlCl3 Market," which aids in identifying and referencing the specific market segment covered.
12. How do I determine which pricing option suits my needs best?
The pricing options vary based on user requirements and access needs. Individual users may opt for single-user licenses, while businesses requiring broader access may choose multi-user or enterprise licenses for cost-effective access to the report.
13. Are there any additional resources or data provided in the Anhydrous AlCl3 Market report?
While the report offers comprehensive insights, it's advisable to review the specific contents or supplementary materials provided to ascertain if additional resources or data are available.
14. How can I stay updated on further developments or reports in the Anhydrous AlCl3 Market?
To stay informed about further developments, trends, and reports in the Anhydrous AlCl3 Market, consider subscribing to industry newsletters, following relevant companies and organizations, or regularly checking reputable industry news sources and publications.
Methodology
Step 1 - Identification of Relevant Samples Size from Population Database


Step 2 - Approaches for Defining Global Market Size (Value, Volume* & Price*)

Note*: In applicable scenarios
Step 3 - Data Sources
Primary Research
- Web Analytics
- Survey Reports
- Research Institute
- Latest Research Reports
- Opinion Leaders
Secondary Research
- Annual Reports
- White Paper
- Latest Press Release
- Industry Association
- Paid Database
- Investor Presentations

Step 4 - Data Triangulation
Involves using different sources of information in order to increase the validity of a study
These sources are likely to be stakeholders in a program - participants, other researchers, program staff, other community members, and so on.
Then we put all data in single framework & apply various statistical tools to find out the dynamic on the market.
During the analysis stage, feedback from the stakeholder groups would be compared to determine areas of agreement as well as areas of divergence