
Key Insights
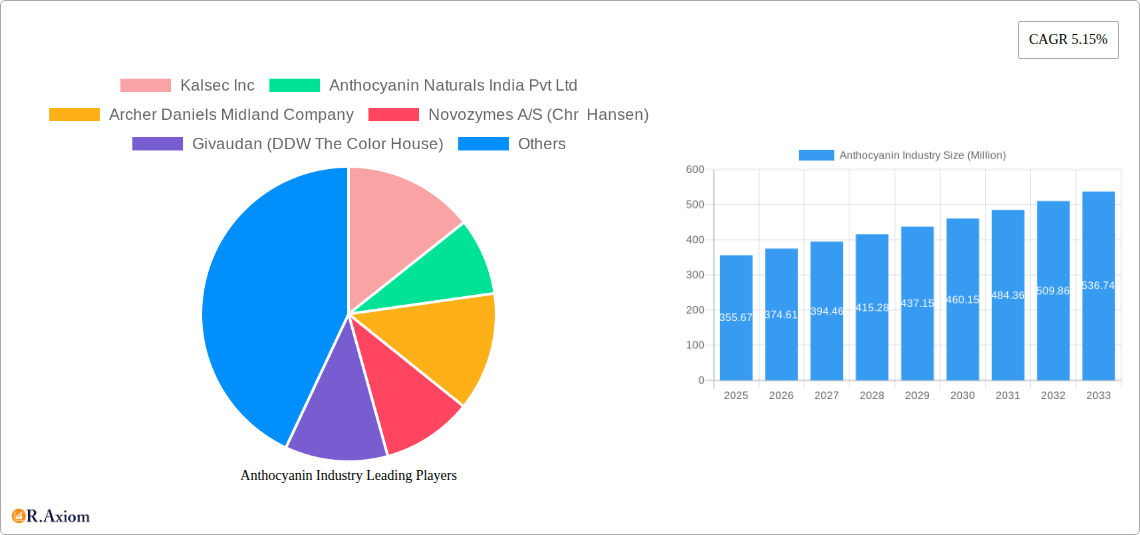
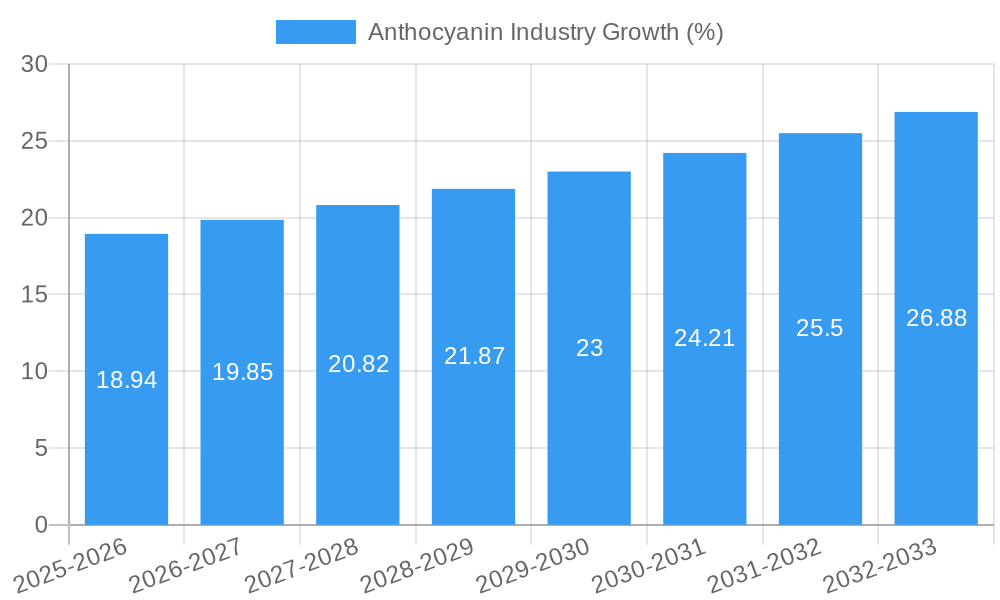
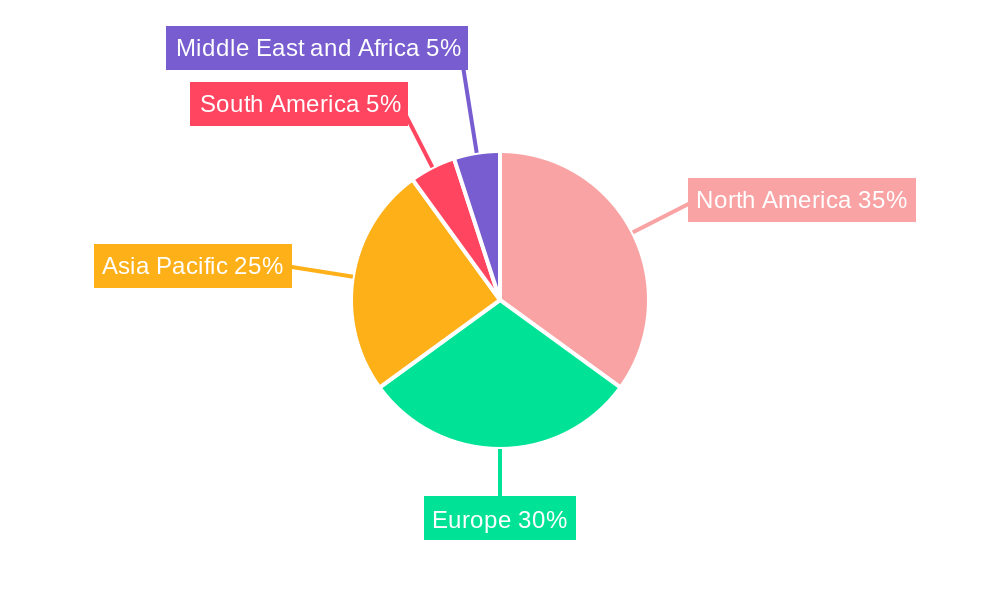
The global anthocyanin market, valued at $355.67 million in 2025, is projected to experience robust growth, driven by increasing demand across diverse sectors. A compound annual growth rate (CAGR) of 5.15% from 2025 to 2033 indicates a significant expansion of this market. Key drivers include the growing consumer preference for natural food colorants, a rising awareness of the health benefits associated with anthocyanins (particularly their antioxidant properties), and the increasing use in functional foods and beverages. The food and beverage sector remains the dominant application, fueled by the rising popularity of naturally colored products and the increasing demand for clean-label ingredients. However, significant growth is anticipated in the pharmaceutical and personal care industries, driven by research highlighting the potential therapeutic applications of anthocyanins. Furthermore, the expanding animal feed segment presents a lucrative opportunity, with anthocyanins offering potential health benefits to livestock. The market's segmentation by anthocyanin type (cyanidin, malvidin, delphinidin, peonidin, and others) showcases the variety of options available for different applications and consumer needs. Competition among key players like Kalsec Inc., Anthocyanin Naturals India Pvt Ltd., and Archer Daniels Midland Company is intense, driving innovation and the development of high-quality, cost-effective products. Regional analysis reveals strong growth across North America and Europe, fueled by high consumer awareness and established regulatory frameworks. However, emerging markets in Asia Pacific and South America are also showing significant potential for future growth, driven by rising disposable incomes and increasing demand for natural ingredients.
The competitive landscape is characterized by a mix of large multinational corporations and smaller specialized companies, fostering both innovation and stable supply. Future growth hinges on several factors, including continued research into the health benefits of anthocyanins, the development of sustainable and efficient extraction methods, and the regulatory landscape governing food additives and supplements. Addressing challenges such as price volatility and inconsistent supply of raw materials will be crucial for sustained market expansion. Successful players will likely leverage technological advancements, strategic partnerships, and a deep understanding of consumer preferences to solidify their market position and capitalize on the growing demand for natural and healthy ingredients. The market is expected to witness further consolidation as larger companies acquire smaller players to expand their product portfolios and geographic reach.
Anthocyanin Industry Market Report: 2019-2033
This comprehensive report provides a detailed analysis of the global anthocyanin industry, covering market size, growth projections, competitive landscape, and key trends from 2019 to 2033. The study period encompasses historical data (2019-2024), the base year (2025), and a forecast period (2025-2033). This report is essential for industry stakeholders, investors, and businesses seeking to understand and capitalize on the opportunities within this dynamic market.
Anthocyanin Industry Market Concentration & Innovation
The global anthocyanin market exhibits a moderately concentrated structure, with several key players holding significant market share. While precise market share data for each company remains proprietary, leading players like Kalsec Inc, Archer Daniels Midland Company, and Givaudan (DDW The Color House) are estimated to collectively control a substantial portion (xx%) of the market. The industry is characterized by both organic growth strategies (new product development) and inorganic growth through mergers and acquisitions (M&A). Recent M&A activity, while not publicly disclosing specific deal values in all cases, showcases industry consolidation and the pursuit of broader market access. For example, Chr. Hansen's acquisition of SECNA Natural Ingredients Group signaled a strategic move to expand its natural color portfolio.
- Innovation Drivers: The demand for natural and sustainable food coloring is a key driver of innovation. Companies are investing in research and development to create novel anthocyanin-based products with enhanced stability, color intensity, and functionalities.
- Regulatory Frameworks: Stringent regulations regarding food additives and labeling influence product development and market access, promoting the use of naturally-derived colors.
- Product Substitutes: Synthetic colorants pose a competitive threat, but growing consumer preference for natural ingredients is shifting the market in favor of anthocyanins.
- End-User Trends: The health-conscious consumer base and increasing demand for clean-label products drive the market’s growth.
- M&A Activities: Consolidation is a prominent trend, with larger companies acquiring smaller players to expand their product portfolios and geographic reach.
Anthocyanin Industry Industry Trends & Insights
The global anthocyanin market is experiencing robust growth, driven by several key factors. The compound annual growth rate (CAGR) during the forecast period (2025-2033) is projected to be xx%. This growth is fueled by increasing consumer demand for natural food colorants, the rising popularity of functional foods and beverages, and the growing applications of anthocyanins in the pharmaceutical and cosmetic industries. Technological advancements in extraction and purification processes are enhancing the quality and yield of anthocyanins, while also making them more cost-effective. Consumer preferences are shifting toward natural, clean-label products, which significantly benefits the anthocyanin market. The competitive landscape is characterized by both established players and emerging companies, leading to intense innovation and a focus on product differentiation. Market penetration within the food and beverage sector remains high, while penetration in other application areas like pharmaceuticals and cosmetics is gradually increasing.
Dominant Markets & Segments in Anthocyanin Industry
The Food & Beverage segment dominates the anthocyanin market, driven by the widespread use of anthocyanins as natural colorants in various food products, including beverages, confectionery, and baked goods. Within the types of anthocyanins, Cyanidin currently holds the largest market share due to its wide availability and cost-effectiveness. Regionally, North America and Europe are currently the leading markets due to high consumer awareness and demand for natural ingredients.
- Key Drivers in North America: Strong regulatory support for natural colors, high consumer disposable income, and established distribution networks.
- Key Drivers in Europe: High demand for natural and organic products, stringent regulations on synthetic food additives, and a robust food and beverage industry.
Other application segments like Pharmaceutical, Personal Care, and Animal Feed are showing promising growth potential due to anthocyanins’ antioxidant, anti-inflammatory, and other health-promoting properties. However, the penetration of anthocyanins in these segments is currently lower compared to the food and beverage sector, offering significant growth opportunities for future years.
Anthocyanin Industry Product Developments
Recent product innovations focus on enhancing the stability and functionality of anthocyanin extracts, addressing challenges associated with their sensitivity to light, pH changes, and heat. Companies are developing new delivery systems and formulations to improve the efficacy and applications of anthocyanins. The market is seeing a trend toward sustainable and ethically sourced anthocyanins, aligning with growing consumer demands for environmentally responsible products. This is reflected in new product launches like Givaudan’s New Purple 2364, a vegan pigment from a sustainable source.
Report Scope & Segmentation Analysis
This report segments the anthocyanin market based on Type (Cyanidin, Malvidin, Delphinidin, Peonidin, Other Types) and Application (Food & Beverage, Pharmaceutical, Personal Care, Animal Feed). Each segment’s market size, growth projections, and competitive dynamics are analyzed in detail. The Food & Beverage segment is expected to remain the largest, with significant growth anticipated in the Pharmaceutical and Personal Care segments. Growth projections vary among the different anthocyanin types, with Cyanidin anticipated to maintain its market dominance. The competitive landscape within each segment is analyzed, highlighting key players and their market strategies.
Key Drivers of Anthocyanin Industry Growth
The anthocyanin industry's growth is driven by several factors: the increasing consumer preference for natural and clean-label products, the growing awareness of the health benefits associated with anthocyanins, and the increasing demand for natural colorants in various industries, including food & beverage, pharmaceuticals, and cosmetics. Government regulations promoting the use of natural food additives and technological advancements in extraction and purification methods also contribute to market growth.
Challenges in the Anthocyanin Industry Sector
The anthocyanin industry faces challenges including the high cost of extraction and purification, inconsistent supply due to seasonal variations in raw material availability, and the inherent instability of anthocyanins, requiring specialized processing and packaging to maintain quality and color. Competition from synthetic colorants and stringent regulatory compliance requirements also pose significant hurdles to market expansion. Price fluctuations in raw materials also create challenges to maintaining consistent pricing for final products.
Emerging Opportunities in Anthocyanin Industry
Emerging opportunities include expanding applications in nutraceuticals, functional foods, and cosmeceuticals. Advancements in encapsulation and delivery technologies are expected to enhance the stability and efficacy of anthocyanin-based products. The growing demand for sustainable and ethically sourced ingredients presents a significant opportunity for companies that can effectively demonstrate their commitment to environmentally responsible sourcing and manufacturing practices. Further exploration into the health benefits of specific anthocyanin types may unlock new market applications.
Leading Players in the Anthocyanin Industry Market
- Kalsec Inc (Kalsec Inc)
- Anthocyanin Naturals India Pvt Ltd
- Archer Daniels Midland Company (Archer Daniels Midland Company)
- Novozymes A/S (Chr Hansen) (Chr. Hansen)
- Givaudan (DDW The Color House) (Givaudan)
- GNT Group B V (GNT Group)
- Synthite Industries Ltd
- Symrise AG (Symrise AG)
- Sensient Technologies Corporation (Sensient Technologies Corporation)
- Döhler Group SE
Key Developments in Anthocyanin Industry Industry
- September 2022: Givaudan Active Beauty launched New Purple 2364, a vegan and sustainable makeup pigment derived from Raphanus sativus L. This expands their portfolio of sustainable alternatives to synthetic pigments, initiated in 2020 with New Red 1805. This highlights the industry's focus on sustainability and natural ingredients.
- October 2021: GNT Group invested USD 30 million to expand its North American operations, signifying increased market penetration and capacity in a key region. This demonstrates confidence in the market's future growth.
- April 2021: Chr. Hansen acquired SECNA Natural Ingredients Group S.L., strengthening its position as a leading provider of natural colors and further consolidating the industry. This acquisition expanded Chr. Hansen's portfolio and geographic reach.
Strategic Outlook for Anthocyanin Industry Market
The anthocyanin market is poised for continued growth, driven by increasing consumer demand, technological advancements, and favorable regulatory changes. Expanding applications in diverse sectors, coupled with a focus on sustainability and product innovation, will shape future market dynamics. Companies that can effectively address the challenges related to supply chain management and product stability will be well-positioned to capture significant market share in the years to come. The ongoing trend toward natural and sustainable ingredients offers ample opportunities for growth and innovation within this dynamic market.
Anthocyanin Industry Segmentation
-
1. Type
- 1.1. Cyanidin
- 1.2. Malvidin
- 1.3. Delphinidin
- 1.4. Peonidin
- 1.5. Other Types
-
2. Application
-
2.1. Food & Beverage
- 2.1.1. Bakery & Confectionery
- 2.1.2. Dairy-based products
- 2.1.3. Beverages
- 2.1.4. Other Applications
- 2.2. Pharmaceutical
- 2.3. Personal Care
- 2.4. Animal Feed
-
2.1. Food & Beverage
Anthocyanin Industry Segmentation By Geography
-
1. North America
- 1.1. United States
- 1.2. Canada
- 1.3. Mexico
- 1.4. Rest of North America
-
2. Europe
- 2.1. Spain
- 2.2. United Kingdom
- 2.3. Germany
- 2.4. France
- 2.5. Italy
- 2.6. Russia
- 2.7. Rest of Europe
-
3. Asia Pacific
- 3.1. China
- 3.2. Japan
- 3.3. India
- 3.4. Australia
- 3.5. Rest of Asia Pacific
-
4. South America
- 4.1. Brazil
- 4.2. Argentina
- 4.3. Rest of South America
-
5. Middle East and Africa
- 5.1. South Africa
- 5.2. Saudi Arabia
- 5.3. Rest of Middle East and Africa
Anthocyanin Industry REPORT HIGHLIGHTS
| Aspects | Details |
|---|---|
| Study Period | 2019-2033 |
| Base Year | 2024 |
| Estimated Year | 2025 |
| Forecast Period | 2025-2033 |
| Historical Period | 2019-2024 |
| Growth Rate | CAGR of 5.15% from 2019-2033 |
| Segmentation |
|
Table of Contents
- 1. Introduction
- 1.1. Research Scope
- 1.2. Market Segmentation
- 1.3. Research Methodology
- 1.4. Definitions and Assumptions
- 2. Executive Summary
- 2.1. Introduction
- 3. Market Dynamics
- 3.1. Introduction
- 3.2. Market Drivers
- 3.2.1. Increasing Consumer Awareness Regarding Natural Products; Growing Demand for Anthocyanin in Pharmaceutical Industry
- 3.3. Market Restrains
- 3.3.1. Easy Availability of Synthetic Food Colorant
- 3.4. Market Trends
- 3.4.1. Increasing Consumer Awareness Regarding Natural Products
- 4. Market Factor Analysis
- 4.1. Porters Five Forces
- 4.2. Supply/Value Chain
- 4.3. PESTEL analysis
- 4.4. Market Entropy
- 4.5. Patent/Trademark Analysis
- 5. Global Anthocyanin Industry Analysis, Insights and Forecast, 2019-2031
- 5.1. Market Analysis, Insights and Forecast - by Type
- 5.1.1. Cyanidin
- 5.1.2. Malvidin
- 5.1.3. Delphinidin
- 5.1.4. Peonidin
- 5.1.5. Other Types
- 5.2. Market Analysis, Insights and Forecast - by Application
- 5.2.1. Food & Beverage
- 5.2.1.1. Bakery & Confectionery
- 5.2.1.2. Dairy-based products
- 5.2.1.3. Beverages
- 5.2.1.4. Other Applications
- 5.2.2. Pharmaceutical
- 5.2.3. Personal Care
- 5.2.4. Animal Feed
- 5.2.1. Food & Beverage
- 5.3. Market Analysis, Insights and Forecast - by Region
- 5.3.1. North America
- 5.3.2. Europe
- 5.3.3. Asia Pacific
- 5.3.4. South America
- 5.3.5. Middle East and Africa
- 5.1. Market Analysis, Insights and Forecast - by Type
- 6. North America Anthocyanin Industry Analysis, Insights and Forecast, 2019-2031
- 6.1. Market Analysis, Insights and Forecast - by Type
- 6.1.1. Cyanidin
- 6.1.2. Malvidin
- 6.1.3. Delphinidin
- 6.1.4. Peonidin
- 6.1.5. Other Types
- 6.2. Market Analysis, Insights and Forecast - by Application
- 6.2.1. Food & Beverage
- 6.2.1.1. Bakery & Confectionery
- 6.2.1.2. Dairy-based products
- 6.2.1.3. Beverages
- 6.2.1.4. Other Applications
- 6.2.2. Pharmaceutical
- 6.2.3. Personal Care
- 6.2.4. Animal Feed
- 6.2.1. Food & Beverage
- 6.1. Market Analysis, Insights and Forecast - by Type
- 7. Europe Anthocyanin Industry Analysis, Insights and Forecast, 2019-2031
- 7.1. Market Analysis, Insights and Forecast - by Type
- 7.1.1. Cyanidin
- 7.1.2. Malvidin
- 7.1.3. Delphinidin
- 7.1.4. Peonidin
- 7.1.5. Other Types
- 7.2. Market Analysis, Insights and Forecast - by Application
- 7.2.1. Food & Beverage
- 7.2.1.1. Bakery & Confectionery
- 7.2.1.2. Dairy-based products
- 7.2.1.3. Beverages
- 7.2.1.4. Other Applications
- 7.2.2. Pharmaceutical
- 7.2.3. Personal Care
- 7.2.4. Animal Feed
- 7.2.1. Food & Beverage
- 7.1. Market Analysis, Insights and Forecast - by Type
- 8. Asia Pacific Anthocyanin Industry Analysis, Insights and Forecast, 2019-2031
- 8.1. Market Analysis, Insights and Forecast - by Type
- 8.1.1. Cyanidin
- 8.1.2. Malvidin
- 8.1.3. Delphinidin
- 8.1.4. Peonidin
- 8.1.5. Other Types
- 8.2. Market Analysis, Insights and Forecast - by Application
- 8.2.1. Food & Beverage
- 8.2.1.1. Bakery & Confectionery
- 8.2.1.2. Dairy-based products
- 8.2.1.3. Beverages
- 8.2.1.4. Other Applications
- 8.2.2. Pharmaceutical
- 8.2.3. Personal Care
- 8.2.4. Animal Feed
- 8.2.1. Food & Beverage
- 8.1. Market Analysis, Insights and Forecast - by Type
- 9. South America Anthocyanin Industry Analysis, Insights and Forecast, 2019-2031
- 9.1. Market Analysis, Insights and Forecast - by Type
- 9.1.1. Cyanidin
- 9.1.2. Malvidin
- 9.1.3. Delphinidin
- 9.1.4. Peonidin
- 9.1.5. Other Types
- 9.2. Market Analysis, Insights and Forecast - by Application
- 9.2.1. Food & Beverage
- 9.2.1.1. Bakery & Confectionery
- 9.2.1.2. Dairy-based products
- 9.2.1.3. Beverages
- 9.2.1.4. Other Applications
- 9.2.2. Pharmaceutical
- 9.2.3. Personal Care
- 9.2.4. Animal Feed
- 9.2.1. Food & Beverage
- 9.1. Market Analysis, Insights and Forecast - by Type
- 10. Middle East and Africa Anthocyanin Industry Analysis, Insights and Forecast, 2019-2031
- 10.1. Market Analysis, Insights and Forecast - by Type
- 10.1.1. Cyanidin
- 10.1.2. Malvidin
- 10.1.3. Delphinidin
- 10.1.4. Peonidin
- 10.1.5. Other Types
- 10.2. Market Analysis, Insights and Forecast - by Application
- 10.2.1. Food & Beverage
- 10.2.1.1. Bakery & Confectionery
- 10.2.1.2. Dairy-based products
- 10.2.1.3. Beverages
- 10.2.1.4. Other Applications
- 10.2.2. Pharmaceutical
- 10.2.3. Personal Care
- 10.2.4. Animal Feed
- 10.2.1. Food & Beverage
- 10.1. Market Analysis, Insights and Forecast - by Type
- 11. North America Anthocyanin Industry Analysis, Insights and Forecast, 2019-2031
- 11.1. Market Analysis, Insights and Forecast - By Country/Sub-region
- 11.1.1 United States
- 11.1.2 Canada
- 11.1.3 Mexico
- 11.1.4 Rest of North America
- 12. Europe Anthocyanin Industry Analysis, Insights and Forecast, 2019-2031
- 12.1. Market Analysis, Insights and Forecast - By Country/Sub-region
- 12.1.1 Spain
- 12.1.2 United Kingdom
- 12.1.3 Germany
- 12.1.4 France
- 12.1.5 Italy
- 12.1.6 Russia
- 12.1.7 Rest of Europe
- 13. Asia Pacific Anthocyanin Industry Analysis, Insights and Forecast, 2019-2031
- 13.1. Market Analysis, Insights and Forecast - By Country/Sub-region
- 13.1.1 China
- 13.1.2 Japan
- 13.1.3 India
- 13.1.4 Australia
- 13.1.5 Rest of Asia Pacific
- 14. South America Anthocyanin Industry Analysis, Insights and Forecast, 2019-2031
- 14.1. Market Analysis, Insights and Forecast - By Country/Sub-region
- 14.1.1 Brazil
- 14.1.2 Argentina
- 14.1.3 Rest of South America
- 15. Middle East and Africa Anthocyanin Industry Analysis, Insights and Forecast, 2019-2031
- 15.1. Market Analysis, Insights and Forecast - By Country/Sub-region
- 15.1.1 South Africa
- 15.1.2 Saudi Arabia
- 15.1.3 Rest of Middle East and Africa
- 16. Competitive Analysis
- 16.1. Global Market Share Analysis 2024
- 16.2. Company Profiles
- 16.2.1 Kalsec Inc
- 16.2.1.1. Overview
- 16.2.1.2. Products
- 16.2.1.3. SWOT Analysis
- 16.2.1.4. Recent Developments
- 16.2.1.5. Financials (Based on Availability)
- 16.2.2 Anthocyanin Naturals India Pvt Ltd
- 16.2.2.1. Overview
- 16.2.2.2. Products
- 16.2.2.3. SWOT Analysis
- 16.2.2.4. Recent Developments
- 16.2.2.5. Financials (Based on Availability)
- 16.2.3 Archer Daniels Midland Company
- 16.2.3.1. Overview
- 16.2.3.2. Products
- 16.2.3.3. SWOT Analysis
- 16.2.3.4. Recent Developments
- 16.2.3.5. Financials (Based on Availability)
- 16.2.4 Novozymes A/S (Chr Hansen)
- 16.2.4.1. Overview
- 16.2.4.2. Products
- 16.2.4.3. SWOT Analysis
- 16.2.4.4. Recent Developments
- 16.2.4.5. Financials (Based on Availability)
- 16.2.5 Givaudan (DDW The Color House)
- 16.2.5.1. Overview
- 16.2.5.2. Products
- 16.2.5.3. SWOT Analysis
- 16.2.5.4. Recent Developments
- 16.2.5.5. Financials (Based on Availability)
- 16.2.6 GNT Group B V
- 16.2.6.1. Overview
- 16.2.6.2. Products
- 16.2.6.3. SWOT Analysis
- 16.2.6.4. Recent Developments
- 16.2.6.5. Financials (Based on Availability)
- 16.2.7 Synthite Industries Ltd
- 16.2.7.1. Overview
- 16.2.7.2. Products
- 16.2.7.3. SWOT Analysis
- 16.2.7.4. Recent Developments
- 16.2.7.5. Financials (Based on Availability)
- 16.2.8 Symrise AG
- 16.2.8.1. Overview
- 16.2.8.2. Products
- 16.2.8.3. SWOT Analysis
- 16.2.8.4. Recent Developments
- 16.2.8.5. Financials (Based on Availability)
- 16.2.9 Sensient Technologies Corporation
- 16.2.9.1. Overview
- 16.2.9.2. Products
- 16.2.9.3. SWOT Analysis
- 16.2.9.4. Recent Developments
- 16.2.9.5. Financials (Based on Availability)
- 16.2.10 Döhler Group SE*List Not Exhaustive
- 16.2.10.1. Overview
- 16.2.10.2. Products
- 16.2.10.3. SWOT Analysis
- 16.2.10.4. Recent Developments
- 16.2.10.5. Financials (Based on Availability)
- 16.2.1 Kalsec Inc
List of Figures
- Figure 1: Global Anthocyanin Industry Revenue Breakdown (Million, %) by Region 2024 & 2032
- Figure 2: North America Anthocyanin Industry Revenue (Million), by Country 2024 & 2032
- Figure 3: North America Anthocyanin Industry Revenue Share (%), by Country 2024 & 2032
- Figure 4: Europe Anthocyanin Industry Revenue (Million), by Country 2024 & 2032
- Figure 5: Europe Anthocyanin Industry Revenue Share (%), by Country 2024 & 2032
- Figure 6: Asia Pacific Anthocyanin Industry Revenue (Million), by Country 2024 & 2032
- Figure 7: Asia Pacific Anthocyanin Industry Revenue Share (%), by Country 2024 & 2032
- Figure 8: South America Anthocyanin Industry Revenue (Million), by Country 2024 & 2032
- Figure 9: South America Anthocyanin Industry Revenue Share (%), by Country 2024 & 2032
- Figure 10: Middle East and Africa Anthocyanin Industry Revenue (Million), by Country 2024 & 2032
- Figure 11: Middle East and Africa Anthocyanin Industry Revenue Share (%), by Country 2024 & 2032
- Figure 12: North America Anthocyanin Industry Revenue (Million), by Type 2024 & 2032
- Figure 13: North America Anthocyanin Industry Revenue Share (%), by Type 2024 & 2032
- Figure 14: North America Anthocyanin Industry Revenue (Million), by Application 2024 & 2032
- Figure 15: North America Anthocyanin Industry Revenue Share (%), by Application 2024 & 2032
- Figure 16: North America Anthocyanin Industry Revenue (Million), by Country 2024 & 2032
- Figure 17: North America Anthocyanin Industry Revenue Share (%), by Country 2024 & 2032
- Figure 18: Europe Anthocyanin Industry Revenue (Million), by Type 2024 & 2032
- Figure 19: Europe Anthocyanin Industry Revenue Share (%), by Type 2024 & 2032
- Figure 20: Europe Anthocyanin Industry Revenue (Million), by Application 2024 & 2032
- Figure 21: Europe Anthocyanin Industry Revenue Share (%), by Application 2024 & 2032
- Figure 22: Europe Anthocyanin Industry Revenue (Million), by Country 2024 & 2032
- Figure 23: Europe Anthocyanin Industry Revenue Share (%), by Country 2024 & 2032
- Figure 24: Asia Pacific Anthocyanin Industry Revenue (Million), by Type 2024 & 2032
- Figure 25: Asia Pacific Anthocyanin Industry Revenue Share (%), by Type 2024 & 2032
- Figure 26: Asia Pacific Anthocyanin Industry Revenue (Million), by Application 2024 & 2032
- Figure 27: Asia Pacific Anthocyanin Industry Revenue Share (%), by Application 2024 & 2032
- Figure 28: Asia Pacific Anthocyanin Industry Revenue (Million), by Country 2024 & 2032
- Figure 29: Asia Pacific Anthocyanin Industry Revenue Share (%), by Country 2024 & 2032
- Figure 30: South America Anthocyanin Industry Revenue (Million), by Type 2024 & 2032
- Figure 31: South America Anthocyanin Industry Revenue Share (%), by Type 2024 & 2032
- Figure 32: South America Anthocyanin Industry Revenue (Million), by Application 2024 & 2032
- Figure 33: South America Anthocyanin Industry Revenue Share (%), by Application 2024 & 2032
- Figure 34: South America Anthocyanin Industry Revenue (Million), by Country 2024 & 2032
- Figure 35: South America Anthocyanin Industry Revenue Share (%), by Country 2024 & 2032
- Figure 36: Middle East and Africa Anthocyanin Industry Revenue (Million), by Type 2024 & 2032
- Figure 37: Middle East and Africa Anthocyanin Industry Revenue Share (%), by Type 2024 & 2032
- Figure 38: Middle East and Africa Anthocyanin Industry Revenue (Million), by Application 2024 & 2032
- Figure 39: Middle East and Africa Anthocyanin Industry Revenue Share (%), by Application 2024 & 2032
- Figure 40: Middle East and Africa Anthocyanin Industry Revenue (Million), by Country 2024 & 2032
- Figure 41: Middle East and Africa Anthocyanin Industry Revenue Share (%), by Country 2024 & 2032
List of Tables
- Table 1: Global Anthocyanin Industry Revenue Million Forecast, by Region 2019 & 2032
- Table 2: Global Anthocyanin Industry Revenue Million Forecast, by Type 2019 & 2032
- Table 3: Global Anthocyanin Industry Revenue Million Forecast, by Application 2019 & 2032
- Table 4: Global Anthocyanin Industry Revenue Million Forecast, by Region 2019 & 2032
- Table 5: Global Anthocyanin Industry Revenue Million Forecast, by Country 2019 & 2032
- Table 6: United States Anthocyanin Industry Revenue (Million) Forecast, by Application 2019 & 2032
- Table 7: Canada Anthocyanin Industry Revenue (Million) Forecast, by Application 2019 & 2032
- Table 8: Mexico Anthocyanin Industry Revenue (Million) Forecast, by Application 2019 & 2032
- Table 9: Rest of North America Anthocyanin Industry Revenue (Million) Forecast, by Application 2019 & 2032
- Table 10: Global Anthocyanin Industry Revenue Million Forecast, by Country 2019 & 2032
- Table 11: Spain Anthocyanin Industry Revenue (Million) Forecast, by Application 2019 & 2032
- Table 12: United Kingdom Anthocyanin Industry Revenue (Million) Forecast, by Application 2019 & 2032
- Table 13: Germany Anthocyanin Industry Revenue (Million) Forecast, by Application 2019 & 2032
- Table 14: France Anthocyanin Industry Revenue (Million) Forecast, by Application 2019 & 2032
- Table 15: Italy Anthocyanin Industry Revenue (Million) Forecast, by Application 2019 & 2032
- Table 16: Russia Anthocyanin Industry Revenue (Million) Forecast, by Application 2019 & 2032
- Table 17: Rest of Europe Anthocyanin Industry Revenue (Million) Forecast, by Application 2019 & 2032
- Table 18: Global Anthocyanin Industry Revenue Million Forecast, by Country 2019 & 2032
- Table 19: China Anthocyanin Industry Revenue (Million) Forecast, by Application 2019 & 2032
- Table 20: Japan Anthocyanin Industry Revenue (Million) Forecast, by Application 2019 & 2032
- Table 21: India Anthocyanin Industry Revenue (Million) Forecast, by Application 2019 & 2032
- Table 22: Australia Anthocyanin Industry Revenue (Million) Forecast, by Application 2019 & 2032
- Table 23: Rest of Asia Pacific Anthocyanin Industry Revenue (Million) Forecast, by Application 2019 & 2032
- Table 24: Global Anthocyanin Industry Revenue Million Forecast, by Country 2019 & 2032
- Table 25: Brazil Anthocyanin Industry Revenue (Million) Forecast, by Application 2019 & 2032
- Table 26: Argentina Anthocyanin Industry Revenue (Million) Forecast, by Application 2019 & 2032
- Table 27: Rest of South America Anthocyanin Industry Revenue (Million) Forecast, by Application 2019 & 2032
- Table 28: Global Anthocyanin Industry Revenue Million Forecast, by Country 2019 & 2032
- Table 29: South Africa Anthocyanin Industry Revenue (Million) Forecast, by Application 2019 & 2032
- Table 30: Saudi Arabia Anthocyanin Industry Revenue (Million) Forecast, by Application 2019 & 2032
- Table 31: Rest of Middle East and Africa Anthocyanin Industry Revenue (Million) Forecast, by Application 2019 & 2032
- Table 32: Global Anthocyanin Industry Revenue Million Forecast, by Type 2019 & 2032
- Table 33: Global Anthocyanin Industry Revenue Million Forecast, by Application 2019 & 2032
- Table 34: Global Anthocyanin Industry Revenue Million Forecast, by Country 2019 & 2032
- Table 35: United States Anthocyanin Industry Revenue (Million) Forecast, by Application 2019 & 2032
- Table 36: Canada Anthocyanin Industry Revenue (Million) Forecast, by Application 2019 & 2032
- Table 37: Mexico Anthocyanin Industry Revenue (Million) Forecast, by Application 2019 & 2032
- Table 38: Rest of North America Anthocyanin Industry Revenue (Million) Forecast, by Application 2019 & 2032
- Table 39: Global Anthocyanin Industry Revenue Million Forecast, by Type 2019 & 2032
- Table 40: Global Anthocyanin Industry Revenue Million Forecast, by Application 2019 & 2032
- Table 41: Global Anthocyanin Industry Revenue Million Forecast, by Country 2019 & 2032
- Table 42: Spain Anthocyanin Industry Revenue (Million) Forecast, by Application 2019 & 2032
- Table 43: United Kingdom Anthocyanin Industry Revenue (Million) Forecast, by Application 2019 & 2032
- Table 44: Germany Anthocyanin Industry Revenue (Million) Forecast, by Application 2019 & 2032
- Table 45: France Anthocyanin Industry Revenue (Million) Forecast, by Application 2019 & 2032
- Table 46: Italy Anthocyanin Industry Revenue (Million) Forecast, by Application 2019 & 2032
- Table 47: Russia Anthocyanin Industry Revenue (Million) Forecast, by Application 2019 & 2032
- Table 48: Rest of Europe Anthocyanin Industry Revenue (Million) Forecast, by Application 2019 & 2032
- Table 49: Global Anthocyanin Industry Revenue Million Forecast, by Type 2019 & 2032
- Table 50: Global Anthocyanin Industry Revenue Million Forecast, by Application 2019 & 2032
- Table 51: Global Anthocyanin Industry Revenue Million Forecast, by Country 2019 & 2032
- Table 52: China Anthocyanin Industry Revenue (Million) Forecast, by Application 2019 & 2032
- Table 53: Japan Anthocyanin Industry Revenue (Million) Forecast, by Application 2019 & 2032
- Table 54: India Anthocyanin Industry Revenue (Million) Forecast, by Application 2019 & 2032
- Table 55: Australia Anthocyanin Industry Revenue (Million) Forecast, by Application 2019 & 2032
- Table 56: Rest of Asia Pacific Anthocyanin Industry Revenue (Million) Forecast, by Application 2019 & 2032
- Table 57: Global Anthocyanin Industry Revenue Million Forecast, by Type 2019 & 2032
- Table 58: Global Anthocyanin Industry Revenue Million Forecast, by Application 2019 & 2032
- Table 59: Global Anthocyanin Industry Revenue Million Forecast, by Country 2019 & 2032
- Table 60: Brazil Anthocyanin Industry Revenue (Million) Forecast, by Application 2019 & 2032
- Table 61: Argentina Anthocyanin Industry Revenue (Million) Forecast, by Application 2019 & 2032
- Table 62: Rest of South America Anthocyanin Industry Revenue (Million) Forecast, by Application 2019 & 2032
- Table 63: Global Anthocyanin Industry Revenue Million Forecast, by Type 2019 & 2032
- Table 64: Global Anthocyanin Industry Revenue Million Forecast, by Application 2019 & 2032
- Table 65: Global Anthocyanin Industry Revenue Million Forecast, by Country 2019 & 2032
- Table 66: South Africa Anthocyanin Industry Revenue (Million) Forecast, by Application 2019 & 2032
- Table 67: Saudi Arabia Anthocyanin Industry Revenue (Million) Forecast, by Application 2019 & 2032
- Table 68: Rest of Middle East and Africa Anthocyanin Industry Revenue (Million) Forecast, by Application 2019 & 2032
Frequently Asked Questions
1. What is the projected Compound Annual Growth Rate (CAGR) of the Anthocyanin Industry?
The projected CAGR is approximately 5.15%.
2. Which companies are prominent players in the Anthocyanin Industry?
Key companies in the market include Kalsec Inc, Anthocyanin Naturals India Pvt Ltd, Archer Daniels Midland Company, Novozymes A/S (Chr Hansen), Givaudan (DDW The Color House), GNT Group B V, Synthite Industries Ltd, Symrise AG, Sensient Technologies Corporation, Döhler Group SE*List Not Exhaustive.
3. What are the main segments of the Anthocyanin Industry?
The market segments include Type, Application.
4. Can you provide details about the market size?
The market size is estimated to be USD 355.67 Million as of 2022.
5. What are some drivers contributing to market growth?
Increasing Consumer Awareness Regarding Natural Products; Growing Demand for Anthocyanin in Pharmaceutical Industry.
6. What are the notable trends driving market growth?
Increasing Consumer Awareness Regarding Natural Products.
7. Are there any restraints impacting market growth?
Easy Availability of Synthetic Food Colorant.
8. Can you provide examples of recent developments in the market?
September 2022: Givaudan Active Beauty introduced New Purple 2364, a vegan pigment specifically designed for use in makeup formulations. This sustainable pigment is derived through green fractionation from Raphanus sativus L., adding to Givaudan's portfolio of sustainable alternatives to synthetic pigments. The company initially launched this portfolio in 2020 with the introduction of New Red 1805.
9. What pricing options are available for accessing the report?
Pricing options include single-user, multi-user, and enterprise licenses priced at USD 4750, USD 5250, and USD 8750 respectively.
10. Is the market size provided in terms of value or volume?
The market size is provided in terms of value, measured in Million.
11. Are there any specific market keywords associated with the report?
Yes, the market keyword associated with the report is "Anthocyanin Industry," which aids in identifying and referencing the specific market segment covered.
12. How do I determine which pricing option suits my needs best?
The pricing options vary based on user requirements and access needs. Individual users may opt for single-user licenses, while businesses requiring broader access may choose multi-user or enterprise licenses for cost-effective access to the report.
13. Are there any additional resources or data provided in the Anthocyanin Industry report?
While the report offers comprehensive insights, it's advisable to review the specific contents or supplementary materials provided to ascertain if additional resources or data are available.
14. How can I stay updated on further developments or reports in the Anthocyanin Industry?
To stay informed about further developments, trends, and reports in the Anthocyanin Industry, consider subscribing to industry newsletters, following relevant companies and organizations, or regularly checking reputable industry news sources and publications.
Methodology
Step 1 - Identification of Relevant Samples Size from Population Database


Step 2 - Approaches for Defining Global Market Size (Value, Volume* & Price*)

Note*: In applicable scenarios
Step 3 - Data Sources
Primary Research
- Web Analytics
- Survey Reports
- Research Institute
- Latest Research Reports
- Opinion Leaders
Secondary Research
- Annual Reports
- White Paper
- Latest Press Release
- Industry Association
- Paid Database
- Investor Presentations

Step 4 - Data Triangulation
Involves using different sources of information in order to increase the validity of a study
These sources are likely to be stakeholders in a program - participants, other researchers, program staff, other community members, and so on.
Then we put all data in single framework & apply various statistical tools to find out the dynamic on the market.
During the analysis stage, feedback from the stakeholder groups would be compared to determine areas of agreement as well as areas of divergence


