

Key Insights
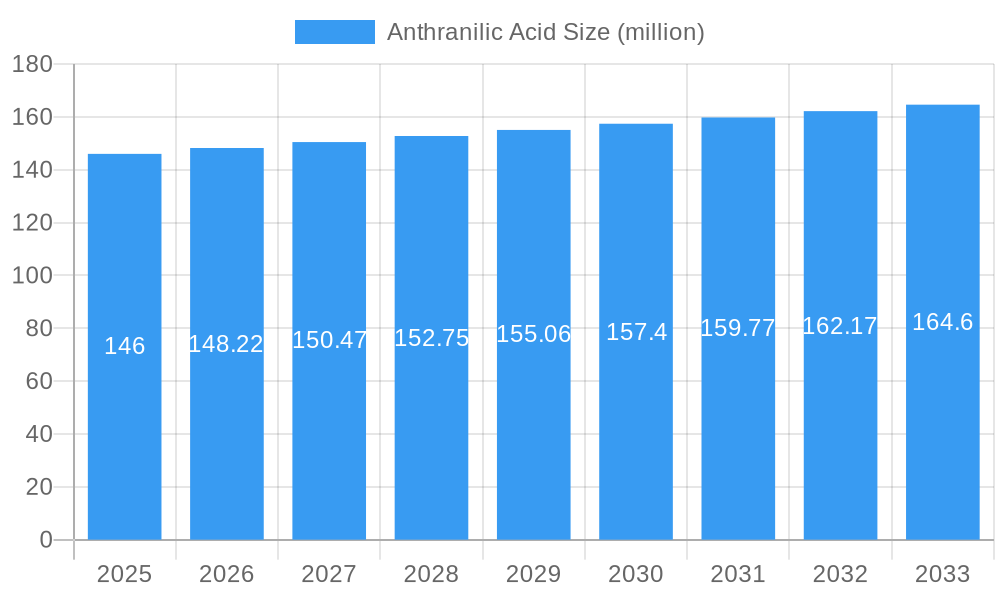
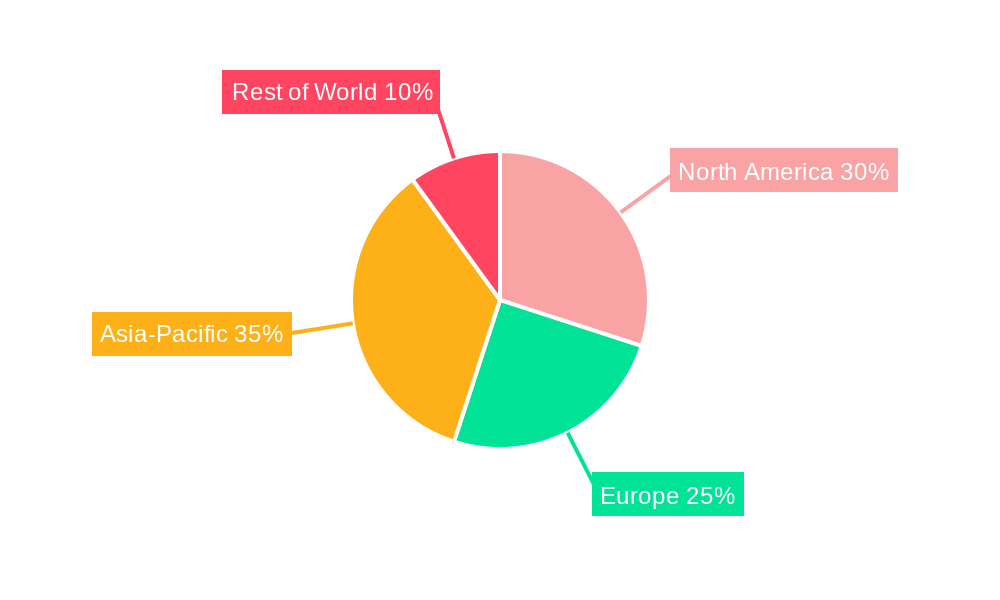
The global anthranilic acid market, valued at $146 million in 2025, is projected to experience steady growth, driven by increasing demand from various industries. A compound annual growth rate (CAGR) of 1.6% from 2025 to 2033 suggests a relatively stable market expansion, primarily fueled by its use as a crucial intermediate in the production of pharmaceuticals, dyes, and agrochemicals. The pharmaceutical sector's continuous innovation in drug development, coupled with the rising global population and increased prevalence of chronic diseases, will significantly contribute to the market's sustained growth. Furthermore, the expanding agrochemical industry, particularly the demand for high-yield and pest-resistant crops, will further propel the demand for anthranilic acid. However, factors like stringent environmental regulations concerning chemical usage and the emergence of alternative chemical intermediates could potentially restrain market growth. Competition among established players like Xiangli Chemical, New Sunlion Chemical, and Mitsuboshi Chemical, along with the emergence of new entrants, will shape the market landscape. Geographical distribution of market share will likely favor regions with established chemical manufacturing hubs and substantial pharmaceutical and agricultural sectors. While precise regional breakdowns are unavailable, a balanced distribution across key regions—North America, Europe, and Asia-Pacific—can be anticipated.
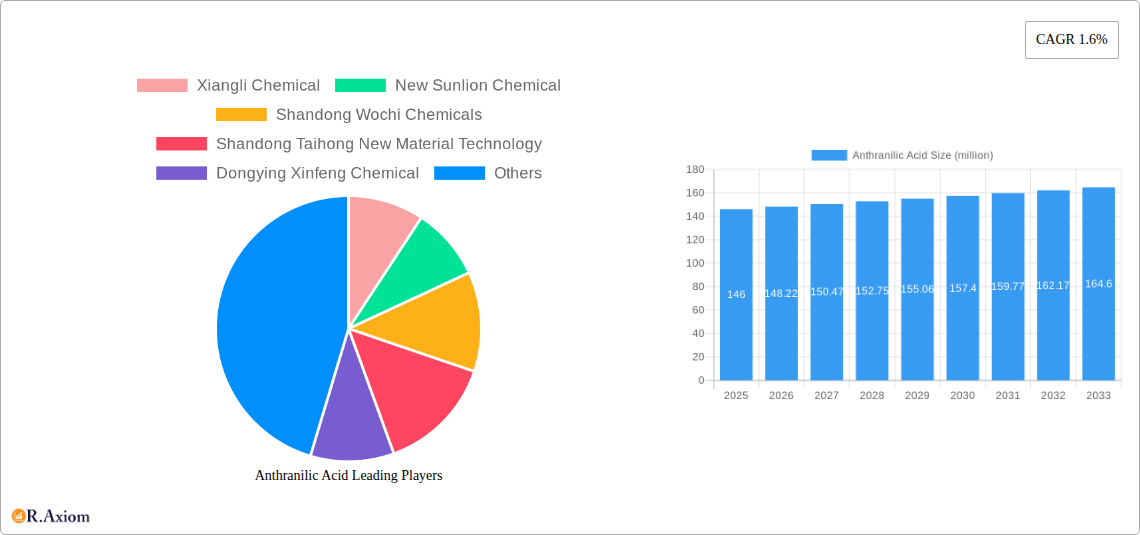
Anthranilic Acid Market Size (In Million)
The market's future trajectory hinges on several factors. Technological advancements in the manufacturing process, potentially resulting in cost reductions and increased efficiency, could positively influence market growth. Moreover, strategic collaborations and mergers and acquisitions within the industry may consolidate market power and drive further innovation. Conversely, fluctuations in raw material prices and energy costs could impact production costs and pricing strategies, affecting market dynamics. Sustained research and development efforts to explore new applications for anthranilic acid and to minimize environmental impact will be crucial for the long-term growth and sustainability of this market.
Anthranilic Acid Company Market Share
Anthranilic Acid Market Report: 2019-2033 - A Comprehensive Analysis
This in-depth report provides a comprehensive analysis of the global Anthranilic Acid market, offering valuable insights for stakeholders across the value chain. Covering the period from 2019 to 2033, with 2025 as the base and estimated year, this study meticulously examines market dynamics, competitive landscapes, and future growth prospects. The report leverages extensive primary and secondary research to deliver actionable intelligence, enabling informed strategic decision-making. The global market size is projected to reach xx million by 2033, exhibiting a CAGR of xx% during the forecast period (2025-2033).
Anthranilic Acid Market Concentration & Innovation
The global anthranilic acid market exhibits a moderately concentrated structure, with several key players holding significant market share. Xiangli Chemical, New Sunlion Chemical, and Shandong Wochi Chemicals are among the leading producers, collectively accounting for an estimated xx million of the total market revenue in 2025 (xx% market share). The industry is characterized by ongoing innovation driven by the need for higher purity grades, improved production efficiency, and the development of new applications. Regulatory frameworks, particularly concerning environmental compliance and product safety, play a significant role in shaping market dynamics. Several key trends are impacting this concentration:
- Mergers and Acquisitions (M&A): The past five years have witnessed several notable M&A activities, with deal values exceeding xx million. These transactions have primarily focused on expanding production capacity and geographic reach. For example, a recent acquisition of a smaller player by a leading producer resulted in a xx% increase in their market share.
- Product Substitutes: While limited, alternative chemical compounds exist for specific applications. These pose a moderate competitive threat, particularly in niche segments.
- End-User Trends: Growing demand from the pharmaceutical and agrochemical sectors is a major driver, creating opportunities for innovation and expansion.
- Regulatory Landscape: Stringent environmental regulations and safety standards influence production processes and influence the market's overall competitive landscape.
Anthranilic Acid Industry Trends & Insights
The anthranilic acid market is experiencing robust growth, driven by several key factors. The increasing demand from the pharmaceutical industry for the production of various drugs, including analgesics and anti-inflammatory agents, is a significant growth catalyst. Moreover, the rising application in the agrochemical sector as a precursor for herbicides and pesticides contributes substantially to market expansion. The market is also witnessing a shift towards sustainable and eco-friendly production methods.
- The pharmaceutical sector’s demand is estimated to grow at a CAGR of xx% from 2025 to 2033. This is largely driven by an aging global population and an increase in chronic diseases.
- The agrochemical sector’s segment penetration is forecast to reach xx% by 2033, driven by the rising global food demand and the need for increased crop yield.
- Technological disruptions in production processes, such as the adoption of more efficient and eco-friendly synthetic routes, are enhancing profitability and sustainability.
- The competitive landscape is characterized by both established players and emerging companies, leading to price competition and the constant drive for innovation in product offerings.
Dominant Markets & Segments in Anthranilic Acid
The Asia-Pacific region dominates the global anthranilic acid market, accounting for an estimated xx million in 2025 (xx% market share). China, India, and other Southeast Asian countries are key contributors to this regional dominance, fuelled by rapid industrialization and expanding pharmaceutical and agrochemical sectors.
Key Drivers in Asia-Pacific:
- Favorable government policies supporting chemical manufacturing.
- Robust economic growth and increasing disposable incomes.
- Development of advanced chemical infrastructure.
- Low labor costs.
Dominance Analysis: The region's dominance stems from its large consumer base, low production costs, and the presence of major manufacturing facilities. The relatively low regulatory burden, compared to other regions, also plays a significant role.
Anthranilic Acid Product Developments
Recent product developments in the anthranilic acid market have focused on higher purity grades, customized formulations, and improved delivery systems. The emphasis on cost-effective and eco-friendly production methods is also driving innovation, leading to the development of sustainable synthetic routes and waste reduction techniques. These advancements cater to the increasing demand for high-quality products in diverse applications.
Report Scope & Segmentation Analysis
This report segments the anthranilic acid market by:
- Application: Pharmaceuticals, Agrochemicals, Dyes & Pigments, and Others (e.g. food additives, photography chemicals). The pharmaceutical segment is projected to experience the highest growth rate, followed by agrochemicals.
- Grade: Technical Grade, Pharmaceutical Grade, and Others (e.g., industrial grade). Demand for pharmaceutical-grade anthranilic acid is increasing due to stringent quality requirements in the pharmaceutical industry.
- Region: North America, Europe, Asia-Pacific, South America, and the Middle East & Africa. Asia-Pacific is the dominant region, driven by robust growth in manufacturing and end-use sectors.
Key Drivers of Anthranilic Acid Growth
Several key factors are driving the growth of the anthranilic acid market:
- Rising demand from pharmaceutical and agrochemical sectors: This is the primary growth driver, fueled by increasing global populations and the need for enhanced healthcare and agricultural yields.
- Technological advancements in production: Improved synthesis techniques and efficient manufacturing processes lead to reduced costs and enhanced product quality.
- Supportive government policies: In several key regions, governments are actively promoting the growth of the chemical industry, providing further impetus to market expansion.
Challenges in the Anthranilic Acid Sector
The anthranilic acid market faces several challenges:
- Fluctuations in raw material prices: The cost of key raw materials directly impacts the profitability of anthranilic acid production.
- Stringent environmental regulations: Compliance with stricter environmental norms may increase production costs.
- Intense competition: The presence of numerous manufacturers creates a competitive landscape, influencing pricing and profit margins.
Emerging Opportunities in Anthranilic Acid
Several emerging opportunities exist in the anthranilic acid market:
- Expansion into new applications: Exploration of new applications in diverse industries like cosmetics and food additives can unlock new market segments.
- Development of novel formulations: Custom-designed formulations tailored to specific applications can broaden market reach and enhance product value.
- Focus on sustainability: Adoption of environmentally friendly production methods and sustainable sourcing practices can enhance the market appeal and contribute to a positive environmental impact.
Leading Players in the Anthranilic Acid Market
- Xiangli Chemical
- New Sunlion Chemical
- Shandong Wochi Chemicals
- Shandong Taihong New Material Technology
- Dongying Xinfeng Chemical
- Shandong Co-Strength Chemicals
- Dongying Kexin Chemical
- Mitsuboshi Chemical
- Ambernath Organics
Key Developments in Anthranilic Acid Industry
- 2022 Q4: Xiangli Chemical announced a major expansion of its anthranilic acid production facility in China.
- 2023 Q1: New regulations regarding environmental compliance were introduced in several key regions, impacting production costs and market dynamics.
- 2023 Q3: A new high-purity grade of anthranilic acid was launched by Shandong Wochi Chemicals, catering to the growing pharmaceutical market.
Strategic Outlook for Anthranilic Acid Market
The anthranilic acid market is poised for continued growth, driven by rising demand from key sectors and ongoing technological advancements. Strategic focus on sustainability, innovation in product development, and expansion into emerging markets will be crucial for players to thrive in this dynamic landscape. The potential for new applications and the increasing adoption of eco-friendly manufacturing processes will shape future market dynamics, creating significant opportunities for both established players and new entrants.
Anthranilic Acid Segmentation
-
1. Application
- 1.1. Dye
- 1.2. Pharmaceutical
- 1.3. Others
-
2. Type
- 2.1. Pharmaceutical Grade
- 2.2. Industrial Grade
Anthranilic Acid Segmentation By Geography
-
1. North America
- 1.1. United States
- 1.2. Canada
- 1.3. Mexico
-
2. South America
- 2.1. Brazil
- 2.2. Argentina
- 2.3. Rest of South America
-
3. Europe
- 3.1. United Kingdom
- 3.2. Germany
- 3.3. France
- 3.4. Italy
- 3.5. Spain
- 3.6. Russia
- 3.7. Benelux
- 3.8. Nordics
- 3.9. Rest of Europe
-
4. Middle East & Africa
- 4.1. Turkey
- 4.2. Israel
- 4.3. GCC
- 4.4. North Africa
- 4.5. South Africa
- 4.6. Rest of Middle East & Africa
-
5. Asia Pacific
- 5.1. China
- 5.2. India
- 5.3. Japan
- 5.4. South Korea
- 5.5. ASEAN
- 5.6. Oceania
- 5.7. Rest of Asia Pacific
Anthranilic Acid Regional Market Share
Geographic Coverage of Anthranilic Acid
Anthranilic Acid REPORT HIGHLIGHTS
| Aspects | Details |
|---|---|
| Study Period | 2020-2034 |
| Base Year | 2025 |
| Estimated Year | 2026 |
| Forecast Period | 2026-2034 |
| Historical Period | 2020-2025 |
| Growth Rate | CAGR of 1.6% from 2020-2034 |
| Segmentation |
|
Table of Contents
- 1. Introduction
- 1.1. Research Scope
- 1.2. Market Segmentation
- 1.3. Research Objective
- 1.4. Definitions and Assumptions
- 2. Executive Summary
- 2.1. Market Snapshot
- 3. Market Dynamics
- 3.1. Market Drivers
- 3.2. Market Restrains
- 3.3. Market Trends
- 3.4. Market Opportunities
- 4. Market Factor Analysis
- 4.1. Porters Five Forces
- 4.1.1. Bargaining Power of Suppliers
- 4.1.2. Bargaining Power of Buyers
- 4.1.3. Threat of New Entrants
- 4.1.4. Threat of Substitutes
- 4.1.5. Competitive Rivalry
- 4.2. PESTEL analysis
- 4.3. BCG Analysis
- 4.3.1. Stars (High Growth, High Market Share)
- 4.3.2. Cash Cows (Low Growth, High Market Share)
- 4.3.3. Question Mark (High Growth, Low Market Share)
- 4.3.4. Dogs (Low Growth, Low Market Share)
- 4.4. Ansoff Matrix Analysis
- 4.5. Supply Chain Analysis
- 4.6. Regulatory Landscape
- 4.7. Current Market Potential and Opportunity Assessment (TAM–SAM–SOM Framework)
- 4.8. RAX Analyst Note
- 4.1. Porters Five Forces
- 5. Market Analysis, Insights and Forecast 2021-2033
- 5.1. Market Analysis, Insights and Forecast - by Application
- 5.1.1. Dye
- 5.1.2. Pharmaceutical
- 5.1.3. Others
- 5.2. Market Analysis, Insights and Forecast - by Type
- 5.2.1. Pharmaceutical Grade
- 5.2.2. Industrial Grade
- 5.3. Market Analysis, Insights and Forecast - by Region
- 5.3.1. North America
- 5.3.2. South America
- 5.3.3. Europe
- 5.3.4. Middle East & Africa
- 5.3.5. Asia Pacific
- 5.1. Market Analysis, Insights and Forecast - by Application
- 6. Global Anthranilic Acid Analysis, Insights and Forecast, 2021-2033
- 6.1. Market Analysis, Insights and Forecast - by Application
- 6.1.1. Dye
- 6.1.2. Pharmaceutical
- 6.1.3. Others
- 6.2. Market Analysis, Insights and Forecast - by Type
- 6.2.1. Pharmaceutical Grade
- 6.2.2. Industrial Grade
- 6.1. Market Analysis, Insights and Forecast - by Application
- 7. North America Anthranilic Acid Analysis, Insights and Forecast, 2020-2032
- 7.1. Market Analysis, Insights and Forecast - by Application
- 7.1.1. Dye
- 7.1.2. Pharmaceutical
- 7.1.3. Others
- 7.2. Market Analysis, Insights and Forecast - by Type
- 7.2.1. Pharmaceutical Grade
- 7.2.2. Industrial Grade
- 7.1. Market Analysis, Insights and Forecast - by Application
- 8. South America Anthranilic Acid Analysis, Insights and Forecast, 2020-2032
- 8.1. Market Analysis, Insights and Forecast - by Application
- 8.1.1. Dye
- 8.1.2. Pharmaceutical
- 8.1.3. Others
- 8.2. Market Analysis, Insights and Forecast - by Type
- 8.2.1. Pharmaceutical Grade
- 8.2.2. Industrial Grade
- 8.1. Market Analysis, Insights and Forecast - by Application
- 9. Europe Anthranilic Acid Analysis, Insights and Forecast, 2020-2032
- 9.1. Market Analysis, Insights and Forecast - by Application
- 9.1.1. Dye
- 9.1.2. Pharmaceutical
- 9.1.3. Others
- 9.2. Market Analysis, Insights and Forecast - by Type
- 9.2.1. Pharmaceutical Grade
- 9.2.2. Industrial Grade
- 9.1. Market Analysis, Insights and Forecast - by Application
- 10. Middle East & Africa Anthranilic Acid Analysis, Insights and Forecast, 2020-2032
- 10.1. Market Analysis, Insights and Forecast - by Application
- 10.1.1. Dye
- 10.1.2. Pharmaceutical
- 10.1.3. Others
- 10.2. Market Analysis, Insights and Forecast - by Type
- 10.2.1. Pharmaceutical Grade
- 10.2.2. Industrial Grade
- 10.1. Market Analysis, Insights and Forecast - by Application
- 11. Asia Pacific Anthranilic Acid Analysis, Insights and Forecast, 2020-2032
- 11.1. Market Analysis, Insights and Forecast - by Application
- 11.1.1. Dye
- 11.1.2. Pharmaceutical
- 11.1.3. Others
- 11.2. Market Analysis, Insights and Forecast - by Type
- 11.2.1. Pharmaceutical Grade
- 11.2.2. Industrial Grade
- 11.1. Market Analysis, Insights and Forecast - by Application
- 12. Competitive Analysis
- 12.1. Company Profiles
- 12.1.1 Xiangli Chemical
- 12.1.1.1. Company Overview
- 12.1.1.2. Products
- 12.1.1.3. Company Financials
- 12.1.1.4. SWOT Analysis
- 12.1.2 New Sunlion Chemical
- 12.1.2.1. Company Overview
- 12.1.2.2. Products
- 12.1.2.3. Company Financials
- 12.1.2.4. SWOT Analysis
- 12.1.3 Shandong Wochi Chemicals
- 12.1.3.1. Company Overview
- 12.1.3.2. Products
- 12.1.3.3. Company Financials
- 12.1.3.4. SWOT Analysis
- 12.1.4 Shandong Taihong New Material Technology
- 12.1.4.1. Company Overview
- 12.1.4.2. Products
- 12.1.4.3. Company Financials
- 12.1.4.4. SWOT Analysis
- 12.1.5 Dongying Xinfeng Chemical
- 12.1.5.1. Company Overview
- 12.1.5.2. Products
- 12.1.5.3. Company Financials
- 12.1.5.4. SWOT Analysis
- 12.1.6 Shandong Co-Strength Chemicals
- 12.1.6.1. Company Overview
- 12.1.6.2. Products
- 12.1.6.3. Company Financials
- 12.1.6.4. SWOT Analysis
- 12.1.7 Dongying Kexin Chemical
- 12.1.7.1. Company Overview
- 12.1.7.2. Products
- 12.1.7.3. Company Financials
- 12.1.7.4. SWOT Analysis
- 12.1.8 Mitsuboshi Chemical
- 12.1.8.1. Company Overview
- 12.1.8.2. Products
- 12.1.8.3. Company Financials
- 12.1.8.4. SWOT Analysis
- 12.1.9 Ambernath Organics
- 12.1.9.1. Company Overview
- 12.1.9.2. Products
- 12.1.9.3. Company Financials
- 12.1.9.4. SWOT Analysis
- 12.1.1 Xiangli Chemical
- 12.2. Market Entropy
- 12.2.1 Company's Key Areas Served
- 12.2.2 Recent Developments
- 12.3. Company Market Share Analysis 2025
- 12.3.1 Top 5 Companies Market Share Analysis
- 12.3.2 Top 3 Companies Market Share Analysis
- 12.4. List of Potential Customers
- 13. Research Methodology
List of Figures
- Figure 1: Global Anthranilic Acid Revenue Breakdown (million, %) by Region 2025 & 2033
- Figure 2: North America Anthranilic Acid Revenue (million), by Application 2025 & 2033
- Figure 3: North America Anthranilic Acid Revenue Share (%), by Application 2025 & 2033
- Figure 4: North America Anthranilic Acid Revenue (million), by Type 2025 & 2033
- Figure 5: North America Anthranilic Acid Revenue Share (%), by Type 2025 & 2033
- Figure 6: North America Anthranilic Acid Revenue (million), by Country 2025 & 2033
- Figure 7: North America Anthranilic Acid Revenue Share (%), by Country 2025 & 2033
- Figure 8: South America Anthranilic Acid Revenue (million), by Application 2025 & 2033
- Figure 9: South America Anthranilic Acid Revenue Share (%), by Application 2025 & 2033
- Figure 10: South America Anthranilic Acid Revenue (million), by Type 2025 & 2033
- Figure 11: South America Anthranilic Acid Revenue Share (%), by Type 2025 & 2033
- Figure 12: South America Anthranilic Acid Revenue (million), by Country 2025 & 2033
- Figure 13: South America Anthranilic Acid Revenue Share (%), by Country 2025 & 2033
- Figure 14: Europe Anthranilic Acid Revenue (million), by Application 2025 & 2033
- Figure 15: Europe Anthranilic Acid Revenue Share (%), by Application 2025 & 2033
- Figure 16: Europe Anthranilic Acid Revenue (million), by Type 2025 & 2033
- Figure 17: Europe Anthranilic Acid Revenue Share (%), by Type 2025 & 2033
- Figure 18: Europe Anthranilic Acid Revenue (million), by Country 2025 & 2033
- Figure 19: Europe Anthranilic Acid Revenue Share (%), by Country 2025 & 2033
- Figure 20: Middle East & Africa Anthranilic Acid Revenue (million), by Application 2025 & 2033
- Figure 21: Middle East & Africa Anthranilic Acid Revenue Share (%), by Application 2025 & 2033
- Figure 22: Middle East & Africa Anthranilic Acid Revenue (million), by Type 2025 & 2033
- Figure 23: Middle East & Africa Anthranilic Acid Revenue Share (%), by Type 2025 & 2033
- Figure 24: Middle East & Africa Anthranilic Acid Revenue (million), by Country 2025 & 2033
- Figure 25: Middle East & Africa Anthranilic Acid Revenue Share (%), by Country 2025 & 2033
- Figure 26: Asia Pacific Anthranilic Acid Revenue (million), by Application 2025 & 2033
- Figure 27: Asia Pacific Anthranilic Acid Revenue Share (%), by Application 2025 & 2033
- Figure 28: Asia Pacific Anthranilic Acid Revenue (million), by Type 2025 & 2033
- Figure 29: Asia Pacific Anthranilic Acid Revenue Share (%), by Type 2025 & 2033
- Figure 30: Asia Pacific Anthranilic Acid Revenue (million), by Country 2025 & 2033
- Figure 31: Asia Pacific Anthranilic Acid Revenue Share (%), by Country 2025 & 2033
List of Tables
- Table 1: Global Anthranilic Acid Revenue million Forecast, by Application 2020 & 2033
- Table 2: Global Anthranilic Acid Revenue million Forecast, by Type 2020 & 2033
- Table 3: Global Anthranilic Acid Revenue million Forecast, by Region 2020 & 2033
- Table 4: Global Anthranilic Acid Revenue million Forecast, by Application 2020 & 2033
- Table 5: Global Anthranilic Acid Revenue million Forecast, by Type 2020 & 2033
- Table 6: Global Anthranilic Acid Revenue million Forecast, by Country 2020 & 2033
- Table 7: United States Anthranilic Acid Revenue (million) Forecast, by Application 2020 & 2033
- Table 8: Canada Anthranilic Acid Revenue (million) Forecast, by Application 2020 & 2033
- Table 9: Mexico Anthranilic Acid Revenue (million) Forecast, by Application 2020 & 2033
- Table 10: Global Anthranilic Acid Revenue million Forecast, by Application 2020 & 2033
- Table 11: Global Anthranilic Acid Revenue million Forecast, by Type 2020 & 2033
- Table 12: Global Anthranilic Acid Revenue million Forecast, by Country 2020 & 2033
- Table 13: Brazil Anthranilic Acid Revenue (million) Forecast, by Application 2020 & 2033
- Table 14: Argentina Anthranilic Acid Revenue (million) Forecast, by Application 2020 & 2033
- Table 15: Rest of South America Anthranilic Acid Revenue (million) Forecast, by Application 2020 & 2033
- Table 16: Global Anthranilic Acid Revenue million Forecast, by Application 2020 & 2033
- Table 17: Global Anthranilic Acid Revenue million Forecast, by Type 2020 & 2033
- Table 18: Global Anthranilic Acid Revenue million Forecast, by Country 2020 & 2033
- Table 19: United Kingdom Anthranilic Acid Revenue (million) Forecast, by Application 2020 & 2033
- Table 20: Germany Anthranilic Acid Revenue (million) Forecast, by Application 2020 & 2033
- Table 21: France Anthranilic Acid Revenue (million) Forecast, by Application 2020 & 2033
- Table 22: Italy Anthranilic Acid Revenue (million) Forecast, by Application 2020 & 2033
- Table 23: Spain Anthranilic Acid Revenue (million) Forecast, by Application 2020 & 2033
- Table 24: Russia Anthranilic Acid Revenue (million) Forecast, by Application 2020 & 2033
- Table 25: Benelux Anthranilic Acid Revenue (million) Forecast, by Application 2020 & 2033
- Table 26: Nordics Anthranilic Acid Revenue (million) Forecast, by Application 2020 & 2033
- Table 27: Rest of Europe Anthranilic Acid Revenue (million) Forecast, by Application 2020 & 2033
- Table 28: Global Anthranilic Acid Revenue million Forecast, by Application 2020 & 2033
- Table 29: Global Anthranilic Acid Revenue million Forecast, by Type 2020 & 2033
- Table 30: Global Anthranilic Acid Revenue million Forecast, by Country 2020 & 2033
- Table 31: Turkey Anthranilic Acid Revenue (million) Forecast, by Application 2020 & 2033
- Table 32: Israel Anthranilic Acid Revenue (million) Forecast, by Application 2020 & 2033
- Table 33: GCC Anthranilic Acid Revenue (million) Forecast, by Application 2020 & 2033
- Table 34: North Africa Anthranilic Acid Revenue (million) Forecast, by Application 2020 & 2033
- Table 35: South Africa Anthranilic Acid Revenue (million) Forecast, by Application 2020 & 2033
- Table 36: Rest of Middle East & Africa Anthranilic Acid Revenue (million) Forecast, by Application 2020 & 2033
- Table 37: Global Anthranilic Acid Revenue million Forecast, by Application 2020 & 2033
- Table 38: Global Anthranilic Acid Revenue million Forecast, by Type 2020 & 2033
- Table 39: Global Anthranilic Acid Revenue million Forecast, by Country 2020 & 2033
- Table 40: China Anthranilic Acid Revenue (million) Forecast, by Application 2020 & 2033
- Table 41: India Anthranilic Acid Revenue (million) Forecast, by Application 2020 & 2033
- Table 42: Japan Anthranilic Acid Revenue (million) Forecast, by Application 2020 & 2033
- Table 43: South Korea Anthranilic Acid Revenue (million) Forecast, by Application 2020 & 2033
- Table 44: ASEAN Anthranilic Acid Revenue (million) Forecast, by Application 2020 & 2033
- Table 45: Oceania Anthranilic Acid Revenue (million) Forecast, by Application 2020 & 2033
- Table 46: Rest of Asia Pacific Anthranilic Acid Revenue (million) Forecast, by Application 2020 & 2033
Frequently Asked Questions
1. What is the projected Compound Annual Growth Rate (CAGR) of the Anthranilic Acid?
The projected CAGR is approximately 1.6%.
2. Which companies are prominent players in the Anthranilic Acid?
Key companies in the market include Xiangli Chemical, New Sunlion Chemical, Shandong Wochi Chemicals, Shandong Taihong New Material Technology, Dongying Xinfeng Chemical, Shandong Co-Strength Chemicals, Dongying Kexin Chemical, Mitsuboshi Chemical, Ambernath Organics.
3. What are the main segments of the Anthranilic Acid?
The market segments include Application, Type.
4. Can you provide details about the market size?
The market size is estimated to be USD 146 million as of 2022.
5. What are some drivers contributing to market growth?
N/A
6. What are the notable trends driving market growth?
N/A
7. Are there any restraints impacting market growth?
N/A
8. Can you provide examples of recent developments in the market?
N/A
9. What pricing options are available for accessing the report?
Pricing options include single-user, multi-user, and enterprise licenses priced at USD 5900.00, USD 8850.00, and USD 11800.00 respectively.
10. Is the market size provided in terms of value or volume?
The market size is provided in terms of value, measured in million.
11. Are there any specific market keywords associated with the report?
Yes, the market keyword associated with the report is "Anthranilic Acid," which aids in identifying and referencing the specific market segment covered.
12. How do I determine which pricing option suits my needs best?
The pricing options vary based on user requirements and access needs. Individual users may opt for single-user licenses, while businesses requiring broader access may choose multi-user or enterprise licenses for cost-effective access to the report.
13. Are there any additional resources or data provided in the Anthranilic Acid report?
While the report offers comprehensive insights, it's advisable to review the specific contents or supplementary materials provided to ascertain if additional resources or data are available.
14. How can I stay updated on further developments or reports in the Anthranilic Acid?
To stay informed about further developments, trends, and reports in the Anthranilic Acid, consider subscribing to industry newsletters, following relevant companies and organizations, or regularly checking reputable industry news sources and publications.
Methodology
Step 1 - Identification of Relevant Samples Size from Population Database


Step 2 - Approaches for Defining Global Market Size (Value, Volume* & Price*)

Note*: In applicable scenarios
Step 3 - Data Sources
Primary Research
- Web Analytics
- Survey Reports
- Research Institute
- Latest Research Reports
- Opinion Leaders
Secondary Research
- Annual Reports
- White Paper
- Latest Press Release
- Industry Association
- Paid Database
- Investor Presentations

Step 4 - Data Triangulation
Involves using different sources of information in order to increase the validity of a study
These sources are likely to be stakeholders in a program - participants, other researchers, program staff, other community members, and so on.
Then we put all data in single framework & apply various statistical tools to find out the dynamic on the market.
During the analysis stage, feedback from the stakeholder groups would be compared to determine areas of agreement as well as areas of divergence