
Key Insights
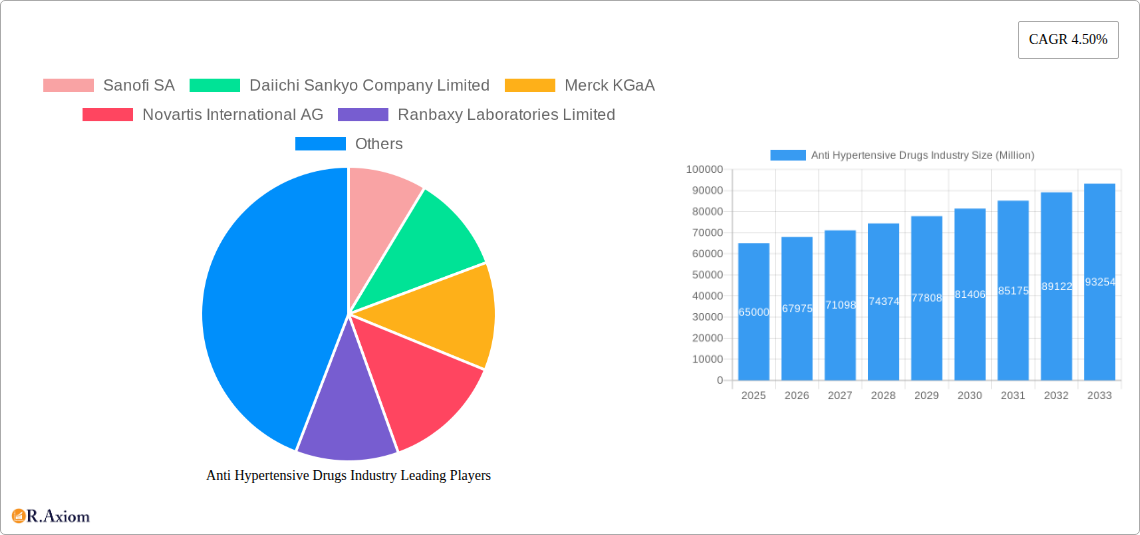
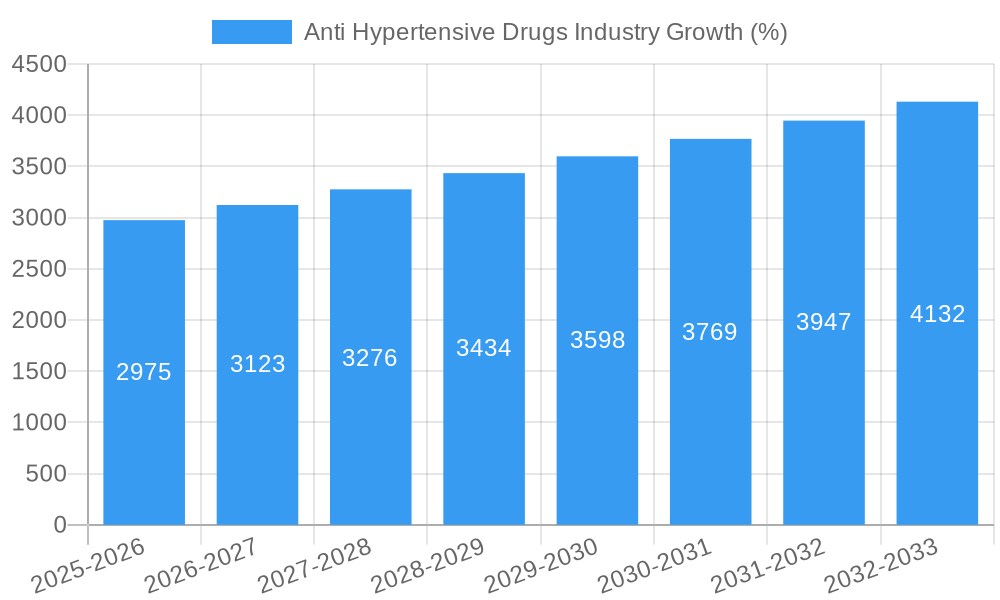
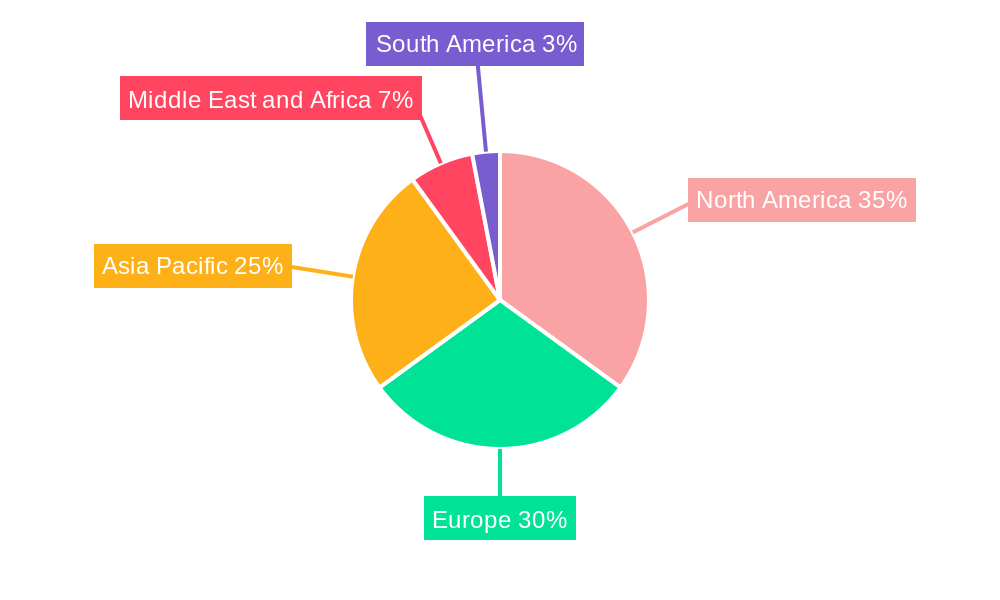
The global antihypertensive drugs market, valued at approximately $65 billion in 2025, is projected to experience robust growth, driven by rising prevalence of hypertension globally, an aging population increasingly susceptible to cardiovascular diseases, and the continuous development of innovative treatment options. The market's compound annual growth rate (CAGR) of 4.50% from 2025 to 2033 indicates a steady expansion, with the market size expected to exceed $95 billion by 2033. Key therapeutic classes driving this growth include ACE inhibitors, ARBs, and calcium channel blockers, owing to their efficacy and established market presence. However, the market faces certain restraints, such as the emergence of generic competition, increasing healthcare costs, and potential side effects associated with some antihypertensive medications. The market's segmentation by therapeutic class allows for a nuanced understanding of individual drug performance and future market projections. Regional variations are also significant, with North America and Europe currently holding larger market shares due to higher healthcare spending and advanced healthcare infrastructure, though the Asia-Pacific region is expected to witness significant growth in the coming years due to its rapidly expanding population and increasing awareness of cardiovascular health.
The competitive landscape is characterized by the presence of several major pharmaceutical companies, including Sanofi, Daiichi Sankyo, Merck KGaA, Novartis, and Pfizer, actively involved in research and development of new antihypertensive drugs and expanding their market presence through strategic partnerships and acquisitions. Future growth will likely be influenced by the introduction of novel therapies targeting specific hypertension subtypes, personalized medicine approaches, and advancements in drug delivery systems. Furthermore, increasing focus on preventative healthcare and public health initiatives aimed at controlling hypertension could significantly shape the market's trajectory. Continued innovation in drug development and expanding access to affordable healthcare in developing economies will be crucial factors influencing market expansion over the forecast period.
Anti Hypertensive Drugs Industry Market Report: 2019-2033
This comprehensive report provides an in-depth analysis of the global anti-hypertensive drugs market, offering valuable insights for stakeholders across the pharmaceutical industry. The report covers the period 2019-2033, with a focus on the forecast period 2025-2033 and a base year of 2025. It meticulously examines market size, growth drivers, challenges, emerging opportunities, and competitive dynamics, providing actionable intelligence for strategic decision-making. The report utilizes data from 2019-2024 as its historical period and incorporates an estimated market size for 2025 (values in Million).
Anti Hypertensive Drugs Industry Market Concentration & Innovation
The anti-hypertensive drugs market exhibits a moderately concentrated structure, with several multinational pharmaceutical giants holding significant market share. Companies such as Sanofi SA, Novartis International AG, AstraZeneca PLC, and Pfizer Inc. dominate the landscape, leveraging their extensive research and development capabilities, global distribution networks, and established brand recognition. However, the market also features a considerable number of smaller players, particularly in the generic drug segment.
Market share data from 2024 suggests that the top five players collectively account for approximately xx% of the global market, while the remaining xx% is distributed among numerous smaller companies and regional players. Innovation within the industry is driven by the ongoing need for more effective, safer, and better-tolerated anti-hypertensive treatments. This is fueled by the growing prevalence of hypertension globally and the emergence of drug resistance.
Regulatory frameworks, like those set by the FDA and EMA, play a significant role in shaping innovation and market access. The stringent regulatory environment requires extensive clinical trials and robust safety data, which leads to high development costs but ensures drug safety and efficacy. The emergence of biosimilars and generic competition presents considerable challenges to innovator companies, resulting in a continuous drive for innovation in therapeutic classes and drug delivery systems. Mergers and acquisitions (M&A) activity is frequent, with large pharmaceutical companies acquiring smaller innovative biotech firms to expand their product portfolios and enhance their competitive advantage. Total M&A deal values in the anti-hypertensive drugs sector between 2019 and 2024 amounted to approximately xx Million.
- Key Metrics: Market Share (Top 5 players: xx%), M&A Deal Value (2019-2024: xx Million)
- Key Players: Sanofi SA, Daiichi Sankyo Company Limited, Merck KGaA, Novartis International AG, Ranbaxy Laboratories Limited, C H Boehringer Sohn AG & Ko KG, AstraZeneca PLC, Johnson & Johnson, Lupin Limited, Noden Pharma DAC, Pfizer Inc.
Anti Hypertensive Drugs Industry Industry Trends & Insights
The global anti-hypertensive drugs market is experiencing steady growth, driven by several key factors. The escalating prevalence of hypertension worldwide, particularly in developing countries, is a major growth catalyst. Aging populations and lifestyle changes, including increased consumption of processed foods, lack of physical activity, and rising stress levels, contribute significantly to this rise. The market's growth is also influenced by increased awareness of hypertension and its associated health risks, leading to improved diagnosis and treatment rates. Technological advancements, such as the development of novel drug delivery systems and personalized medicine approaches, are further propelling market expansion. The market is witnessing a shift towards combination therapies that offer enhanced efficacy and convenience for patients.
Competitive dynamics are intense, with both established pharmaceutical companies and generic drug manufacturers vying for market share. The introduction of biosimilars and the expiry of patents on blockbuster drugs are increasing competitive pressure and forcing companies to focus on innovation and cost optimization. Market penetration rates vary across different therapeutic classes, with some classes, like ACE inhibitors and ARBs, enjoying higher penetration due to their established efficacy and widespread use. The overall CAGR for the global anti-hypertensive drugs market during the forecast period (2025-2033) is projected to be around xx%. This projection considers various factors, including the global healthcare expenditure, prevalence of hypertension, and competitive intensity.
Dominant Markets & Segments in Anti Hypertensive Drugs Industry
The North American region currently dominates the anti-hypertensive drugs market, followed by Europe and Asia-Pacific. This dominance is attributed to several factors, including high healthcare expenditure, advanced healthcare infrastructure, and high prevalence of hypertension.
- Key Drivers of Regional Dominance:
- North America: High healthcare expenditure, well-established healthcare infrastructure, high prevalence of hypertension, robust research and development activities.
- Europe: High healthcare expenditure, advanced healthcare infrastructure, sizable aging population, strong regulatory environment.
- Asia-Pacific: Rapidly growing economy, rising prevalence of hypertension, increasing healthcare spending, expanding middle class with improved access to healthcare.
Dominant Therapeutic Classes:
ACE inhibitors and ARBs currently represent the largest segments within the therapeutic class classification, driven by their established efficacy and widespread clinical use. However, calcium channel blockers and diuretics also hold significant market share, contributing substantially to overall market value. The “Other Therapeutic Classes” segment includes newer, more targeted therapies and is expected to grow steadily over the forecast period. The growth of individual segments is influenced by factors like drug efficacy, safety profile, cost-effectiveness, and regulatory approval timelines.
Anti Hypertensive Drugs Industry Product Developments
Recent product innovations in the anti-hypertensive drugs market focus on improving efficacy, reducing side effects, and enhancing patient compliance. This involves developing novel drug combinations, exploring targeted drug delivery systems, and utilizing advanced formulations to enhance bioavailability. Innovations include fixed-dose combination therapies to simplify treatment regimens and improve patient adherence. Technological advancements in drug delivery, such as extended-release formulations and transdermal patches, contribute to improved treatment outcomes. The market continues to see development in newer therapeutic classes designed to address specific unmet medical needs, such as resistance to currently available therapies. These innovations aim to address limitations of existing treatments and provide improved therapeutic options to patients.
Report Scope & Segmentation Analysis
This report segments the anti-hypertensive drugs market based on therapeutic class: Diuretics, ACE inhibitors, ARBs, Beta-blockers, Alpha-blockers, Renin inhibitors, Calcium Channel Blockers, and Other Therapeutic Classes. Each segment is analyzed in detail based on growth projections, market size (xx Million in 2025), and competitive dynamics. For instance, the ACE inhibitors segment is expected to witness significant growth due to its established efficacy and wide acceptance among healthcare professionals. In contrast, the Renin inhibitors segment, while smaller, is expected to demonstrate robust growth due to the emergence of new, innovative therapies targeting this specific pathway. Market size projections are presented for each segment throughout the forecast period. Competitive dynamics within each segment are influenced by factors such as patent expiries, generic competition, and the introduction of novel therapies.
Key Drivers of Anti Hypertensive Drugs Industry Growth
Several factors drive the growth of the anti-hypertensive drugs market. The rising prevalence of hypertension globally due to lifestyle changes, aging populations, and increased awareness of cardiovascular disease is a primary driver. Technological advancements such as novel drug delivery systems and combination therapies improve treatment efficacy and patient compliance. The increased healthcare expenditure worldwide, particularly in developing economies, facilitates increased access to these life-saving medications. Favorable regulatory environments, coupled with the ongoing research and development of innovative therapies, further support market expansion.
Challenges in the Anti Hypertensive Drugs Industry Sector
The anti-hypertensive drugs market faces certain challenges. The increasing prevalence of generic competition erodes margins for innovator companies. Stringent regulatory requirements and the lengthy approval processes for new drugs increase development costs and timelines. Supply chain disruptions, particularly those caused by geopolitical instability or natural disasters, can impact drug availability and affordability. Adverse drug reactions associated with certain anti-hypertensive medications necessitate careful patient monitoring and selection of appropriate therapies. The overall impact of these challenges varies by region and therapeutic class.
Emerging Opportunities in Anti Hypertensive Drugs Industry
Significant opportunities exist within the anti-hypertensive drugs market. The development and commercialization of novel therapies targeting specific unmet medical needs, such as drug resistance and specific patient subpopulations, represents a major opportunity. The emergence of personalized medicine approaches allows for tailored treatment strategies based on individual patient characteristics. Expanding into new, underserved markets in developing countries presents a considerable growth potential. The integration of digital health technologies for improved patient monitoring and adherence offers additional opportunities for market expansion.
Leading Players in the Anti Hypertensive Drugs Industry Market
- Sanofi SA
- Daiichi Sankyo Company Limited
- Merck KGaA
- Novartis International AG
- Ranbaxy Laboratories Limited
- C H Boehringer Sohn AG & Ko KG
- AstraZeneca PLC
- Johnson & Johnson
- Lupin Limited
- Noden Pharma DAC
- Pfizer Inc
Key Developments in Anti Hypertensive Drugs Industry Industry
- May 2022: Hanmi Pharmaceutical launches Amosartan (Meiyaping) in China, marking the first homegrown blood pressure combination therapy in the Chinese market. This development significantly impacts market dynamics by increasing competition and potentially offering a more affordable treatment option within a large and growing market.
- March 2022: Pfizer Inc. recalls a blood pressure drug due to elevated levels of a potentially cancer-causing impurity. This highlights the importance of stringent quality control and the potential for significant financial and reputational consequences related to product safety issues.
Strategic Outlook for Anti Hypertensive Drugs Industry Market
The future of the anti-hypertensive drugs market appears positive, driven by continued growth in the prevalence of hypertension, aging populations, and advancements in drug development. Companies that strategically invest in research and development, focus on personalized medicine, and expand into emerging markets are poised for significant growth. Addressing unmet medical needs, optimizing drug delivery systems, and ensuring patient adherence remain critical for future success within this dynamic and vital sector of the pharmaceutical industry. The increasing focus on digital health and telemedicine will likely enhance patient access and treatment adherence.
Anti Hypertensive Drugs Industry Segmentation
-
1. Therapeutic Class
- 1.1. Diuretics
- 1.2. Angiotensin Converting Enzyme (ACE) Inhibitors
- 1.3. Angiotensin Receptor Blockers (ARBs)
- 1.4. Beta Blockers
- 1.5. Alpha Blockers
- 1.6. Renin Inhibitors
- 1.7. Calcium Channel Blockers
- 1.8. Other Therapeutic Classes
Anti Hypertensive Drugs Industry Segmentation By Geography
-
1. North America
- 1.1. United States
- 1.2. Canada
- 1.3. Mexico
-
2. Europe
- 2.1. Germany
- 2.2. United Kingdom
- 2.3. France
- 2.4. Italy
- 2.5. Spain
- 2.6. Rest of Europe
-
3. Asia Pacific
- 3.1. China
- 3.2. Japan
- 3.3. India
- 3.4. Australia
- 3.5. South korea
- 3.6. Rest of Asia Pacific
-
4. Middle East and Africa
- 4.1. GCC
- 4.2. South Africa
- 4.3. Rest of Middle East and Africa
-
5. South America
- 5.1. Brazil
- 5.2. Argentina
- 5.3. Rest of South America
Anti Hypertensive Drugs Industry REPORT HIGHLIGHTS
| Aspects | Details |
|---|---|
| Study Period | 2019-2033 |
| Base Year | 2024 |
| Estimated Year | 2025 |
| Forecast Period | 2025-2033 |
| Historical Period | 2019-2024 |
| Growth Rate | CAGR of 4.50% from 2019-2033 |
| Segmentation |
|
Table of Contents
- 1. Introduction
- 1.1. Research Scope
- 1.2. Market Segmentation
- 1.3. Research Methodology
- 1.4. Definitions and Assumptions
- 2. Executive Summary
- 2.1. Introduction
- 3. Market Dynamics
- 3.1. Introduction
- 3.2. Market Drivers
- 3.2.1. Increasing Prevalence of Hypertension; Growing Initiatives by Private and Government Organizations; Rising Awareness about Hypertension
- 3.3. Market Restrains
- 3.3.1. Multiple Major Drug Patent Expiration; Side-effects of Treatment Options and Rise in Non-pharmacological Therapy
- 3.4. Market Trends
- 3.4.1. Diuretics Therapeutics Class is Expected to Hold a Significant Market Share in the Forecast Period
- 4. Market Factor Analysis
- 4.1. Porters Five Forces
- 4.2. Supply/Value Chain
- 4.3. PESTEL analysis
- 4.4. Market Entropy
- 4.5. Patent/Trademark Analysis
- 5. Global Anti Hypertensive Drugs Industry Analysis, Insights and Forecast, 2019-2031
- 5.1. Market Analysis, Insights and Forecast - by Therapeutic Class
- 5.1.1. Diuretics
- 5.1.2. Angiotensin Converting Enzyme (ACE) Inhibitors
- 5.1.3. Angiotensin Receptor Blockers (ARBs)
- 5.1.4. Beta Blockers
- 5.1.5. Alpha Blockers
- 5.1.6. Renin Inhibitors
- 5.1.7. Calcium Channel Blockers
- 5.1.8. Other Therapeutic Classes
- 5.2. Market Analysis, Insights and Forecast - by Region
- 5.2.1. North America
- 5.2.2. Europe
- 5.2.3. Asia Pacific
- 5.2.4. Middle East and Africa
- 5.2.5. South America
- 5.1. Market Analysis, Insights and Forecast - by Therapeutic Class
- 6. North America Anti Hypertensive Drugs Industry Analysis, Insights and Forecast, 2019-2031
- 6.1. Market Analysis, Insights and Forecast - by Therapeutic Class
- 6.1.1. Diuretics
- 6.1.2. Angiotensin Converting Enzyme (ACE) Inhibitors
- 6.1.3. Angiotensin Receptor Blockers (ARBs)
- 6.1.4. Beta Blockers
- 6.1.5. Alpha Blockers
- 6.1.6. Renin Inhibitors
- 6.1.7. Calcium Channel Blockers
- 6.1.8. Other Therapeutic Classes
- 6.1. Market Analysis, Insights and Forecast - by Therapeutic Class
- 7. Europe Anti Hypertensive Drugs Industry Analysis, Insights and Forecast, 2019-2031
- 7.1. Market Analysis, Insights and Forecast - by Therapeutic Class
- 7.1.1. Diuretics
- 7.1.2. Angiotensin Converting Enzyme (ACE) Inhibitors
- 7.1.3. Angiotensin Receptor Blockers (ARBs)
- 7.1.4. Beta Blockers
- 7.1.5. Alpha Blockers
- 7.1.6. Renin Inhibitors
- 7.1.7. Calcium Channel Blockers
- 7.1.8. Other Therapeutic Classes
- 7.1. Market Analysis, Insights and Forecast - by Therapeutic Class
- 8. Asia Pacific Anti Hypertensive Drugs Industry Analysis, Insights and Forecast, 2019-2031
- 8.1. Market Analysis, Insights and Forecast - by Therapeutic Class
- 8.1.1. Diuretics
- 8.1.2. Angiotensin Converting Enzyme (ACE) Inhibitors
- 8.1.3. Angiotensin Receptor Blockers (ARBs)
- 8.1.4. Beta Blockers
- 8.1.5. Alpha Blockers
- 8.1.6. Renin Inhibitors
- 8.1.7. Calcium Channel Blockers
- 8.1.8. Other Therapeutic Classes
- 8.1. Market Analysis, Insights and Forecast - by Therapeutic Class
- 9. Middle East and Africa Anti Hypertensive Drugs Industry Analysis, Insights and Forecast, 2019-2031
- 9.1. Market Analysis, Insights and Forecast - by Therapeutic Class
- 9.1.1. Diuretics
- 9.1.2. Angiotensin Converting Enzyme (ACE) Inhibitors
- 9.1.3. Angiotensin Receptor Blockers (ARBs)
- 9.1.4. Beta Blockers
- 9.1.5. Alpha Blockers
- 9.1.6. Renin Inhibitors
- 9.1.7. Calcium Channel Blockers
- 9.1.8. Other Therapeutic Classes
- 9.1. Market Analysis, Insights and Forecast - by Therapeutic Class
- 10. South America Anti Hypertensive Drugs Industry Analysis, Insights and Forecast, 2019-2031
- 10.1. Market Analysis, Insights and Forecast - by Therapeutic Class
- 10.1.1. Diuretics
- 10.1.2. Angiotensin Converting Enzyme (ACE) Inhibitors
- 10.1.3. Angiotensin Receptor Blockers (ARBs)
- 10.1.4. Beta Blockers
- 10.1.5. Alpha Blockers
- 10.1.6. Renin Inhibitors
- 10.1.7. Calcium Channel Blockers
- 10.1.8. Other Therapeutic Classes
- 10.1. Market Analysis, Insights and Forecast - by Therapeutic Class
- 11. North America Anti Hypertensive Drugs Industry Analysis, Insights and Forecast, 2019-2031
- 11.1. Market Analysis, Insights and Forecast - By Country/Sub-region
- 11.1.1. undefined
- 12. Europe Anti Hypertensive Drugs Industry Analysis, Insights and Forecast, 2019-2031
- 12.1. Market Analysis, Insights and Forecast - By Country/Sub-region
- 12.1.1. undefined
- 13. Asia Pacific Anti Hypertensive Drugs Industry Analysis, Insights and Forecast, 2019-2031
- 13.1. Market Analysis, Insights and Forecast - By Country/Sub-region
- 13.1.1. undefined
- 14. Middle East and Africa Anti Hypertensive Drugs Industry Analysis, Insights and Forecast, 2019-2031
- 14.1. Market Analysis, Insights and Forecast - By Country/Sub-region
- 14.1.1. undefined
- 15. South America Anti Hypertensive Drugs Industry Analysis, Insights and Forecast, 2019-2031
- 15.1. Market Analysis, Insights and Forecast - By Country/Sub-region
- 15.1.1. undefined
- 16. Competitive Analysis
- 16.1. Global Market Share Analysis 2024
- 16.2. Company Profiles
- 16.2.1 Sanofi SA
- 16.2.1.1. Overview
- 16.2.1.2. Products
- 16.2.1.3. SWOT Analysis
- 16.2.1.4. Recent Developments
- 16.2.1.5. Financials (Based on Availability)
- 16.2.2 Daiichi Sankyo Company Limited
- 16.2.2.1. Overview
- 16.2.2.2. Products
- 16.2.2.3. SWOT Analysis
- 16.2.2.4. Recent Developments
- 16.2.2.5. Financials (Based on Availability)
- 16.2.3 Merck KGaA
- 16.2.3.1. Overview
- 16.2.3.2. Products
- 16.2.3.3. SWOT Analysis
- 16.2.3.4. Recent Developments
- 16.2.3.5. Financials (Based on Availability)
- 16.2.4 Novartis International AG
- 16.2.4.1. Overview
- 16.2.4.2. Products
- 16.2.4.3. SWOT Analysis
- 16.2.4.4. Recent Developments
- 16.2.4.5. Financials (Based on Availability)
- 16.2.5 Ranbaxy Laboratories Limited
- 16.2.5.1. Overview
- 16.2.5.2. Products
- 16.2.5.3. SWOT Analysis
- 16.2.5.4. Recent Developments
- 16.2.5.5. Financials (Based on Availability)
- 16.2.6 C H Boehringer Sohn AG & Ko KG
- 16.2.6.1. Overview
- 16.2.6.2. Products
- 16.2.6.3. SWOT Analysis
- 16.2.6.4. Recent Developments
- 16.2.6.5. Financials (Based on Availability)
- 16.2.7 AstraZeneca PLC
- 16.2.7.1. Overview
- 16.2.7.2. Products
- 16.2.7.3. SWOT Analysis
- 16.2.7.4. Recent Developments
- 16.2.7.5. Financials (Based on Availability)
- 16.2.8 Johnson & Johnson
- 16.2.8.1. Overview
- 16.2.8.2. Products
- 16.2.8.3. SWOT Analysis
- 16.2.8.4. Recent Developments
- 16.2.8.5. Financials (Based on Availability)
- 16.2.9 Lupin Limited
- 16.2.9.1. Overview
- 16.2.9.2. Products
- 16.2.9.3. SWOT Analysis
- 16.2.9.4. Recent Developments
- 16.2.9.5. Financials (Based on Availability)
- 16.2.10 Noden Pharma DAC
- 16.2.10.1. Overview
- 16.2.10.2. Products
- 16.2.10.3. SWOT Analysis
- 16.2.10.4. Recent Developments
- 16.2.10.5. Financials (Based on Availability)
- 16.2.11 Pfizer Inc
- 16.2.11.1. Overview
- 16.2.11.2. Products
- 16.2.11.3. SWOT Analysis
- 16.2.11.4. Recent Developments
- 16.2.11.5. Financials (Based on Availability)
- 16.2.1 Sanofi SA
List of Figures
- Figure 1: Global Anti Hypertensive Drugs Industry Revenue Breakdown (Million, %) by Region 2024 & 2032
- Figure 2: Global Anti Hypertensive Drugs Industry Volume Breakdown (K Unit, %) by Region 2024 & 2032
- Figure 3: North America Anti Hypertensive Drugs Industry Revenue (Million), by Country 2024 & 2032
- Figure 4: North America Anti Hypertensive Drugs Industry Volume (K Unit), by Country 2024 & 2032
- Figure 5: North America Anti Hypertensive Drugs Industry Revenue Share (%), by Country 2024 & 2032
- Figure 6: North America Anti Hypertensive Drugs Industry Volume Share (%), by Country 2024 & 2032
- Figure 7: Europe Anti Hypertensive Drugs Industry Revenue (Million), by Country 2024 & 2032
- Figure 8: Europe Anti Hypertensive Drugs Industry Volume (K Unit), by Country 2024 & 2032
- Figure 9: Europe Anti Hypertensive Drugs Industry Revenue Share (%), by Country 2024 & 2032
- Figure 10: Europe Anti Hypertensive Drugs Industry Volume Share (%), by Country 2024 & 2032
- Figure 11: Asia Pacific Anti Hypertensive Drugs Industry Revenue (Million), by Country 2024 & 2032
- Figure 12: Asia Pacific Anti Hypertensive Drugs Industry Volume (K Unit), by Country 2024 & 2032
- Figure 13: Asia Pacific Anti Hypertensive Drugs Industry Revenue Share (%), by Country 2024 & 2032
- Figure 14: Asia Pacific Anti Hypertensive Drugs Industry Volume Share (%), by Country 2024 & 2032
- Figure 15: Middle East and Africa Anti Hypertensive Drugs Industry Revenue (Million), by Country 2024 & 2032
- Figure 16: Middle East and Africa Anti Hypertensive Drugs Industry Volume (K Unit), by Country 2024 & 2032
- Figure 17: Middle East and Africa Anti Hypertensive Drugs Industry Revenue Share (%), by Country 2024 & 2032
- Figure 18: Middle East and Africa Anti Hypertensive Drugs Industry Volume Share (%), by Country 2024 & 2032
- Figure 19: South America Anti Hypertensive Drugs Industry Revenue (Million), by Country 2024 & 2032
- Figure 20: South America Anti Hypertensive Drugs Industry Volume (K Unit), by Country 2024 & 2032
- Figure 21: South America Anti Hypertensive Drugs Industry Revenue Share (%), by Country 2024 & 2032
- Figure 22: South America Anti Hypertensive Drugs Industry Volume Share (%), by Country 2024 & 2032
- Figure 23: North America Anti Hypertensive Drugs Industry Revenue (Million), by Therapeutic Class 2024 & 2032
- Figure 24: North America Anti Hypertensive Drugs Industry Volume (K Unit), by Therapeutic Class 2024 & 2032
- Figure 25: North America Anti Hypertensive Drugs Industry Revenue Share (%), by Therapeutic Class 2024 & 2032
- Figure 26: North America Anti Hypertensive Drugs Industry Volume Share (%), by Therapeutic Class 2024 & 2032
- Figure 27: North America Anti Hypertensive Drugs Industry Revenue (Million), by Country 2024 & 2032
- Figure 28: North America Anti Hypertensive Drugs Industry Volume (K Unit), by Country 2024 & 2032
- Figure 29: North America Anti Hypertensive Drugs Industry Revenue Share (%), by Country 2024 & 2032
- Figure 30: North America Anti Hypertensive Drugs Industry Volume Share (%), by Country 2024 & 2032
- Figure 31: Europe Anti Hypertensive Drugs Industry Revenue (Million), by Therapeutic Class 2024 & 2032
- Figure 32: Europe Anti Hypertensive Drugs Industry Volume (K Unit), by Therapeutic Class 2024 & 2032
- Figure 33: Europe Anti Hypertensive Drugs Industry Revenue Share (%), by Therapeutic Class 2024 & 2032
- Figure 34: Europe Anti Hypertensive Drugs Industry Volume Share (%), by Therapeutic Class 2024 & 2032
- Figure 35: Europe Anti Hypertensive Drugs Industry Revenue (Million), by Country 2024 & 2032
- Figure 36: Europe Anti Hypertensive Drugs Industry Volume (K Unit), by Country 2024 & 2032
- Figure 37: Europe Anti Hypertensive Drugs Industry Revenue Share (%), by Country 2024 & 2032
- Figure 38: Europe Anti Hypertensive Drugs Industry Volume Share (%), by Country 2024 & 2032
- Figure 39: Asia Pacific Anti Hypertensive Drugs Industry Revenue (Million), by Therapeutic Class 2024 & 2032
- Figure 40: Asia Pacific Anti Hypertensive Drugs Industry Volume (K Unit), by Therapeutic Class 2024 & 2032
- Figure 41: Asia Pacific Anti Hypertensive Drugs Industry Revenue Share (%), by Therapeutic Class 2024 & 2032
- Figure 42: Asia Pacific Anti Hypertensive Drugs Industry Volume Share (%), by Therapeutic Class 2024 & 2032
- Figure 43: Asia Pacific Anti Hypertensive Drugs Industry Revenue (Million), by Country 2024 & 2032
- Figure 44: Asia Pacific Anti Hypertensive Drugs Industry Volume (K Unit), by Country 2024 & 2032
- Figure 45: Asia Pacific Anti Hypertensive Drugs Industry Revenue Share (%), by Country 2024 & 2032
- Figure 46: Asia Pacific Anti Hypertensive Drugs Industry Volume Share (%), by Country 2024 & 2032
- Figure 47: Middle East and Africa Anti Hypertensive Drugs Industry Revenue (Million), by Therapeutic Class 2024 & 2032
- Figure 48: Middle East and Africa Anti Hypertensive Drugs Industry Volume (K Unit), by Therapeutic Class 2024 & 2032
- Figure 49: Middle East and Africa Anti Hypertensive Drugs Industry Revenue Share (%), by Therapeutic Class 2024 & 2032
- Figure 50: Middle East and Africa Anti Hypertensive Drugs Industry Volume Share (%), by Therapeutic Class 2024 & 2032
- Figure 51: Middle East and Africa Anti Hypertensive Drugs Industry Revenue (Million), by Country 2024 & 2032
- Figure 52: Middle East and Africa Anti Hypertensive Drugs Industry Volume (K Unit), by Country 2024 & 2032
- Figure 53: Middle East and Africa Anti Hypertensive Drugs Industry Revenue Share (%), by Country 2024 & 2032
- Figure 54: Middle East and Africa Anti Hypertensive Drugs Industry Volume Share (%), by Country 2024 & 2032
- Figure 55: South America Anti Hypertensive Drugs Industry Revenue (Million), by Therapeutic Class 2024 & 2032
- Figure 56: South America Anti Hypertensive Drugs Industry Volume (K Unit), by Therapeutic Class 2024 & 2032
- Figure 57: South America Anti Hypertensive Drugs Industry Revenue Share (%), by Therapeutic Class 2024 & 2032
- Figure 58: South America Anti Hypertensive Drugs Industry Volume Share (%), by Therapeutic Class 2024 & 2032
- Figure 59: South America Anti Hypertensive Drugs Industry Revenue (Million), by Country 2024 & 2032
- Figure 60: South America Anti Hypertensive Drugs Industry Volume (K Unit), by Country 2024 & 2032
- Figure 61: South America Anti Hypertensive Drugs Industry Revenue Share (%), by Country 2024 & 2032
- Figure 62: South America Anti Hypertensive Drugs Industry Volume Share (%), by Country 2024 & 2032
List of Tables
- Table 1: Global Anti Hypertensive Drugs Industry Revenue Million Forecast, by Region 2019 & 2032
- Table 2: Global Anti Hypertensive Drugs Industry Volume K Unit Forecast, by Region 2019 & 2032
- Table 3: Global Anti Hypertensive Drugs Industry Revenue Million Forecast, by Therapeutic Class 2019 & 2032
- Table 4: Global Anti Hypertensive Drugs Industry Volume K Unit Forecast, by Therapeutic Class 2019 & 2032
- Table 5: Global Anti Hypertensive Drugs Industry Revenue Million Forecast, by Region 2019 & 2032
- Table 6: Global Anti Hypertensive Drugs Industry Volume K Unit Forecast, by Region 2019 & 2032
- Table 7: Global Anti Hypertensive Drugs Industry Revenue Million Forecast, by Country 2019 & 2032
- Table 8: Global Anti Hypertensive Drugs Industry Volume K Unit Forecast, by Country 2019 & 2032
- Table 9: Global Anti Hypertensive Drugs Industry Revenue Million Forecast, by Country 2019 & 2032
- Table 10: Global Anti Hypertensive Drugs Industry Volume K Unit Forecast, by Country 2019 & 2032
- Table 11: Global Anti Hypertensive Drugs Industry Revenue Million Forecast, by Country 2019 & 2032
- Table 12: Global Anti Hypertensive Drugs Industry Volume K Unit Forecast, by Country 2019 & 2032
- Table 13: Global Anti Hypertensive Drugs Industry Revenue Million Forecast, by Country 2019 & 2032
- Table 14: Global Anti Hypertensive Drugs Industry Volume K Unit Forecast, by Country 2019 & 2032
- Table 15: Global Anti Hypertensive Drugs Industry Revenue Million Forecast, by Country 2019 & 2032
- Table 16: Global Anti Hypertensive Drugs Industry Volume K Unit Forecast, by Country 2019 & 2032
- Table 17: Global Anti Hypertensive Drugs Industry Revenue Million Forecast, by Therapeutic Class 2019 & 2032
- Table 18: Global Anti Hypertensive Drugs Industry Volume K Unit Forecast, by Therapeutic Class 2019 & 2032
- Table 19: Global Anti Hypertensive Drugs Industry Revenue Million Forecast, by Country 2019 & 2032
- Table 20: Global Anti Hypertensive Drugs Industry Volume K Unit Forecast, by Country 2019 & 2032
- Table 21: United States Anti Hypertensive Drugs Industry Revenue (Million) Forecast, by Application 2019 & 2032
- Table 22: United States Anti Hypertensive Drugs Industry Volume (K Unit) Forecast, by Application 2019 & 2032
- Table 23: Canada Anti Hypertensive Drugs Industry Revenue (Million) Forecast, by Application 2019 & 2032
- Table 24: Canada Anti Hypertensive Drugs Industry Volume (K Unit) Forecast, by Application 2019 & 2032
- Table 25: Mexico Anti Hypertensive Drugs Industry Revenue (Million) Forecast, by Application 2019 & 2032
- Table 26: Mexico Anti Hypertensive Drugs Industry Volume (K Unit) Forecast, by Application 2019 & 2032
- Table 27: Global Anti Hypertensive Drugs Industry Revenue Million Forecast, by Therapeutic Class 2019 & 2032
- Table 28: Global Anti Hypertensive Drugs Industry Volume K Unit Forecast, by Therapeutic Class 2019 & 2032
- Table 29: Global Anti Hypertensive Drugs Industry Revenue Million Forecast, by Country 2019 & 2032
- Table 30: Global Anti Hypertensive Drugs Industry Volume K Unit Forecast, by Country 2019 & 2032
- Table 31: Germany Anti Hypertensive Drugs Industry Revenue (Million) Forecast, by Application 2019 & 2032
- Table 32: Germany Anti Hypertensive Drugs Industry Volume (K Unit) Forecast, by Application 2019 & 2032
- Table 33: United Kingdom Anti Hypertensive Drugs Industry Revenue (Million) Forecast, by Application 2019 & 2032
- Table 34: United Kingdom Anti Hypertensive Drugs Industry Volume (K Unit) Forecast, by Application 2019 & 2032
- Table 35: France Anti Hypertensive Drugs Industry Revenue (Million) Forecast, by Application 2019 & 2032
- Table 36: France Anti Hypertensive Drugs Industry Volume (K Unit) Forecast, by Application 2019 & 2032
- Table 37: Italy Anti Hypertensive Drugs Industry Revenue (Million) Forecast, by Application 2019 & 2032
- Table 38: Italy Anti Hypertensive Drugs Industry Volume (K Unit) Forecast, by Application 2019 & 2032
- Table 39: Spain Anti Hypertensive Drugs Industry Revenue (Million) Forecast, by Application 2019 & 2032
- Table 40: Spain Anti Hypertensive Drugs Industry Volume (K Unit) Forecast, by Application 2019 & 2032
- Table 41: Rest of Europe Anti Hypertensive Drugs Industry Revenue (Million) Forecast, by Application 2019 & 2032
- Table 42: Rest of Europe Anti Hypertensive Drugs Industry Volume (K Unit) Forecast, by Application 2019 & 2032
- Table 43: Global Anti Hypertensive Drugs Industry Revenue Million Forecast, by Therapeutic Class 2019 & 2032
- Table 44: Global Anti Hypertensive Drugs Industry Volume K Unit Forecast, by Therapeutic Class 2019 & 2032
- Table 45: Global Anti Hypertensive Drugs Industry Revenue Million Forecast, by Country 2019 & 2032
- Table 46: Global Anti Hypertensive Drugs Industry Volume K Unit Forecast, by Country 2019 & 2032
- Table 47: China Anti Hypertensive Drugs Industry Revenue (Million) Forecast, by Application 2019 & 2032
- Table 48: China Anti Hypertensive Drugs Industry Volume (K Unit) Forecast, by Application 2019 & 2032
- Table 49: Japan Anti Hypertensive Drugs Industry Revenue (Million) Forecast, by Application 2019 & 2032
- Table 50: Japan Anti Hypertensive Drugs Industry Volume (K Unit) Forecast, by Application 2019 & 2032
- Table 51: India Anti Hypertensive Drugs Industry Revenue (Million) Forecast, by Application 2019 & 2032
- Table 52: India Anti Hypertensive Drugs Industry Volume (K Unit) Forecast, by Application 2019 & 2032
- Table 53: Australia Anti Hypertensive Drugs Industry Revenue (Million) Forecast, by Application 2019 & 2032
- Table 54: Australia Anti Hypertensive Drugs Industry Volume (K Unit) Forecast, by Application 2019 & 2032
- Table 55: South korea Anti Hypertensive Drugs Industry Revenue (Million) Forecast, by Application 2019 & 2032
- Table 56: South korea Anti Hypertensive Drugs Industry Volume (K Unit) Forecast, by Application 2019 & 2032
- Table 57: Rest of Asia Pacific Anti Hypertensive Drugs Industry Revenue (Million) Forecast, by Application 2019 & 2032
- Table 58: Rest of Asia Pacific Anti Hypertensive Drugs Industry Volume (K Unit) Forecast, by Application 2019 & 2032
- Table 59: Global Anti Hypertensive Drugs Industry Revenue Million Forecast, by Therapeutic Class 2019 & 2032
- Table 60: Global Anti Hypertensive Drugs Industry Volume K Unit Forecast, by Therapeutic Class 2019 & 2032
- Table 61: Global Anti Hypertensive Drugs Industry Revenue Million Forecast, by Country 2019 & 2032
- Table 62: Global Anti Hypertensive Drugs Industry Volume K Unit Forecast, by Country 2019 & 2032
- Table 63: GCC Anti Hypertensive Drugs Industry Revenue (Million) Forecast, by Application 2019 & 2032
- Table 64: GCC Anti Hypertensive Drugs Industry Volume (K Unit) Forecast, by Application 2019 & 2032
- Table 65: South Africa Anti Hypertensive Drugs Industry Revenue (Million) Forecast, by Application 2019 & 2032
- Table 66: South Africa Anti Hypertensive Drugs Industry Volume (K Unit) Forecast, by Application 2019 & 2032
- Table 67: Rest of Middle East and Africa Anti Hypertensive Drugs Industry Revenue (Million) Forecast, by Application 2019 & 2032
- Table 68: Rest of Middle East and Africa Anti Hypertensive Drugs Industry Volume (K Unit) Forecast, by Application 2019 & 2032
- Table 69: Global Anti Hypertensive Drugs Industry Revenue Million Forecast, by Therapeutic Class 2019 & 2032
- Table 70: Global Anti Hypertensive Drugs Industry Volume K Unit Forecast, by Therapeutic Class 2019 & 2032
- Table 71: Global Anti Hypertensive Drugs Industry Revenue Million Forecast, by Country 2019 & 2032
- Table 72: Global Anti Hypertensive Drugs Industry Volume K Unit Forecast, by Country 2019 & 2032
- Table 73: Brazil Anti Hypertensive Drugs Industry Revenue (Million) Forecast, by Application 2019 & 2032
- Table 74: Brazil Anti Hypertensive Drugs Industry Volume (K Unit) Forecast, by Application 2019 & 2032
- Table 75: Argentina Anti Hypertensive Drugs Industry Revenue (Million) Forecast, by Application 2019 & 2032
- Table 76: Argentina Anti Hypertensive Drugs Industry Volume (K Unit) Forecast, by Application 2019 & 2032
- Table 77: Rest of South America Anti Hypertensive Drugs Industry Revenue (Million) Forecast, by Application 2019 & 2032
- Table 78: Rest of South America Anti Hypertensive Drugs Industry Volume (K Unit) Forecast, by Application 2019 & 2032
Frequently Asked Questions
1. What is the projected Compound Annual Growth Rate (CAGR) of the Anti Hypertensive Drugs Industry?
The projected CAGR is approximately 4.50%.
2. Which companies are prominent players in the Anti Hypertensive Drugs Industry?
Key companies in the market include Sanofi SA, Daiichi Sankyo Company Limited, Merck KGaA, Novartis International AG, Ranbaxy Laboratories Limited, C H Boehringer Sohn AG & Ko KG, AstraZeneca PLC, Johnson & Johnson, Lupin Limited, Noden Pharma DAC, Pfizer Inc.
3. What are the main segments of the Anti Hypertensive Drugs Industry?
The market segments include Therapeutic Class.
4. Can you provide details about the market size?
The market size is estimated to be USD XX Million as of 2022.
5. What are some drivers contributing to market growth?
Increasing Prevalence of Hypertension; Growing Initiatives by Private and Government Organizations; Rising Awareness about Hypertension.
6. What are the notable trends driving market growth?
Diuretics Therapeutics Class is Expected to Hold a Significant Market Share in the Forecast Period.
7. Are there any restraints impacting market growth?
Multiple Major Drug Patent Expiration; Side-effects of Treatment Options and Rise in Non-pharmacological Therapy.
8. Can you provide examples of recent developments in the market?
In May 2022, Hanmi Pharmaceutical revealed that it will start marketing its blockbuster hypertension drug Amosartan under the brand name Meiyaping in China. It marked the first homegrown blood pressure combination therapy to enter the Chinese market.
9. What pricing options are available for accessing the report?
Pricing options include single-user, multi-user, and enterprise licenses priced at USD 4750, USD 5250, and USD 8750 respectively.
10. Is the market size provided in terms of value or volume?
The market size is provided in terms of value, measured in Million and volume, measured in K Unit.
11. Are there any specific market keywords associated with the report?
Yes, the market keyword associated with the report is "Anti Hypertensive Drugs Industry," which aids in identifying and referencing the specific market segment covered.
12. How do I determine which pricing option suits my needs best?
The pricing options vary based on user requirements and access needs. Individual users may opt for single-user licenses, while businesses requiring broader access may choose multi-user or enterprise licenses for cost-effective access to the report.
13. Are there any additional resources or data provided in the Anti Hypertensive Drugs Industry report?
While the report offers comprehensive insights, it's advisable to review the specific contents or supplementary materials provided to ascertain if additional resources or data are available.
14. How can I stay updated on further developments or reports in the Anti Hypertensive Drugs Industry?
To stay informed about further developments, trends, and reports in the Anti Hypertensive Drugs Industry, consider subscribing to industry newsletters, following relevant companies and organizations, or regularly checking reputable industry news sources and publications.
Methodology
Step 1 - Identification of Relevant Samples Size from Population Database


Step 2 - Approaches for Defining Global Market Size (Value, Volume* & Price*)

Note*: In applicable scenarios
Step 3 - Data Sources
Primary Research
- Web Analytics
- Survey Reports
- Research Institute
- Latest Research Reports
- Opinion Leaders
Secondary Research
- Annual Reports
- White Paper
- Latest Press Release
- Industry Association
- Paid Database
- Investor Presentations

Step 4 - Data Triangulation
Involves using different sources of information in order to increase the validity of a study
These sources are likely to be stakeholders in a program - participants, other researchers, program staff, other community members, and so on.
Then we put all data in single framework & apply various statistical tools to find out the dynamic on the market.
During the analysis stage, feedback from the stakeholder groups would be compared to determine areas of agreement as well as areas of divergence


