
Key Insights
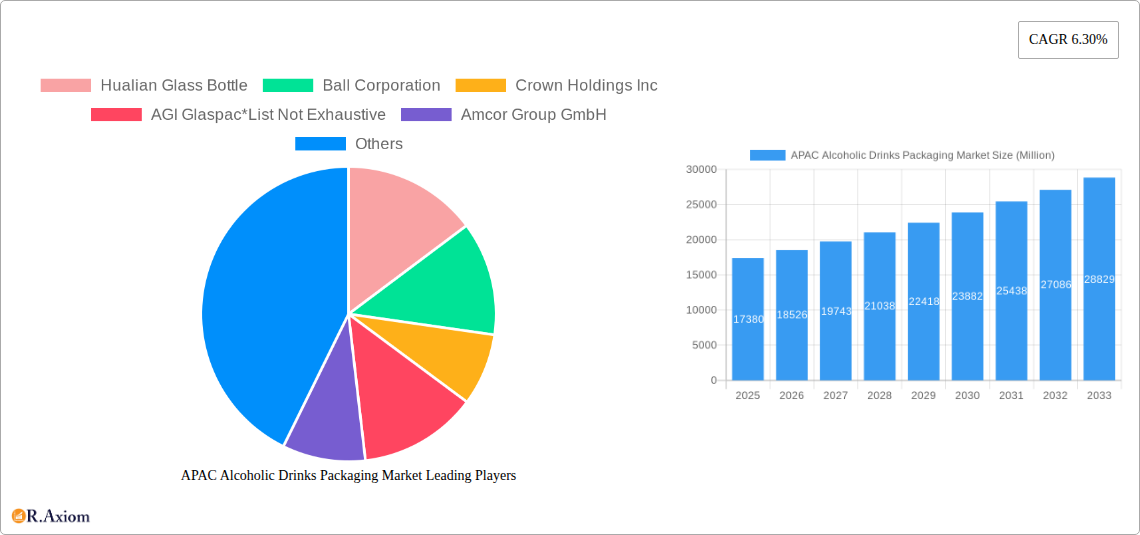
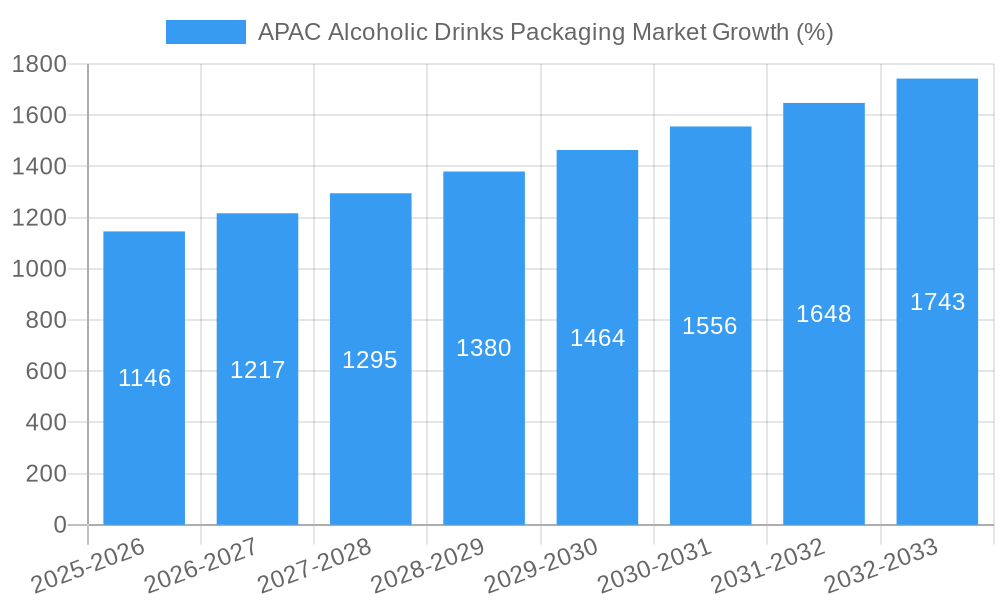
The Asia-Pacific (APAC) alcoholic drinks packaging market, valued at $17.38 billion in 2025, is projected to experience robust growth, driven by increasing alcoholic beverage consumption, particularly in rapidly developing economies like China and India. A compound annual growth rate (CAGR) of 6.30% from 2025 to 2033 indicates a significant expansion of this market. This growth is fueled by several factors: the rising disposable incomes and changing lifestyles leading to increased demand for premium alcoholic beverages, a surge in the popularity of craft beers and spirits, and the continuous innovation in packaging materials and designs to enhance product appeal and shelf life. The preference for sustainable and eco-friendly packaging is also gaining traction, pushing manufacturers to adopt materials like recycled paper and biodegradable plastics. While the market faces restraints like fluctuating raw material prices and stringent regulatory compliance, the overall growth trajectory remains positive. Segment-wise, the plastic and glass material segments are expected to dominate, given their suitability for various alcoholic beverage types. Bottles remain the leading product type, though pouches and cartons are witnessing increasing adoption due to their convenience and cost-effectiveness. Within the APAC region, China and India are key growth drivers, followed by Japan, Australia, and Singapore, contributing significantly to the market's overall expansion. Leading players like Hualian Glass Bottle, Ball Corporation, and Amcor Group are leveraging technological advancements and strategic partnerships to maintain a competitive edge in this dynamic market.
The forecast period of 2025-2033 presents substantial opportunities for market players to capitalize on the rising demand for innovative and sustainable packaging solutions. The increasing preference for convenient and on-the-go consumption patterns is driving the demand for lightweight and portable packaging formats. Further, the premiumization trend in the alcoholic beverages sector is influencing the adoption of premium packaging materials and designs. Companies are investing in advanced technologies such as smart packaging and tamper-evident seals to enhance product security and consumer trust. Successfully navigating the challenges of supply chain disruptions and raw material price volatility will be crucial for achieving sustained growth within this dynamic and evolving market landscape.
APAC Alcoholic Drinks Packaging Market: A Comprehensive Report (2019-2033)
This in-depth report provides a comprehensive analysis of the Asia-Pacific (APAC) alcoholic drinks packaging market, covering the period from 2019 to 2033. It offers invaluable insights for industry stakeholders, including manufacturers, suppliers, distributors, and investors, enabling informed strategic decision-making. The report leverages rigorous research methodologies and incorporates data from various credible sources to deliver an accurate and insightful overview of the market dynamics.
APAC Alcoholic Drinks Packaging Market Concentration & Innovation
The APAC alcoholic drinks packaging market exhibits a moderately concentrated landscape, with key players such as Hualian Glass Bottle, Ball Corporation, Crown Holdings Inc, AGI Glaspac, Amcor Group GmbH, Mondi Group, and Gerresheimer AG holding significant market share. However, the presence of numerous smaller players also contributes to competitive intensity. Market share estimations for 2025 suggest that the top five players collectively account for approximately xx% of the market. Innovation is driven by the demand for sustainable packaging solutions, lightweighting initiatives to reduce transportation costs, and advancements in barrier technologies to enhance product shelf life. Regulatory frameworks, particularly concerning recyclability and material composition, significantly influence market trends. The increasing consumer preference for eco-friendly options is fostering innovation in biodegradable and compostable packaging materials. Moreover, M&A activities are prevalent, with several deals valued at over $xx Million in recent years aimed at expanding product portfolios and geographical reach. For instance, the merger between [Insert example if available, otherwise remove sentence] resulted in a significant increase in market share for the combined entity.
APAC Alcoholic Drinks Packaging Market Industry Trends & Insights
The APAC alcoholic drinks packaging market is experiencing robust growth, fueled by rising disposable incomes, changing consumer preferences, and the increasing popularity of alcoholic beverages across the region. The market's Compound Annual Growth Rate (CAGR) during the forecast period (2025-2033) is estimated to be xx%, driven by several factors. Technological advancements, such as the adoption of lightweighting techniques and improved printing technologies, are enhancing product appeal and efficiency. Consumer preferences are shifting towards premiumization and innovative packaging designs, driving demand for customized and aesthetically pleasing packaging solutions. Furthermore, the burgeoning e-commerce sector and the associated demand for tamper-evident and secure packaging are boosting market growth. Competitive dynamics are characterized by intense rivalry among established players and the emergence of new entrants offering innovative solutions. Market penetration of sustainable packaging materials is increasing, with xx% of the market expected to be comprised of eco-friendly options by 2033.
Dominant Markets & Segments in APAC Alcoholic Drinks Packaging Market
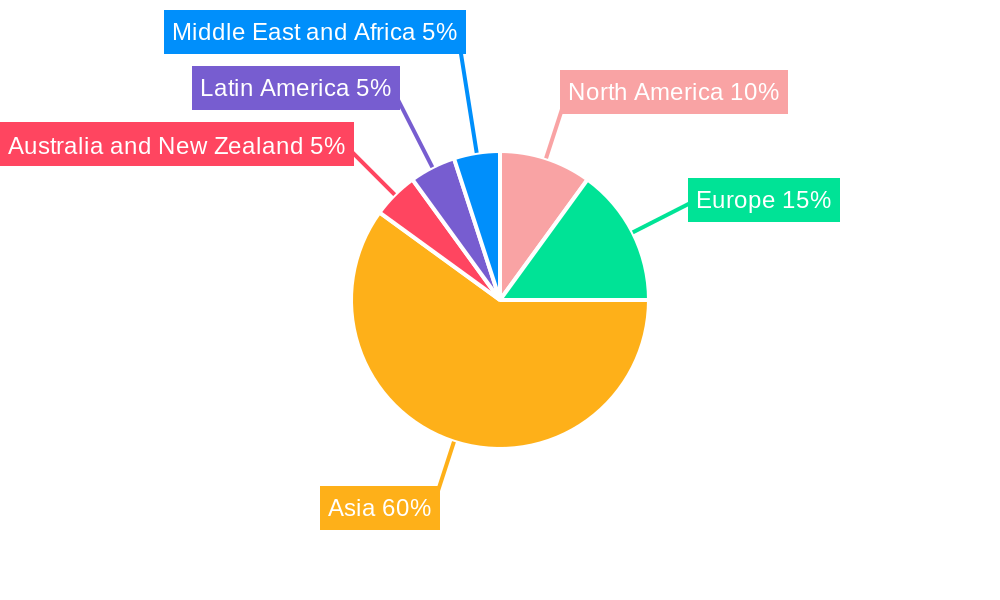
China remains the dominant market in the APAC alcoholic drinks packaging sector, contributing significantly to the overall market size due to its large population and expanding alcoholic beverage industry. India demonstrates substantial growth potential owing to its burgeoning middle class and increasing alcohol consumption.
- By Material: Glass continues to dominate, followed by plastic, owing to its inherent properties for preserving the quality and integrity of alcoholic beverages. However, the market share of sustainable alternatives like paper and metal is gradually increasing.
- By Product Type: Bottles remain the most preferred packaging format, followed by cans, particularly for beers and ready-to-drink beverages. Pouches and cartons are gaining popularity for their cost-effectiveness and portability.
- By Country:
- China: High production capacity, robust domestic demand, and significant investments in manufacturing infrastructure.
- India: Rapid economic growth, rising disposable incomes, and a growing preference for packaged alcoholic beverages.
- Japan: Established market with mature consumer preferences, but opportunities exist for premium and innovative packaging solutions.
- Singapore, Australia, and New Zealand: Relatively smaller markets, but exhibiting steady growth and high demand for premium and specialized packaging.
APAC Alcoholic Drinks Packaging Market Product Developments
Recent product innovations focus on enhancing sustainability, improving barrier properties, and incorporating innovative designs. Lightweighting technologies are being adopted to reduce transportation costs and environmental impact. Advances in printing techniques allow for high-quality graphics and personalized packaging. The market is witnessing a growing adoption of recyclable and compostable materials, meeting the increasing consumer demand for eco-friendly options. These developments offer significant competitive advantages to companies that invest in research and development and adapt to evolving consumer preferences.
Report Scope & Segmentation Analysis
This report segments the APAC alcoholic drinks packaging market by material (plastic, paper, metal, glass), product type (bottles, cans, pouches, cartons), and country (China, India, Japan, Singapore, Australia, and New Zealand). Each segment is analyzed in terms of market size, growth projections, and competitive dynamics. The report also provides a detailed analysis of each segment’s current and future trends, identifying key growth drivers and challenges. For example, the glass segment is expected to maintain a significant market share, while the plastic segment faces increasing pressure to adopt more sustainable solutions.
Key Drivers of APAP Alcoholic Drinks Packaging Market Growth
Several factors contribute to the growth of the APAC alcoholic drinks packaging market. These include the rising demand for alcoholic beverages, fueled by increasing disposable incomes and changing lifestyles. Technological advancements in packaging materials and manufacturing processes enhance product shelf life and appeal. Government regulations promoting sustainable packaging solutions are driving innovation in eco-friendly alternatives. Lastly, the rise of e-commerce is boosting demand for secure and tamper-evident packaging solutions.
Challenges in the APAC Alcoholic Drinks Packaging Market Sector
The APAC alcoholic drinks packaging market faces several challenges. Fluctuating raw material prices impact production costs, affecting profitability. Stricter environmental regulations necessitate investment in sustainable packaging solutions. Intense competition from established players and emerging entrants exerts pressure on pricing and margins. Supply chain disruptions and logistical challenges can impact production and delivery timelines. These factors require manufacturers to adapt and optimize their operations to maintain competitiveness.
Emerging Opportunities in APAC Alcoholic Drinks Packaging Market
Significant growth opportunities exist in the APAC alcoholic drinks packaging market. The rising demand for premium and specialized packaging, particularly in the craft beer and spirits segments, offers considerable potential. The growing adoption of sustainable packaging materials presents opportunities for companies offering eco-friendly solutions. The increasing use of smart packaging technologies allows for enhanced brand interaction and consumer engagement, providing another avenue for growth. Expanding into untapped markets within the region offers further expansion possibilities.
Leading Players in the APAC Alcoholic Drinks Packaging Market Market
- Hualian Glass Bottle
- Ball Corporation
- Crown Holdings Inc
- AGI Glaspac
- Amcor Group GmbH
- Mondi Group
- Gerresheimer AG
Key Developments in APAC Alcoholic Drinks Packaging Market Industry
- January 2023: Amcor launched a new range of sustainable packaging solutions for alcoholic beverages.
- March 2022: Ball Corporation announced a significant investment in a new production facility in China.
- June 2021: Crown Holdings Inc acquired a smaller packaging company, expanding its market reach.
- [Add further developments with specific dates and details as available]
Strategic Outlook for APAC Alcoholic Drinks Packaging Market Market
The APAC alcoholic drinks packaging market holds substantial growth potential over the forecast period. Continued growth in alcoholic beverage consumption, coupled with technological advancements and a focus on sustainable packaging, will drive market expansion. Companies that invest in innovation, sustainability, and strategic partnerships are well-positioned to capitalize on emerging opportunities. The focus on eco-friendly materials and efficient supply chains will be critical for long-term success.
APAC Alcoholic Drinks Packaging Market Segmentation
-
1. Material
- 1.1. Plastic
- 1.2. Paper
- 1.3. Metal
- 1.4. Glass
-
2. Product Type
- 2.1. Bottles
- 2.2. Cans
- 2.3. Pouches
- 2.4. Carton
APAC Alcoholic Drinks Packaging Market Segmentation By Geography
-
1. North America
- 1.1. United States
- 1.2. Canada
- 1.3. Mexico
-
2. South America
- 2.1. Brazil
- 2.2. Argentina
- 2.3. Rest of South America
-
3. Europe
- 3.1. United Kingdom
- 3.2. Germany
- 3.3. France
- 3.4. Italy
- 3.5. Spain
- 3.6. Russia
- 3.7. Benelux
- 3.8. Nordics
- 3.9. Rest of Europe
-
4. Middle East & Africa
- 4.1. Turkey
- 4.2. Israel
- 4.3. GCC
- 4.4. North Africa
- 4.5. South Africa
- 4.6. Rest of Middle East & Africa
-
5. Asia Pacific
- 5.1. China
- 5.2. India
- 5.3. Japan
- 5.4. South Korea
- 5.5. ASEAN
- 5.6. Oceania
- 5.7. Rest of Asia Pacific
APAC Alcoholic Drinks Packaging Market REPORT HIGHLIGHTS
| Aspects | Details |
|---|---|
| Study Period | 2019-2033 |
| Base Year | 2024 |
| Estimated Year | 2025 |
| Forecast Period | 2025-2033 |
| Historical Period | 2019-2024 |
| Growth Rate | CAGR of 6.30% from 2019-2033 |
| Segmentation |
|
Table of Contents
- 1. Introduction
- 1.1. Research Scope
- 1.2. Market Segmentation
- 1.3. Research Methodology
- 1.4. Definitions and Assumptions
- 2. Executive Summary
- 2.1. Introduction
- 3. Market Dynamics
- 3.1. Introduction
- 3.2. Market Drivers
- 3.2.1. Increasing Demand for Sustainable Packaging; Increasing Consumption of Alcoholic Drinks in Asia
- 3.3. Market Restrains
- 3.3.1. Government Regulation for Plastic Usage
- 3.4. Market Trends
- 3.4.1. Significant Growth in Metal Packaging to Boost the Market
- 4. Market Factor Analysis
- 4.1. Porters Five Forces
- 4.2. Supply/Value Chain
- 4.3. PESTEL analysis
- 4.4. Market Entropy
- 4.5. Patent/Trademark Analysis
- 5. Global APAC Alcoholic Drinks Packaging Market Analysis, Insights and Forecast, 2019-2031
- 5.1. Market Analysis, Insights and Forecast - by Material
- 5.1.1. Plastic
- 5.1.2. Paper
- 5.1.3. Metal
- 5.1.4. Glass
- 5.2. Market Analysis, Insights and Forecast - by Product Type
- 5.2.1. Bottles
- 5.2.2. Cans
- 5.2.3. Pouches
- 5.2.4. Carton
- 5.3. Market Analysis, Insights and Forecast - by Region
- 5.3.1. North America
- 5.3.2. South America
- 5.3.3. Europe
- 5.3.4. Middle East & Africa
- 5.3.5. Asia Pacific
- 5.1. Market Analysis, Insights and Forecast - by Material
- 6. North America APAC Alcoholic Drinks Packaging Market Analysis, Insights and Forecast, 2019-2031
- 6.1. Market Analysis, Insights and Forecast - by Material
- 6.1.1. Plastic
- 6.1.2. Paper
- 6.1.3. Metal
- 6.1.4. Glass
- 6.2. Market Analysis, Insights and Forecast - by Product Type
- 6.2.1. Bottles
- 6.2.2. Cans
- 6.2.3. Pouches
- 6.2.4. Carton
- 6.1. Market Analysis, Insights and Forecast - by Material
- 7. South America APAC Alcoholic Drinks Packaging Market Analysis, Insights and Forecast, 2019-2031
- 7.1. Market Analysis, Insights and Forecast - by Material
- 7.1.1. Plastic
- 7.1.2. Paper
- 7.1.3. Metal
- 7.1.4. Glass
- 7.2. Market Analysis, Insights and Forecast - by Product Type
- 7.2.1. Bottles
- 7.2.2. Cans
- 7.2.3. Pouches
- 7.2.4. Carton
- 7.1. Market Analysis, Insights and Forecast - by Material
- 8. Europe APAC Alcoholic Drinks Packaging Market Analysis, Insights and Forecast, 2019-2031
- 8.1. Market Analysis, Insights and Forecast - by Material
- 8.1.1. Plastic
- 8.1.2. Paper
- 8.1.3. Metal
- 8.1.4. Glass
- 8.2. Market Analysis, Insights and Forecast - by Product Type
- 8.2.1. Bottles
- 8.2.2. Cans
- 8.2.3. Pouches
- 8.2.4. Carton
- 8.1. Market Analysis, Insights and Forecast - by Material
- 9. Middle East & Africa APAC Alcoholic Drinks Packaging Market Analysis, Insights and Forecast, 2019-2031
- 9.1. Market Analysis, Insights and Forecast - by Material
- 9.1.1. Plastic
- 9.1.2. Paper
- 9.1.3. Metal
- 9.1.4. Glass
- 9.2. Market Analysis, Insights and Forecast - by Product Type
- 9.2.1. Bottles
- 9.2.2. Cans
- 9.2.3. Pouches
- 9.2.4. Carton
- 9.1. Market Analysis, Insights and Forecast - by Material
- 10. Asia Pacific APAC Alcoholic Drinks Packaging Market Analysis, Insights and Forecast, 2019-2031
- 10.1. Market Analysis, Insights and Forecast - by Material
- 10.1.1. Plastic
- 10.1.2. Paper
- 10.1.3. Metal
- 10.1.4. Glass
- 10.2. Market Analysis, Insights and Forecast - by Product Type
- 10.2.1. Bottles
- 10.2.2. Cans
- 10.2.3. Pouches
- 10.2.4. Carton
- 10.1. Market Analysis, Insights and Forecast - by Material
- 11. North America APAC Alcoholic Drinks Packaging Market Analysis, Insights and Forecast, 2019-2031
- 11.1. Market Analysis, Insights and Forecast - By Country/Sub-region
- 11.1.1.
- 12. Europe APAC Alcoholic Drinks Packaging Market Analysis, Insights and Forecast, 2019-2031
- 12.1. Market Analysis, Insights and Forecast - By Country/Sub-region
- 12.1.1.
- 13. Asia APAC Alcoholic Drinks Packaging Market Analysis, Insights and Forecast, 2019-2031
- 13.1. Market Analysis, Insights and Forecast - By Country/Sub-region
- 13.1.1.
- 14. Australia and New Zealand APAC Alcoholic Drinks Packaging Market Analysis, Insights and Forecast, 2019-2031
- 14.1. Market Analysis, Insights and Forecast - By Country/Sub-region
- 14.1.1.
- 15. Latin America APAC Alcoholic Drinks Packaging Market Analysis, Insights and Forecast, 2019-2031
- 15.1. Market Analysis, Insights and Forecast - By Country/Sub-region
- 15.1.1.
- 16. Middle East and Africa APAC Alcoholic Drinks Packaging Market Analysis, Insights and Forecast, 2019-2031
- 16.1. Market Analysis, Insights and Forecast - By Country/Sub-region
- 16.1.1.
- 17. Competitive Analysis
- 17.1. Global Market Share Analysis 2024
- 17.2. Company Profiles
- 17.2.1 Hualian Glass Bottle
- 17.2.1.1. Overview
- 17.2.1.2. Products
- 17.2.1.3. SWOT Analysis
- 17.2.1.4. Recent Developments
- 17.2.1.5. Financials (Based on Availability)
- 17.2.2 Ball Corporation
- 17.2.2.1. Overview
- 17.2.2.2. Products
- 17.2.2.3. SWOT Analysis
- 17.2.2.4. Recent Developments
- 17.2.2.5. Financials (Based on Availability)
- 17.2.3 Crown Holdings Inc
- 17.2.3.1. Overview
- 17.2.3.2. Products
- 17.2.3.3. SWOT Analysis
- 17.2.3.4. Recent Developments
- 17.2.3.5. Financials (Based on Availability)
- 17.2.4 AGI Glaspac*List Not Exhaustive
- 17.2.4.1. Overview
- 17.2.4.2. Products
- 17.2.4.3. SWOT Analysis
- 17.2.4.4. Recent Developments
- 17.2.4.5. Financials (Based on Availability)
- 17.2.5 Amcor Group GmbH
- 17.2.5.1. Overview
- 17.2.5.2. Products
- 17.2.5.3. SWOT Analysis
- 17.2.5.4. Recent Developments
- 17.2.5.5. Financials (Based on Availability)
- 17.2.6 Mondi Group
- 17.2.6.1. Overview
- 17.2.6.2. Products
- 17.2.6.3. SWOT Analysis
- 17.2.6.4. Recent Developments
- 17.2.6.5. Financials (Based on Availability)
- 17.2.7 Gerresheimer AG
- 17.2.7.1. Overview
- 17.2.7.2. Products
- 17.2.7.3. SWOT Analysis
- 17.2.7.4. Recent Developments
- 17.2.7.5. Financials (Based on Availability)
- 17.2.1 Hualian Glass Bottle
List of Figures
- Figure 1: Global APAC Alcoholic Drinks Packaging Market Revenue Breakdown (Million, %) by Region 2024 & 2032
- Figure 2: North America APAC Alcoholic Drinks Packaging Market Revenue (Million), by Country 2024 & 2032
- Figure 3: North America APAC Alcoholic Drinks Packaging Market Revenue Share (%), by Country 2024 & 2032
- Figure 4: Europe APAC Alcoholic Drinks Packaging Market Revenue (Million), by Country 2024 & 2032
- Figure 5: Europe APAC Alcoholic Drinks Packaging Market Revenue Share (%), by Country 2024 & 2032
- Figure 6: Asia APAC Alcoholic Drinks Packaging Market Revenue (Million), by Country 2024 & 2032
- Figure 7: Asia APAC Alcoholic Drinks Packaging Market Revenue Share (%), by Country 2024 & 2032
- Figure 8: Australia and New Zealand APAC Alcoholic Drinks Packaging Market Revenue (Million), by Country 2024 & 2032
- Figure 9: Australia and New Zealand APAC Alcoholic Drinks Packaging Market Revenue Share (%), by Country 2024 & 2032
- Figure 10: Latin America APAC Alcoholic Drinks Packaging Market Revenue (Million), by Country 2024 & 2032
- Figure 11: Latin America APAC Alcoholic Drinks Packaging Market Revenue Share (%), by Country 2024 & 2032
- Figure 12: Middle East and Africa APAC Alcoholic Drinks Packaging Market Revenue (Million), by Country 2024 & 2032
- Figure 13: Middle East and Africa APAC Alcoholic Drinks Packaging Market Revenue Share (%), by Country 2024 & 2032
- Figure 14: North America APAC Alcoholic Drinks Packaging Market Revenue (Million), by Material 2024 & 2032
- Figure 15: North America APAC Alcoholic Drinks Packaging Market Revenue Share (%), by Material 2024 & 2032
- Figure 16: North America APAC Alcoholic Drinks Packaging Market Revenue (Million), by Product Type 2024 & 2032
- Figure 17: North America APAC Alcoholic Drinks Packaging Market Revenue Share (%), by Product Type 2024 & 2032
- Figure 18: North America APAC Alcoholic Drinks Packaging Market Revenue (Million), by Country 2024 & 2032
- Figure 19: North America APAC Alcoholic Drinks Packaging Market Revenue Share (%), by Country 2024 & 2032
- Figure 20: South America APAC Alcoholic Drinks Packaging Market Revenue (Million), by Material 2024 & 2032
- Figure 21: South America APAC Alcoholic Drinks Packaging Market Revenue Share (%), by Material 2024 & 2032
- Figure 22: South America APAC Alcoholic Drinks Packaging Market Revenue (Million), by Product Type 2024 & 2032
- Figure 23: South America APAC Alcoholic Drinks Packaging Market Revenue Share (%), by Product Type 2024 & 2032
- Figure 24: South America APAC Alcoholic Drinks Packaging Market Revenue (Million), by Country 2024 & 2032
- Figure 25: South America APAC Alcoholic Drinks Packaging Market Revenue Share (%), by Country 2024 & 2032
- Figure 26: Europe APAC Alcoholic Drinks Packaging Market Revenue (Million), by Material 2024 & 2032
- Figure 27: Europe APAC Alcoholic Drinks Packaging Market Revenue Share (%), by Material 2024 & 2032
- Figure 28: Europe APAC Alcoholic Drinks Packaging Market Revenue (Million), by Product Type 2024 & 2032
- Figure 29: Europe APAC Alcoholic Drinks Packaging Market Revenue Share (%), by Product Type 2024 & 2032
- Figure 30: Europe APAC Alcoholic Drinks Packaging Market Revenue (Million), by Country 2024 & 2032
- Figure 31: Europe APAC Alcoholic Drinks Packaging Market Revenue Share (%), by Country 2024 & 2032
- Figure 32: Middle East & Africa APAC Alcoholic Drinks Packaging Market Revenue (Million), by Material 2024 & 2032
- Figure 33: Middle East & Africa APAC Alcoholic Drinks Packaging Market Revenue Share (%), by Material 2024 & 2032
- Figure 34: Middle East & Africa APAC Alcoholic Drinks Packaging Market Revenue (Million), by Product Type 2024 & 2032
- Figure 35: Middle East & Africa APAC Alcoholic Drinks Packaging Market Revenue Share (%), by Product Type 2024 & 2032
- Figure 36: Middle East & Africa APAC Alcoholic Drinks Packaging Market Revenue (Million), by Country 2024 & 2032
- Figure 37: Middle East & Africa APAC Alcoholic Drinks Packaging Market Revenue Share (%), by Country 2024 & 2032
- Figure 38: Asia Pacific APAC Alcoholic Drinks Packaging Market Revenue (Million), by Material 2024 & 2032
- Figure 39: Asia Pacific APAC Alcoholic Drinks Packaging Market Revenue Share (%), by Material 2024 & 2032
- Figure 40: Asia Pacific APAC Alcoholic Drinks Packaging Market Revenue (Million), by Product Type 2024 & 2032
- Figure 41: Asia Pacific APAC Alcoholic Drinks Packaging Market Revenue Share (%), by Product Type 2024 & 2032
- Figure 42: Asia Pacific APAC Alcoholic Drinks Packaging Market Revenue (Million), by Country 2024 & 2032
- Figure 43: Asia Pacific APAC Alcoholic Drinks Packaging Market Revenue Share (%), by Country 2024 & 2032
List of Tables
- Table 1: Global APAC Alcoholic Drinks Packaging Market Revenue Million Forecast, by Region 2019 & 2032
- Table 2: Global APAC Alcoholic Drinks Packaging Market Revenue Million Forecast, by Material 2019 & 2032
- Table 3: Global APAC Alcoholic Drinks Packaging Market Revenue Million Forecast, by Product Type 2019 & 2032
- Table 4: Global APAC Alcoholic Drinks Packaging Market Revenue Million Forecast, by Region 2019 & 2032
- Table 5: Global APAC Alcoholic Drinks Packaging Market Revenue Million Forecast, by Country 2019 & 2032
- Table 6: APAC Alcoholic Drinks Packaging Market Revenue (Million) Forecast, by Application 2019 & 2032
- Table 7: Global APAC Alcoholic Drinks Packaging Market Revenue Million Forecast, by Country 2019 & 2032
- Table 8: APAC Alcoholic Drinks Packaging Market Revenue (Million) Forecast, by Application 2019 & 2032
- Table 9: Global APAC Alcoholic Drinks Packaging Market Revenue Million Forecast, by Country 2019 & 2032
- Table 10: APAC Alcoholic Drinks Packaging Market Revenue (Million) Forecast, by Application 2019 & 2032
- Table 11: Global APAC Alcoholic Drinks Packaging Market Revenue Million Forecast, by Country 2019 & 2032
- Table 12: APAC Alcoholic Drinks Packaging Market Revenue (Million) Forecast, by Application 2019 & 2032
- Table 13: Global APAC Alcoholic Drinks Packaging Market Revenue Million Forecast, by Country 2019 & 2032
- Table 14: APAC Alcoholic Drinks Packaging Market Revenue (Million) Forecast, by Application 2019 & 2032
- Table 15: Global APAC Alcoholic Drinks Packaging Market Revenue Million Forecast, by Country 2019 & 2032
- Table 16: APAC Alcoholic Drinks Packaging Market Revenue (Million) Forecast, by Application 2019 & 2032
- Table 17: Global APAC Alcoholic Drinks Packaging Market Revenue Million Forecast, by Material 2019 & 2032
- Table 18: Global APAC Alcoholic Drinks Packaging Market Revenue Million Forecast, by Product Type 2019 & 2032
- Table 19: Global APAC Alcoholic Drinks Packaging Market Revenue Million Forecast, by Country 2019 & 2032
- Table 20: United States APAC Alcoholic Drinks Packaging Market Revenue (Million) Forecast, by Application 2019 & 2032
- Table 21: Canada APAC Alcoholic Drinks Packaging Market Revenue (Million) Forecast, by Application 2019 & 2032
- Table 22: Mexico APAC Alcoholic Drinks Packaging Market Revenue (Million) Forecast, by Application 2019 & 2032
- Table 23: Global APAC Alcoholic Drinks Packaging Market Revenue Million Forecast, by Material 2019 & 2032
- Table 24: Global APAC Alcoholic Drinks Packaging Market Revenue Million Forecast, by Product Type 2019 & 2032
- Table 25: Global APAC Alcoholic Drinks Packaging Market Revenue Million Forecast, by Country 2019 & 2032
- Table 26: Brazil APAC Alcoholic Drinks Packaging Market Revenue (Million) Forecast, by Application 2019 & 2032
- Table 27: Argentina APAC Alcoholic Drinks Packaging Market Revenue (Million) Forecast, by Application 2019 & 2032
- Table 28: Rest of South America APAC Alcoholic Drinks Packaging Market Revenue (Million) Forecast, by Application 2019 & 2032
- Table 29: Global APAC Alcoholic Drinks Packaging Market Revenue Million Forecast, by Material 2019 & 2032
- Table 30: Global APAC Alcoholic Drinks Packaging Market Revenue Million Forecast, by Product Type 2019 & 2032
- Table 31: Global APAC Alcoholic Drinks Packaging Market Revenue Million Forecast, by Country 2019 & 2032
- Table 32: United Kingdom APAC Alcoholic Drinks Packaging Market Revenue (Million) Forecast, by Application 2019 & 2032
- Table 33: Germany APAC Alcoholic Drinks Packaging Market Revenue (Million) Forecast, by Application 2019 & 2032
- Table 34: France APAC Alcoholic Drinks Packaging Market Revenue (Million) Forecast, by Application 2019 & 2032
- Table 35: Italy APAC Alcoholic Drinks Packaging Market Revenue (Million) Forecast, by Application 2019 & 2032
- Table 36: Spain APAC Alcoholic Drinks Packaging Market Revenue (Million) Forecast, by Application 2019 & 2032
- Table 37: Russia APAC Alcoholic Drinks Packaging Market Revenue (Million) Forecast, by Application 2019 & 2032
- Table 38: Benelux APAC Alcoholic Drinks Packaging Market Revenue (Million) Forecast, by Application 2019 & 2032
- Table 39: Nordics APAC Alcoholic Drinks Packaging Market Revenue (Million) Forecast, by Application 2019 & 2032
- Table 40: Rest of Europe APAC Alcoholic Drinks Packaging Market Revenue (Million) Forecast, by Application 2019 & 2032
- Table 41: Global APAC Alcoholic Drinks Packaging Market Revenue Million Forecast, by Material 2019 & 2032
- Table 42: Global APAC Alcoholic Drinks Packaging Market Revenue Million Forecast, by Product Type 2019 & 2032
- Table 43: Global APAC Alcoholic Drinks Packaging Market Revenue Million Forecast, by Country 2019 & 2032
- Table 44: Turkey APAC Alcoholic Drinks Packaging Market Revenue (Million) Forecast, by Application 2019 & 2032
- Table 45: Israel APAC Alcoholic Drinks Packaging Market Revenue (Million) Forecast, by Application 2019 & 2032
- Table 46: GCC APAC Alcoholic Drinks Packaging Market Revenue (Million) Forecast, by Application 2019 & 2032
- Table 47: North Africa APAC Alcoholic Drinks Packaging Market Revenue (Million) Forecast, by Application 2019 & 2032
- Table 48: South Africa APAC Alcoholic Drinks Packaging Market Revenue (Million) Forecast, by Application 2019 & 2032
- Table 49: Rest of Middle East & Africa APAC Alcoholic Drinks Packaging Market Revenue (Million) Forecast, by Application 2019 & 2032
- Table 50: Global APAC Alcoholic Drinks Packaging Market Revenue Million Forecast, by Material 2019 & 2032
- Table 51: Global APAC Alcoholic Drinks Packaging Market Revenue Million Forecast, by Product Type 2019 & 2032
- Table 52: Global APAC Alcoholic Drinks Packaging Market Revenue Million Forecast, by Country 2019 & 2032
- Table 53: China APAC Alcoholic Drinks Packaging Market Revenue (Million) Forecast, by Application 2019 & 2032
- Table 54: India APAC Alcoholic Drinks Packaging Market Revenue (Million) Forecast, by Application 2019 & 2032
- Table 55: Japan APAC Alcoholic Drinks Packaging Market Revenue (Million) Forecast, by Application 2019 & 2032
- Table 56: South Korea APAC Alcoholic Drinks Packaging Market Revenue (Million) Forecast, by Application 2019 & 2032
- Table 57: ASEAN APAC Alcoholic Drinks Packaging Market Revenue (Million) Forecast, by Application 2019 & 2032
- Table 58: Oceania APAC Alcoholic Drinks Packaging Market Revenue (Million) Forecast, by Application 2019 & 2032
- Table 59: Rest of Asia Pacific APAC Alcoholic Drinks Packaging Market Revenue (Million) Forecast, by Application 2019 & 2032
Frequently Asked Questions
1. What is the projected Compound Annual Growth Rate (CAGR) of the APAC Alcoholic Drinks Packaging Market?
The projected CAGR is approximately 6.30%.
2. Which companies are prominent players in the APAC Alcoholic Drinks Packaging Market?
Key companies in the market include Hualian Glass Bottle, Ball Corporation, Crown Holdings Inc, AGI Glaspac*List Not Exhaustive, Amcor Group GmbH, Mondi Group, Gerresheimer AG.
3. What are the main segments of the APAC Alcoholic Drinks Packaging Market?
The market segments include Material, Product Type.
4. Can you provide details about the market size?
The market size is estimated to be USD 17.38 Million as of 2022.
5. What are some drivers contributing to market growth?
Increasing Demand for Sustainable Packaging; Increasing Consumption of Alcoholic Drinks in Asia.
6. What are the notable trends driving market growth?
Significant Growth in Metal Packaging to Boost the Market.
7. Are there any restraints impacting market growth?
Government Regulation for Plastic Usage.
8. Can you provide examples of recent developments in the market?
N/A
9. What pricing options are available for accessing the report?
Pricing options include single-user, multi-user, and enterprise licenses priced at USD 4750, USD 4950, and USD 6800 respectively.
10. Is the market size provided in terms of value or volume?
The market size is provided in terms of value, measured in Million.
11. Are there any specific market keywords associated with the report?
Yes, the market keyword associated with the report is "APAC Alcoholic Drinks Packaging Market," which aids in identifying and referencing the specific market segment covered.
12. How do I determine which pricing option suits my needs best?
The pricing options vary based on user requirements and access needs. Individual users may opt for single-user licenses, while businesses requiring broader access may choose multi-user or enterprise licenses for cost-effective access to the report.
13. Are there any additional resources or data provided in the APAC Alcoholic Drinks Packaging Market report?
While the report offers comprehensive insights, it's advisable to review the specific contents or supplementary materials provided to ascertain if additional resources or data are available.
14. How can I stay updated on further developments or reports in the APAC Alcoholic Drinks Packaging Market?
To stay informed about further developments, trends, and reports in the APAC Alcoholic Drinks Packaging Market, consider subscribing to industry newsletters, following relevant companies and organizations, or regularly checking reputable industry news sources and publications.
Methodology
Step 1 - Identification of Relevant Samples Size from Population Database


Step 2 - Approaches for Defining Global Market Size (Value, Volume* & Price*)

Note*: In applicable scenarios
Step 3 - Data Sources
Primary Research
- Web Analytics
- Survey Reports
- Research Institute
- Latest Research Reports
- Opinion Leaders
Secondary Research
- Annual Reports
- White Paper
- Latest Press Release
- Industry Association
- Paid Database
- Investor Presentations

Step 4 - Data Triangulation
Involves using different sources of information in order to increase the validity of a study
These sources are likely to be stakeholders in a program - participants, other researchers, program staff, other community members, and so on.
Then we put all data in single framework & apply various statistical tools to find out the dynamic on the market.
During the analysis stage, feedback from the stakeholder groups would be compared to determine areas of agreement as well as areas of divergence


