
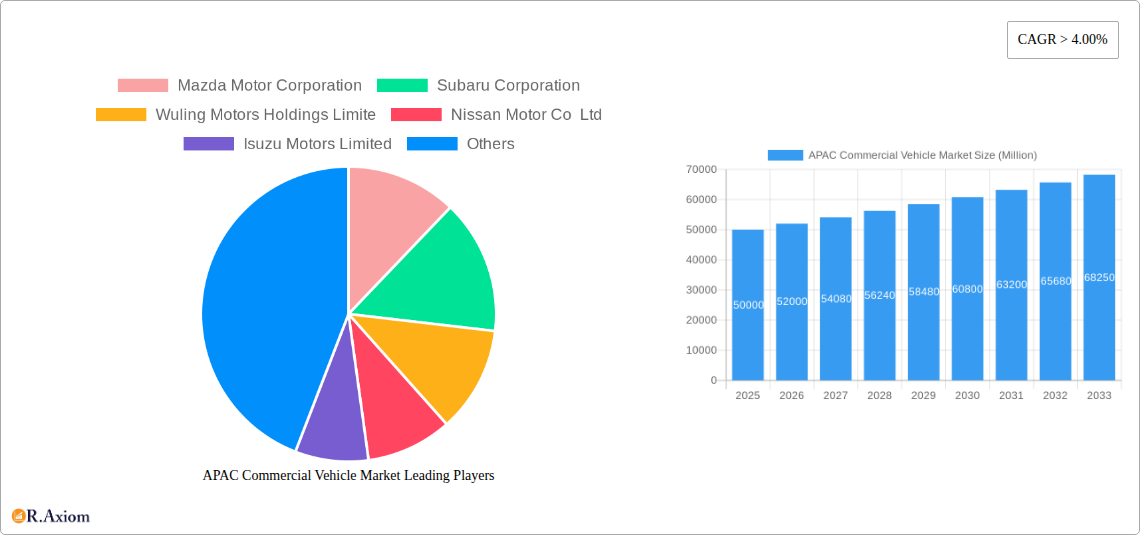
Key Insights
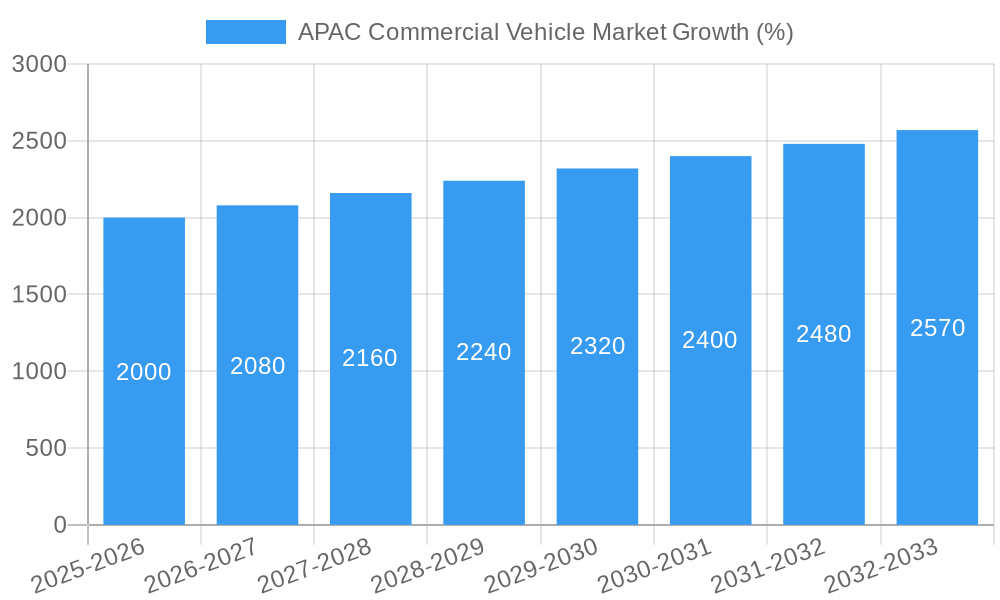
The Asia-Pacific (APAC) commercial vehicle market is experiencing robust growth, projected to maintain a Compound Annual Growth Rate (CAGR) exceeding 4% from 2025 to 2033. This expansion is driven by several key factors. Firstly, the region's burgeoning e-commerce sector fuels demand for efficient last-mile delivery solutions, significantly boosting the need for light and medium-duty commercial vehicles. Secondly, robust infrastructure development projects across numerous APAC nations are creating substantial demand for heavy-duty trucks and construction equipment. This infrastructure boom, coupled with increasing urbanization and industrialization, is further stimulating market growth. Finally, the ongoing shift towards hybrid and electric commercial vehicles, driven by environmental concerns and government regulations promoting sustainable transportation, is creating new market segments and driving innovation within the industry. While challenges like fluctuating fuel prices and supply chain disruptions exist, the overall positive economic outlook and increasing adoption of technologically advanced vehicles are expected to outweigh these headwinds.
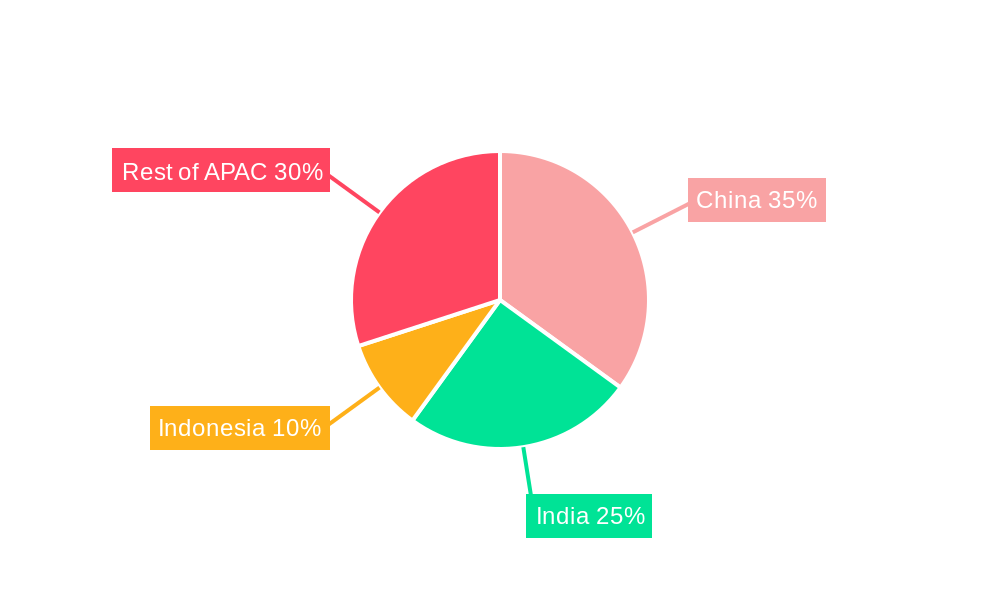
However, the market's growth trajectory is not uniform across all segments. While the demand for fuel-efficient LPG vehicles remains strong in certain segments, the rapid adoption of hybrid and electric powertrains is reshaping the propulsion type landscape. The commercial vehicle segment itself shows strong growth potential, with significant demand coming from countries such as China, India, and Indonesia. These countries' expanding economies and substantial investments in logistics infrastructure are directly impacting market volume. Market players, including established automotive giants like Toyota, Honda, and Hyundai, and local manufacturers like Wuling Motors and Tata Motors, are fiercely competing to capture market share by strategically investing in research and development, focusing on localization strategies, and catering to specific regional needs. The competitive landscape is dynamic, highlighting the need for continuous adaptation and innovation to stay ahead of the curve.
APAC Commercial Vehicle Market: A Comprehensive Forecast & Analysis (2019-2033)
This detailed report provides a comprehensive analysis of the Asia-Pacific (APAC) commercial vehicle market, offering invaluable insights for stakeholders across the automotive industry. Covering the period 2019-2033, with a focus on 2025, this report meticulously examines market trends, competitive dynamics, and future growth potential. The study incorporates detailed segmentation by vehicle type, propulsion type (including hybrid and electric vehicles), fuel type (including LPG), and key APAC countries including Australia, China, India, Indonesia, Japan, Malaysia, South Korea, Thailand, and the Rest-of-APAC. Key players like Toyota, Hyundai, and GM are analyzed for their market strategies and impact.
APAC Commercial Vehicle Market Market Concentration & Innovation
The APAC commercial vehicle market exhibits a moderately concentrated structure, with a few major players holding significant market share. The market share of the top five players in 2024 is estimated at xx%, highlighting the presence of both established global giants and rapidly growing regional manufacturers. Innovation is a key driver, fueled by stringent emission regulations, increasing demand for fuel efficiency, and the growing adoption of advanced driver-assistance systems (ADAS). Regulatory frameworks, varying across different APAC countries, significantly influence technological advancements and adoption rates. The rising preference for cleaner fuel alternatives, such as LPG and electric vehicles, is driving innovation in propulsion systems. Product substitutes, including rail and maritime transport, pose a competitive challenge, although the overall demand for commercial vehicles remains strong. Mergers and acquisitions (M&A) activities, particularly focused on technology acquisition and market expansion, are expected to intensify, with a total M&A deal value of approximately xx Million in 2024.
- Key Market Players' Share (2024): Toyota (xx%), Hyundai (xx%), Isuzu (xx%), Others (xx%).
- Major M&A Activities (2019-2024): xx deals totaling approximately xx Million.
- Innovation Focus Areas: Electric and Hybrid powertrains, ADAS, Connected vehicle technologies, Alternative fuel vehicles.
APAC Commercial Vehicle Market Industry Trends & Insights
The APAC commercial vehicle market is experiencing robust growth, driven by factors such as expanding infrastructure development, increasing e-commerce activities, and the growth of logistics and transportation sectors. The market is projected to register a Compound Annual Growth Rate (CAGR) of xx% during the forecast period (2025-2033). Technological disruptions, especially in propulsion systems, are significantly reshaping the market landscape. The market penetration of electric and hybrid commercial vehicles is gradually increasing, although challenges related to infrastructure and battery technology remain. Consumer preferences are shifting towards fuel-efficient, technologically advanced, and environmentally friendly vehicles. Competitive dynamics are intensifying, with both established players and new entrants vying for market share through product innovation, strategic partnerships, and aggressive marketing strategies. The increasing adoption of telematics and data analytics is further transforming the commercial vehicle industry.
Dominant Markets & Segments in APAC Commercial Vehicle Market
China dominates the APAC commercial vehicle market, accounting for the largest market share in terms of volume and value. This dominance is primarily driven by its robust economic growth, large population, and expanding infrastructure projects. India is another significant market, witnessing high growth rates fueled by increasing urbanization and industrialization. Within segments, the demand for light commercial vehicles (LCVs) is substantially higher than heavy commercial vehicles (HCVs) in most countries. The hybrid and electric vehicle segment is emerging, albeit slowly, with government incentives and regulations playing a crucial role. The LPG segment holds a niche but significant share, particularly in certain regions where LPG infrastructure is well-established.
- Key Drivers for China's Dominance: Massive infrastructure projects, rapid industrialization, government support for the automotive industry.
- Key Drivers for India's Growth: Expanding e-commerce sector, increasing urbanization, rising middle-class incomes.
- Dominant Vehicle Type: Light Commercial Vehicles (LCVs).
- Emerging Segment: Hybrid and Electric Vehicles.
APAC Commercial Vehicle Market Product Developments
Recent product developments are largely characterized by the introduction of fuel-efficient engines, advanced safety features, and the integration of telematics systems. Manufacturers are focusing on improving fuel economy through technological advancements, while also incorporating advanced driver-assistance systems (ADAS) to enhance safety and driver experience. The introduction of hybrid and electric commercial vehicles is gaining momentum, driven by the increasing demand for cleaner transportation options and stricter emission regulations. These new product offerings are tailored to meet the specific needs of various commercial vehicle applications, resulting in increased competitiveness and customer satisfaction.
Report Scope & Segmentation Analysis
This report segments the APAC commercial vehicle market based on vehicle type (LCVs, HCVs, etc.), propulsion type (ICE, hybrid, electric), fuel type (diesel, gasoline, LPG, CNG, etc.), and country (Australia, China, India, Indonesia, Japan, Malaysia, South Korea, Thailand, Rest-of-APAC). Each segment's growth projections, market size (in Million units and Million USD), and competitive dynamics are analyzed in detail. Growth in the electric vehicle segment is expected to be significantly higher than that of the conventional vehicles segment during the forecast period.
Key Drivers of APAC Commercial Vehicle Market Growth
The APAC commercial vehicle market's growth is fueled by several key factors: Firstly, robust economic growth across several APAC nations drives increased demand for logistics and transportation services. Secondly, government infrastructure investments, particularly in roads and railways, facilitate efficient goods movement. Thirdly, favorable government policies promoting the adoption of cleaner technologies, such as subsidies for electric vehicles and stringent emission norms, influence the market trajectory. Finally, the burgeoning e-commerce sector and its associated demand for delivery vehicles significantly contribute to market expansion.
Challenges in the APAC Commercial Vehicle Market Sector
Significant challenges exist in the APAC commercial vehicle market. Supply chain disruptions, particularly the shortage of semiconductors and other components, have impacted production and delivery timelines. Furthermore, varying emission standards and regulations across different countries pose logistical complexities and hinder market standardization. Intense competition from both established and emerging players, coupled with fluctuating fuel prices and economic uncertainties, further complicates the market landscape. These factors collectively lead to price volatility and margin pressure for manufacturers.
Emerging Opportunities in APAC Commercial Vehicle Market
Emerging opportunities lie in the adoption of electric and hybrid commercial vehicles, facilitated by government initiatives and improving battery technology. The development of smart transportation solutions, such as connected vehicles and autonomous driving technologies, presents substantial potential for growth. Further expansion into underserved rural markets and the increasing demand for specialized commercial vehicles, such as refrigerated trucks and delivery vans for the e-commerce sector, offer promising avenues for market expansion.
Leading Players in the APAC Commercial Vehicle Market Market
- Mazda Motor Corporation
- Subaru Corporation
- Wuling Motors Holdings Limite
- Nissan Motor Co Ltd
- Isuzu Motors Limited
- General Motors Company
- Anhui Ankai Automobile Co Ltd
- Dongfeng Motor Corporation
- Daihatsu Motor Co Ltd
- Tata Motors Limited
- Renault-Nissan-Mitsubishi Alliance
- Hyundai Motor Company
- Kia Corporation
- Toyota Motor Corporation
- Honda Motor Co Ltd
- Great Wall Motor Company Ltd (GWM)
- Mitsubishi Motors Corporation
- Suzuki Motor Corporation
- Ford Motor Company
Key Developments in APAC Commercial Vehicle Market Industry
- August 2023: General Motors will launch an all-electric Cadillac Escalade in late 2024. This signifies GM's commitment to the EV segment in the luxury commercial vehicle market.
- August 2023: General Motors doubles down on plans for an electric future in the Middle East. This indicates GM's expansion strategy in a key APAC region.
- August 2023: Toyota Kirloskar Motor launched the all-new MPV Vellfire strong hybrid electric vehicle (SHEV) for a starting price of INR 11.99 Million and going to INR 12.99 Million. This highlights Toyota's focus on hybrid technology in the APAC market.
Strategic Outlook for APAC Commercial Vehicle Market Market
The APAC commercial vehicle market presents immense growth potential driven by sustained economic growth, infrastructure development, and the increasing adoption of electric and hybrid vehicles. Strategic partnerships, technological innovation, and focused investments in research and development will be critical for success in this dynamic market. Companies that effectively adapt to evolving consumer preferences, government regulations, and technological disruptions will be best positioned to capture significant market share in the coming years. The focus on sustainability and the development of efficient and environmentally friendly vehicles will continue to shape the industry's future trajectory.
APAC Commercial Vehicle Market Segmentation
-
1. Vehicle Type
-
1.1. Commercial Vehicles
- 1.1.1. Buses
- 1.1.2. Heavy-duty Commercial Trucks
- 1.1.3. Light Commercial Pick-up Trucks
- 1.1.4. Light Commercial Vans
- 1.1.5. Medium-duty Commercial Trucks
-
1.1. Commercial Vehicles
-
2. Propulsion Type
-
2.1. Hybrid and Electric Vehicles
-
2.1.1. By Fuel Category
- 2.1.1.1. BEV
- 2.1.1.2. FCEV
- 2.1.1.3. HEV
- 2.1.1.4. PHEV
-
2.1.1. By Fuel Category
-
2.2. ICE
- 2.2.1. CNG
- 2.2.2. Diesel
- 2.2.3. Gasoline
- 2.2.4. LPG
-
2.1. Hybrid and Electric Vehicles
APAC Commercial Vehicle Market Segmentation By Geography
-
1. North America
- 1.1. United States
- 1.2. Canada
- 1.3. Mexico
-
2. South America
- 2.1. Brazil
- 2.2. Argentina
- 2.3. Rest of South America
-
3. Europe
- 3.1. United Kingdom
- 3.2. Germany
- 3.3. France
- 3.4. Italy
- 3.5. Spain
- 3.6. Russia
- 3.7. Benelux
- 3.8. Nordics
- 3.9. Rest of Europe
-
4. Middle East & Africa
- 4.1. Turkey
- 4.2. Israel
- 4.3. GCC
- 4.4. North Africa
- 4.5. South Africa
- 4.6. Rest of Middle East & Africa
-
5. Asia Pacific
- 5.1. China
- 5.2. India
- 5.3. Japan
- 5.4. South Korea
- 5.5. ASEAN
- 5.6. Oceania
- 5.7. Rest of Asia Pacific
APAC Commercial Vehicle Market REPORT HIGHLIGHTS
| Aspects | Details |
|---|---|
| Study Period | 2019-2033 |
| Base Year | 2024 |
| Estimated Year | 2025 |
| Forecast Period | 2025-2033 |
| Historical Period | 2019-2024 |
| Growth Rate | CAGR of > 4.00% from 2019-2033 |
| Segmentation |
|
Table of Contents
- 1. Introduction
- 1.1. Research Scope
- 1.2. Market Segmentation
- 1.3. Research Methodology
- 1.4. Definitions and Assumptions
- 2. Executive Summary
- 2.1. Introduction
- 3. Market Dynamics
- 3.1. Introduction
- 3.2. Market Drivers
- 3.2.1. Surge in Trend of Yacht Tourism
- 3.3. Market Restrains
- 3.3.1. Higher Rentals During Peak Season
- 3.4. Market Trends
- 3.4.1. OTHER KEY INDUSTRY TRENDS COVERED IN THE REPORT
- 4. Market Factor Analysis
- 4.1. Porters Five Forces
- 4.2. Supply/Value Chain
- 4.3. PESTEL analysis
- 4.4. Market Entropy
- 4.5. Patent/Trademark Analysis
- 5. Global APAC Commercial Vehicle Market Analysis, Insights and Forecast, 2019-2031
- 5.1. Market Analysis, Insights and Forecast - by Vehicle Type
- 5.1.1. Commercial Vehicles
- 5.1.1.1. Buses
- 5.1.1.2. Heavy-duty Commercial Trucks
- 5.1.1.3. Light Commercial Pick-up Trucks
- 5.1.1.4. Light Commercial Vans
- 5.1.1.5. Medium-duty Commercial Trucks
- 5.1.1. Commercial Vehicles
- 5.2. Market Analysis, Insights and Forecast - by Propulsion Type
- 5.2.1. Hybrid and Electric Vehicles
- 5.2.1.1. By Fuel Category
- 5.2.1.1.1. BEV
- 5.2.1.1.2. FCEV
- 5.2.1.1.3. HEV
- 5.2.1.1.4. PHEV
- 5.2.1.1. By Fuel Category
- 5.2.2. ICE
- 5.2.2.1. CNG
- 5.2.2.2. Diesel
- 5.2.2.3. Gasoline
- 5.2.2.4. LPG
- 5.2.1. Hybrid and Electric Vehicles
- 5.3. Market Analysis, Insights and Forecast - by Region
- 5.3.1. North America
- 5.3.2. South America
- 5.3.3. Europe
- 5.3.4. Middle East & Africa
- 5.3.5. Asia Pacific
- 5.1. Market Analysis, Insights and Forecast - by Vehicle Type
- 6. North America APAC Commercial Vehicle Market Analysis, Insights and Forecast, 2019-2031
- 6.1. Market Analysis, Insights and Forecast - by Vehicle Type
- 6.1.1. Commercial Vehicles
- 6.1.1.1. Buses
- 6.1.1.2. Heavy-duty Commercial Trucks
- 6.1.1.3. Light Commercial Pick-up Trucks
- 6.1.1.4. Light Commercial Vans
- 6.1.1.5. Medium-duty Commercial Trucks
- 6.1.1. Commercial Vehicles
- 6.2. Market Analysis, Insights and Forecast - by Propulsion Type
- 6.2.1. Hybrid and Electric Vehicles
- 6.2.1.1. By Fuel Category
- 6.2.1.1.1. BEV
- 6.2.1.1.2. FCEV
- 6.2.1.1.3. HEV
- 6.2.1.1.4. PHEV
- 6.2.1.1. By Fuel Category
- 6.2.2. ICE
- 6.2.2.1. CNG
- 6.2.2.2. Diesel
- 6.2.2.3. Gasoline
- 6.2.2.4. LPG
- 6.2.1. Hybrid and Electric Vehicles
- 6.1. Market Analysis, Insights and Forecast - by Vehicle Type
- 7. South America APAC Commercial Vehicle Market Analysis, Insights and Forecast, 2019-2031
- 7.1. Market Analysis, Insights and Forecast - by Vehicle Type
- 7.1.1. Commercial Vehicles
- 7.1.1.1. Buses
- 7.1.1.2. Heavy-duty Commercial Trucks
- 7.1.1.3. Light Commercial Pick-up Trucks
- 7.1.1.4. Light Commercial Vans
- 7.1.1.5. Medium-duty Commercial Trucks
- 7.1.1. Commercial Vehicles
- 7.2. Market Analysis, Insights and Forecast - by Propulsion Type
- 7.2.1. Hybrid and Electric Vehicles
- 7.2.1.1. By Fuel Category
- 7.2.1.1.1. BEV
- 7.2.1.1.2. FCEV
- 7.2.1.1.3. HEV
- 7.2.1.1.4. PHEV
- 7.2.1.1. By Fuel Category
- 7.2.2. ICE
- 7.2.2.1. CNG
- 7.2.2.2. Diesel
- 7.2.2.3. Gasoline
- 7.2.2.4. LPG
- 7.2.1. Hybrid and Electric Vehicles
- 7.1. Market Analysis, Insights and Forecast - by Vehicle Type
- 8. Europe APAC Commercial Vehicle Market Analysis, Insights and Forecast, 2019-2031
- 8.1. Market Analysis, Insights and Forecast - by Vehicle Type
- 8.1.1. Commercial Vehicles
- 8.1.1.1. Buses
- 8.1.1.2. Heavy-duty Commercial Trucks
- 8.1.1.3. Light Commercial Pick-up Trucks
- 8.1.1.4. Light Commercial Vans
- 8.1.1.5. Medium-duty Commercial Trucks
- 8.1.1. Commercial Vehicles
- 8.2. Market Analysis, Insights and Forecast - by Propulsion Type
- 8.2.1. Hybrid and Electric Vehicles
- 8.2.1.1. By Fuel Category
- 8.2.1.1.1. BEV
- 8.2.1.1.2. FCEV
- 8.2.1.1.3. HEV
- 8.2.1.1.4. PHEV
- 8.2.1.1. By Fuel Category
- 8.2.2. ICE
- 8.2.2.1. CNG
- 8.2.2.2. Diesel
- 8.2.2.3. Gasoline
- 8.2.2.4. LPG
- 8.2.1. Hybrid and Electric Vehicles
- 8.1. Market Analysis, Insights and Forecast - by Vehicle Type
- 9. Middle East & Africa APAC Commercial Vehicle Market Analysis, Insights and Forecast, 2019-2031
- 9.1. Market Analysis, Insights and Forecast - by Vehicle Type
- 9.1.1. Commercial Vehicles
- 9.1.1.1. Buses
- 9.1.1.2. Heavy-duty Commercial Trucks
- 9.1.1.3. Light Commercial Pick-up Trucks
- 9.1.1.4. Light Commercial Vans
- 9.1.1.5. Medium-duty Commercial Trucks
- 9.1.1. Commercial Vehicles
- 9.2. Market Analysis, Insights and Forecast - by Propulsion Type
- 9.2.1. Hybrid and Electric Vehicles
- 9.2.1.1. By Fuel Category
- 9.2.1.1.1. BEV
- 9.2.1.1.2. FCEV
- 9.2.1.1.3. HEV
- 9.2.1.1.4. PHEV
- 9.2.1.1. By Fuel Category
- 9.2.2. ICE
- 9.2.2.1. CNG
- 9.2.2.2. Diesel
- 9.2.2.3. Gasoline
- 9.2.2.4. LPG
- 9.2.1. Hybrid and Electric Vehicles
- 9.1. Market Analysis, Insights and Forecast - by Vehicle Type
- 10. Asia Pacific APAC Commercial Vehicle Market Analysis, Insights and Forecast, 2019-2031
- 10.1. Market Analysis, Insights and Forecast - by Vehicle Type
- 10.1.1. Commercial Vehicles
- 10.1.1.1. Buses
- 10.1.1.2. Heavy-duty Commercial Trucks
- 10.1.1.3. Light Commercial Pick-up Trucks
- 10.1.1.4. Light Commercial Vans
- 10.1.1.5. Medium-duty Commercial Trucks
- 10.1.1. Commercial Vehicles
- 10.2. Market Analysis, Insights and Forecast - by Propulsion Type
- 10.2.1. Hybrid and Electric Vehicles
- 10.2.1.1. By Fuel Category
- 10.2.1.1.1. BEV
- 10.2.1.1.2. FCEV
- 10.2.1.1.3. HEV
- 10.2.1.1.4. PHEV
- 10.2.1.1. By Fuel Category
- 10.2.2. ICE
- 10.2.2.1. CNG
- 10.2.2.2. Diesel
- 10.2.2.3. Gasoline
- 10.2.2.4. LPG
- 10.2.1. Hybrid and Electric Vehicles
- 10.1. Market Analysis, Insights and Forecast - by Vehicle Type
- 11. Competitive Analysis
- 11.1. Global Market Share Analysis 2024
- 11.2. Company Profiles
- 11.2.1 Mazda Motor Corporation
- 11.2.1.1. Overview
- 11.2.1.2. Products
- 11.2.1.3. SWOT Analysis
- 11.2.1.4. Recent Developments
- 11.2.1.5. Financials (Based on Availability)
- 11.2.2 Subaru Corporation
- 11.2.2.1. Overview
- 11.2.2.2. Products
- 11.2.2.3. SWOT Analysis
- 11.2.2.4. Recent Developments
- 11.2.2.5. Financials (Based on Availability)
- 11.2.3 Wuling Motors Holdings Limite
- 11.2.3.1. Overview
- 11.2.3.2. Products
- 11.2.3.3. SWOT Analysis
- 11.2.3.4. Recent Developments
- 11.2.3.5. Financials (Based on Availability)
- 11.2.4 Nissan Motor Co Ltd
- 11.2.4.1. Overview
- 11.2.4.2. Products
- 11.2.4.3. SWOT Analysis
- 11.2.4.4. Recent Developments
- 11.2.4.5. Financials (Based on Availability)
- 11.2.5 Isuzu Motors Limited
- 11.2.5.1. Overview
- 11.2.5.2. Products
- 11.2.5.3. SWOT Analysis
- 11.2.5.4. Recent Developments
- 11.2.5.5. Financials (Based on Availability)
- 11.2.6 General Motors Company
- 11.2.6.1. Overview
- 11.2.6.2. Products
- 11.2.6.3. SWOT Analysis
- 11.2.6.4. Recent Developments
- 11.2.6.5. Financials (Based on Availability)
- 11.2.7 Anhui Ankai Automobile Co Ltd
- 11.2.7.1. Overview
- 11.2.7.2. Products
- 11.2.7.3. SWOT Analysis
- 11.2.7.4. Recent Developments
- 11.2.7.5. Financials (Based on Availability)
- 11.2.8 Dongfeng Motor Corporation
- 11.2.8.1. Overview
- 11.2.8.2. Products
- 11.2.8.3. SWOT Analysis
- 11.2.8.4. Recent Developments
- 11.2.8.5. Financials (Based on Availability)
- 11.2.9 Daihatsu Motor Co Ltd
- 11.2.9.1. Overview
- 11.2.9.2. Products
- 11.2.9.3. SWOT Analysis
- 11.2.9.4. Recent Developments
- 11.2.9.5. Financials (Based on Availability)
- 11.2.10 Tata Motors Limited
- 11.2.10.1. Overview
- 11.2.10.2. Products
- 11.2.10.3. SWOT Analysis
- 11.2.10.4. Recent Developments
- 11.2.10.5. Financials (Based on Availability)
- 11.2.11 Renault-Nissan-Mitsubishi Alliance
- 11.2.11.1. Overview
- 11.2.11.2. Products
- 11.2.11.3. SWOT Analysis
- 11.2.11.4. Recent Developments
- 11.2.11.5. Financials (Based on Availability)
- 11.2.12 Hyundai Motor Company
- 11.2.12.1. Overview
- 11.2.12.2. Products
- 11.2.12.3. SWOT Analysis
- 11.2.12.4. Recent Developments
- 11.2.12.5. Financials (Based on Availability)
- 11.2.13 Kia Corporation
- 11.2.13.1. Overview
- 11.2.13.2. Products
- 11.2.13.3. SWOT Analysis
- 11.2.13.4. Recent Developments
- 11.2.13.5. Financials (Based on Availability)
- 11.2.14 Toyota Motor Corporation
- 11.2.14.1. Overview
- 11.2.14.2. Products
- 11.2.14.3. SWOT Analysis
- 11.2.14.4. Recent Developments
- 11.2.14.5. Financials (Based on Availability)
- 11.2.15 Honda Motor Co Ltd
- 11.2.15.1. Overview
- 11.2.15.2. Products
- 11.2.15.3. SWOT Analysis
- 11.2.15.4. Recent Developments
- 11.2.15.5. Financials (Based on Availability)
- 11.2.16 Great Wall Motor Company Ltd (GWM)
- 11.2.16.1. Overview
- 11.2.16.2. Products
- 11.2.16.3. SWOT Analysis
- 11.2.16.4. Recent Developments
- 11.2.16.5. Financials (Based on Availability)
- 11.2.17 Mitsubishi Motors Corporation
- 11.2.17.1. Overview
- 11.2.17.2. Products
- 11.2.17.3. SWOT Analysis
- 11.2.17.4. Recent Developments
- 11.2.17.5. Financials (Based on Availability)
- 11.2.18 Suzuki Motor Corporation
- 11.2.18.1. Overview
- 11.2.18.2. Products
- 11.2.18.3. SWOT Analysis
- 11.2.18.4. Recent Developments
- 11.2.18.5. Financials (Based on Availability)
- 11.2.19 Ford Motor Company
- 11.2.19.1. Overview
- 11.2.19.2. Products
- 11.2.19.3. SWOT Analysis
- 11.2.19.4. Recent Developments
- 11.2.19.5. Financials (Based on Availability)
- 11.2.1 Mazda Motor Corporation
List of Figures
- Figure 1: Global APAC Commercial Vehicle Market Revenue Breakdown (Million, %) by Region 2024 & 2032
- Figure 2: North America APAC Commercial Vehicle Market Revenue (Million), by Vehicle Type 2024 & 2032
- Figure 3: North America APAC Commercial Vehicle Market Revenue Share (%), by Vehicle Type 2024 & 2032
- Figure 4: North America APAC Commercial Vehicle Market Revenue (Million), by Propulsion Type 2024 & 2032
- Figure 5: North America APAC Commercial Vehicle Market Revenue Share (%), by Propulsion Type 2024 & 2032
- Figure 6: North America APAC Commercial Vehicle Market Revenue (Million), by Country 2024 & 2032
- Figure 7: North America APAC Commercial Vehicle Market Revenue Share (%), by Country 2024 & 2032
- Figure 8: South America APAC Commercial Vehicle Market Revenue (Million), by Vehicle Type 2024 & 2032
- Figure 9: South America APAC Commercial Vehicle Market Revenue Share (%), by Vehicle Type 2024 & 2032
- Figure 10: South America APAC Commercial Vehicle Market Revenue (Million), by Propulsion Type 2024 & 2032
- Figure 11: South America APAC Commercial Vehicle Market Revenue Share (%), by Propulsion Type 2024 & 2032
- Figure 12: South America APAC Commercial Vehicle Market Revenue (Million), by Country 2024 & 2032
- Figure 13: South America APAC Commercial Vehicle Market Revenue Share (%), by Country 2024 & 2032
- Figure 14: Europe APAC Commercial Vehicle Market Revenue (Million), by Vehicle Type 2024 & 2032
- Figure 15: Europe APAC Commercial Vehicle Market Revenue Share (%), by Vehicle Type 2024 & 2032
- Figure 16: Europe APAC Commercial Vehicle Market Revenue (Million), by Propulsion Type 2024 & 2032
- Figure 17: Europe APAC Commercial Vehicle Market Revenue Share (%), by Propulsion Type 2024 & 2032
- Figure 18: Europe APAC Commercial Vehicle Market Revenue (Million), by Country 2024 & 2032
- Figure 19: Europe APAC Commercial Vehicle Market Revenue Share (%), by Country 2024 & 2032
- Figure 20: Middle East & Africa APAC Commercial Vehicle Market Revenue (Million), by Vehicle Type 2024 & 2032
- Figure 21: Middle East & Africa APAC Commercial Vehicle Market Revenue Share (%), by Vehicle Type 2024 & 2032
- Figure 22: Middle East & Africa APAC Commercial Vehicle Market Revenue (Million), by Propulsion Type 2024 & 2032
- Figure 23: Middle East & Africa APAC Commercial Vehicle Market Revenue Share (%), by Propulsion Type 2024 & 2032
- Figure 24: Middle East & Africa APAC Commercial Vehicle Market Revenue (Million), by Country 2024 & 2032
- Figure 25: Middle East & Africa APAC Commercial Vehicle Market Revenue Share (%), by Country 2024 & 2032
- Figure 26: Asia Pacific APAC Commercial Vehicle Market Revenue (Million), by Vehicle Type 2024 & 2032
- Figure 27: Asia Pacific APAC Commercial Vehicle Market Revenue Share (%), by Vehicle Type 2024 & 2032
- Figure 28: Asia Pacific APAC Commercial Vehicle Market Revenue (Million), by Propulsion Type 2024 & 2032
- Figure 29: Asia Pacific APAC Commercial Vehicle Market Revenue Share (%), by Propulsion Type 2024 & 2032
- Figure 30: Asia Pacific APAC Commercial Vehicle Market Revenue (Million), by Country 2024 & 2032
- Figure 31: Asia Pacific APAC Commercial Vehicle Market Revenue Share (%), by Country 2024 & 2032
List of Tables
- Table 1: Global APAC Commercial Vehicle Market Revenue Million Forecast, by Region 2019 & 2032
- Table 2: Global APAC Commercial Vehicle Market Revenue Million Forecast, by Vehicle Type 2019 & 2032
- Table 3: Global APAC Commercial Vehicle Market Revenue Million Forecast, by Propulsion Type 2019 & 2032
- Table 4: Global APAC Commercial Vehicle Market Revenue Million Forecast, by Region 2019 & 2032
- Table 5: Global APAC Commercial Vehicle Market Revenue Million Forecast, by Vehicle Type 2019 & 2032
- Table 6: Global APAC Commercial Vehicle Market Revenue Million Forecast, by Propulsion Type 2019 & 2032
- Table 7: Global APAC Commercial Vehicle Market Revenue Million Forecast, by Country 2019 & 2032
- Table 8: United States APAC Commercial Vehicle Market Revenue (Million) Forecast, by Application 2019 & 2032
- Table 9: Canada APAC Commercial Vehicle Market Revenue (Million) Forecast, by Application 2019 & 2032
- Table 10: Mexico APAC Commercial Vehicle Market Revenue (Million) Forecast, by Application 2019 & 2032
- Table 11: Global APAC Commercial Vehicle Market Revenue Million Forecast, by Vehicle Type 2019 & 2032
- Table 12: Global APAC Commercial Vehicle Market Revenue Million Forecast, by Propulsion Type 2019 & 2032
- Table 13: Global APAC Commercial Vehicle Market Revenue Million Forecast, by Country 2019 & 2032
- Table 14: Brazil APAC Commercial Vehicle Market Revenue (Million) Forecast, by Application 2019 & 2032
- Table 15: Argentina APAC Commercial Vehicle Market Revenue (Million) Forecast, by Application 2019 & 2032
- Table 16: Rest of South America APAC Commercial Vehicle Market Revenue (Million) Forecast, by Application 2019 & 2032
- Table 17: Global APAC Commercial Vehicle Market Revenue Million Forecast, by Vehicle Type 2019 & 2032
- Table 18: Global APAC Commercial Vehicle Market Revenue Million Forecast, by Propulsion Type 2019 & 2032
- Table 19: Global APAC Commercial Vehicle Market Revenue Million Forecast, by Country 2019 & 2032
- Table 20: United Kingdom APAC Commercial Vehicle Market Revenue (Million) Forecast, by Application 2019 & 2032
- Table 21: Germany APAC Commercial Vehicle Market Revenue (Million) Forecast, by Application 2019 & 2032
- Table 22: France APAC Commercial Vehicle Market Revenue (Million) Forecast, by Application 2019 & 2032
- Table 23: Italy APAC Commercial Vehicle Market Revenue (Million) Forecast, by Application 2019 & 2032
- Table 24: Spain APAC Commercial Vehicle Market Revenue (Million) Forecast, by Application 2019 & 2032
- Table 25: Russia APAC Commercial Vehicle Market Revenue (Million) Forecast, by Application 2019 & 2032
- Table 26: Benelux APAC Commercial Vehicle Market Revenue (Million) Forecast, by Application 2019 & 2032
- Table 27: Nordics APAC Commercial Vehicle Market Revenue (Million) Forecast, by Application 2019 & 2032
- Table 28: Rest of Europe APAC Commercial Vehicle Market Revenue (Million) Forecast, by Application 2019 & 2032
- Table 29: Global APAC Commercial Vehicle Market Revenue Million Forecast, by Vehicle Type 2019 & 2032
- Table 30: Global APAC Commercial Vehicle Market Revenue Million Forecast, by Propulsion Type 2019 & 2032
- Table 31: Global APAC Commercial Vehicle Market Revenue Million Forecast, by Country 2019 & 2032
- Table 32: Turkey APAC Commercial Vehicle Market Revenue (Million) Forecast, by Application 2019 & 2032
- Table 33: Israel APAC Commercial Vehicle Market Revenue (Million) Forecast, by Application 2019 & 2032
- Table 34: GCC APAC Commercial Vehicle Market Revenue (Million) Forecast, by Application 2019 & 2032
- Table 35: North Africa APAC Commercial Vehicle Market Revenue (Million) Forecast, by Application 2019 & 2032
- Table 36: South Africa APAC Commercial Vehicle Market Revenue (Million) Forecast, by Application 2019 & 2032
- Table 37: Rest of Middle East & Africa APAC Commercial Vehicle Market Revenue (Million) Forecast, by Application 2019 & 2032
- Table 38: Global APAC Commercial Vehicle Market Revenue Million Forecast, by Vehicle Type 2019 & 2032
- Table 39: Global APAC Commercial Vehicle Market Revenue Million Forecast, by Propulsion Type 2019 & 2032
- Table 40: Global APAC Commercial Vehicle Market Revenue Million Forecast, by Country 2019 & 2032
- Table 41: China APAC Commercial Vehicle Market Revenue (Million) Forecast, by Application 2019 & 2032
- Table 42: India APAC Commercial Vehicle Market Revenue (Million) Forecast, by Application 2019 & 2032
- Table 43: Japan APAC Commercial Vehicle Market Revenue (Million) Forecast, by Application 2019 & 2032
- Table 44: South Korea APAC Commercial Vehicle Market Revenue (Million) Forecast, by Application 2019 & 2032
- Table 45: ASEAN APAC Commercial Vehicle Market Revenue (Million) Forecast, by Application 2019 & 2032
- Table 46: Oceania APAC Commercial Vehicle Market Revenue (Million) Forecast, by Application 2019 & 2032
- Table 47: Rest of Asia Pacific APAC Commercial Vehicle Market Revenue (Million) Forecast, by Application 2019 & 2032
Frequently Asked Questions
1. What is the projected Compound Annual Growth Rate (CAGR) of the APAC Commercial Vehicle Market?
The projected CAGR is approximately > 4.00%.
2. Which companies are prominent players in the APAC Commercial Vehicle Market?
Key companies in the market include Mazda Motor Corporation, Subaru Corporation, Wuling Motors Holdings Limite, Nissan Motor Co Ltd, Isuzu Motors Limited, General Motors Company, Anhui Ankai Automobile Co Ltd, Dongfeng Motor Corporation, Daihatsu Motor Co Ltd, Tata Motors Limited, Renault-Nissan-Mitsubishi Alliance, Hyundai Motor Company, Kia Corporation, Toyota Motor Corporation, Honda Motor Co Ltd, Great Wall Motor Company Ltd (GWM), Mitsubishi Motors Corporation, Suzuki Motor Corporation, Ford Motor Company.
3. What are the main segments of the APAC Commercial Vehicle Market?
The market segments include Vehicle Type, Propulsion Type.
4. Can you provide details about the market size?
The market size is estimated to be USD XX Million as of 2022.
5. What are some drivers contributing to market growth?
Surge in Trend of Yacht Tourism.
6. What are the notable trends driving market growth?
OTHER KEY INDUSTRY TRENDS COVERED IN THE REPORT.
7. Are there any restraints impacting market growth?
Higher Rentals During Peak Season.
8. Can you provide examples of recent developments in the market?
August 2023: General Motors will launch an all-electric Cadillac Escalade in late 2024August 2023: General Motors doubles down on plans for an electric future in the Middle East.August 2023: Toyota Kirloskar Motor launched the all-new MPV Vellfire strong hybrid electric vehicle (SHEV) for a starting price of INR 11.99 million and going to INR 12.99 million.
9. What pricing options are available for accessing the report?
Pricing options include single-user, multi-user, and enterprise licenses priced at USD 3800, USD 4500, and USD 5800 respectively.
10. Is the market size provided in terms of value or volume?
The market size is provided in terms of value, measured in Million.
11. Are there any specific market keywords associated with the report?
Yes, the market keyword associated with the report is "APAC Commercial Vehicle Market," which aids in identifying and referencing the specific market segment covered.
12. How do I determine which pricing option suits my needs best?
The pricing options vary based on user requirements and access needs. Individual users may opt for single-user licenses, while businesses requiring broader access may choose multi-user or enterprise licenses for cost-effective access to the report.
13. Are there any additional resources or data provided in the APAC Commercial Vehicle Market report?
While the report offers comprehensive insights, it's advisable to review the specific contents or supplementary materials provided to ascertain if additional resources or data are available.
14. How can I stay updated on further developments or reports in the APAC Commercial Vehicle Market?
To stay informed about further developments, trends, and reports in the APAC Commercial Vehicle Market, consider subscribing to industry newsletters, following relevant companies and organizations, or regularly checking reputable industry news sources and publications.
Methodology
Step 1 - Identification of Relevant Samples Size from Population Database


Step 2 - Approaches for Defining Global Market Size (Value, Volume* & Price*)

Note*: In applicable scenarios
Step 3 - Data Sources
Primary Research
- Web Analytics
- Survey Reports
- Research Institute
- Latest Research Reports
- Opinion Leaders
Secondary Research
- Annual Reports
- White Paper
- Latest Press Release
- Industry Association
- Paid Database
- Investor Presentations

Step 4 - Data Triangulation
Involves using different sources of information in order to increase the validity of a study
These sources are likely to be stakeholders in a program - participants, other researchers, program staff, other community members, and so on.
Then we put all data in single framework & apply various statistical tools to find out the dynamic on the market.
During the analysis stage, feedback from the stakeholder groups would be compared to determine areas of agreement as well as areas of divergence


