
Key Insights
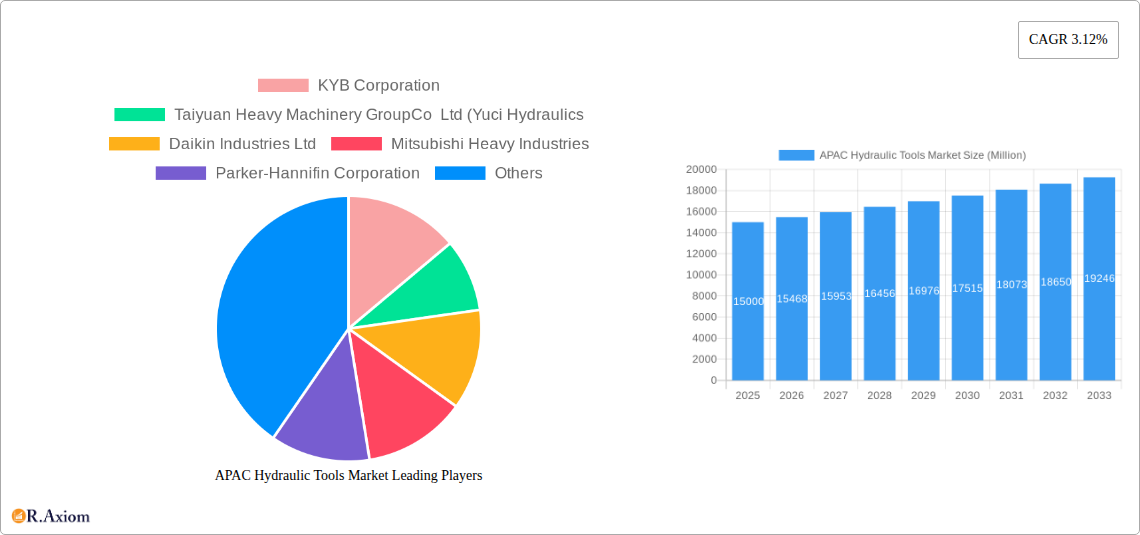
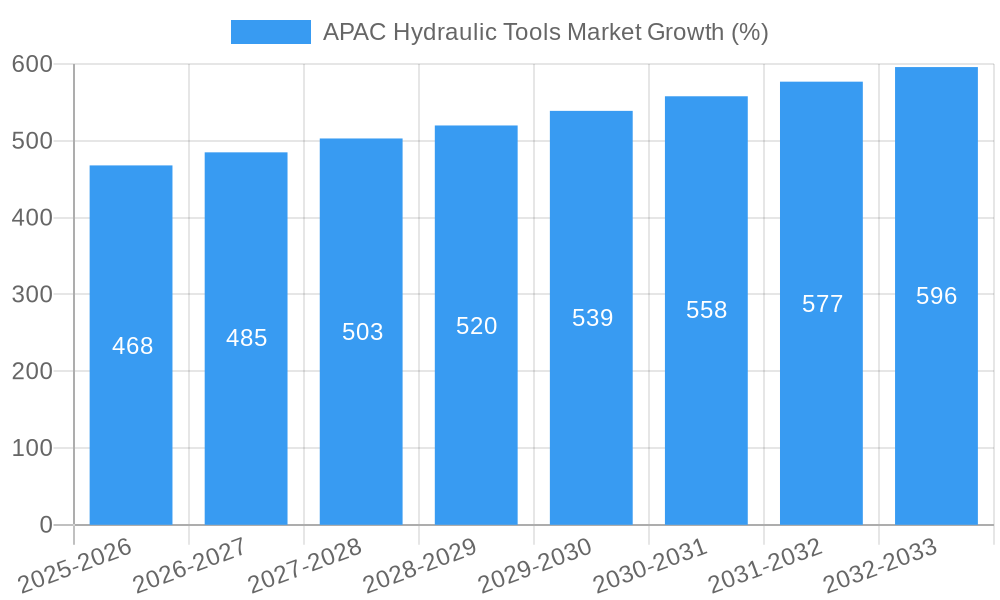
The Asia-Pacific (APAC) hydraulic tools market is experiencing robust growth, driven by the region's expanding infrastructure development, particularly in construction and industrial automation. A CAGR of 3.12% indicates a steady, albeit moderate, expansion. Significant contributors to this growth include China, Japan, India, and South Korea, which are experiencing increased urbanization and industrialization. The construction sector, fueled by large-scale infrastructure projects and building activities, represents a major end-user segment. Similarly, the burgeoning agricultural sector, with its rising demand for mechanized farming equipment, further boosts market demand. The increasing adoption of automation in manufacturing and material handling also fuels demand for advanced hydraulic tools. While the market faces challenges such as raw material price fluctuations and supply chain disruptions, technological advancements in hydraulic systems, such as the development of energy-efficient and more precise hydraulic components, are counteracting these restraints. The growing adoption of smart hydraulic systems further contributes to market growth. The market is segmented by equipment type (pumps, motors, valves, cylinders, etc.), end-user industry (construction, agriculture, etc.), and country, offering diverse opportunities for market participants. The competitive landscape is characterized by a mix of global and regional players, with companies strategically focusing on product innovation and expansion to capture significant market share. Given the projected growth trajectory, the APAC hydraulic tools market is poised for sustained expansion in the coming years. Further market penetration in emerging economies within the region alongside increasing automation adoption in several industries will further support market expansion.
The forecast period (2025-2033) suggests continued market expansion driven by consistent infrastructure development across the APAC region, particularly in high-growth economies. Technological advancements in hydraulic systems, aiming for improved efficiency and precision, will maintain growth momentum. However, potential economic downturns or global supply chain instability could influence growth rates. The ongoing expansion of manufacturing and industrial activities in countries like Vietnam and Indonesia presents significant untapped potential, suggesting a long-term positive outlook for the APAC hydraulic tools market. Specific sub-segments, such as high-precision hydraulic components for advanced manufacturing applications, may experience even faster growth than the overall market average. Competitive strategies will likely focus on localization, technological innovation, and strategic partnerships to maintain market leadership.
APAC Hydraulic Tools Market: A Comprehensive Market Report (2019-2033)
This in-depth report provides a comprehensive analysis of the Asia-Pacific (APAC) hydraulic tools market, offering valuable insights for industry stakeholders, investors, and strategic decision-makers. The report covers the period from 2019 to 2033, with 2025 as the base year and a forecast period of 2025-2033. The market is segmented by end-user industry, country, and hydraulic equipment type, providing a granular view of market dynamics. Key players like KYB Corporation, Taiyuan Heavy Machinery Group Co Ltd (Yuci Hydraulics), Daikin Industries Ltd, and others are analyzed for their market position and strategic initiatives.
APAC Hydraulic Tools Market Market Concentration & Innovation
The APAC hydraulic tools market exhibits a moderately concentrated landscape, with a few dominant players holding significant market share. KYB Corporation, Daikin Industries Ltd, and Parker-Hannifin Corporation, for example, collectively account for an estimated xx% of the market in 2025. However, the presence of numerous regional and specialized players fosters competition and innovation.
Market Concentration Metrics (2025):
- Top 5 players: xx% market share
- Top 10 players: xx% market share
- Herfindahl-Hirschman Index (HHI): xx
Innovation Drivers:
- Increasing demand for energy-efficient hydraulic systems.
- Advancements in hydraulic component technologies (e.g., electro-hydraulic controls, smart sensors).
- Growing adoption of Industry 4.0 technologies in manufacturing and construction.
Regulatory Frameworks & Product Substitutes:
The market is subject to various safety and environmental regulations, influencing design and manufacturing practices. The emergence of alternative technologies, such as electric and pneumatic systems, poses a competitive challenge, but their limited applicability in certain high-power applications maintains the dominance of hydraulic systems.
M&A Activities:
The past five years have witnessed a moderate level of M&A activity, with deal values totaling approximately xx Million. These activities primarily focused on expanding geographic reach, enhancing technological capabilities, and securing access to specialized components or expertise.
APAC Hydraulic Tools Market Industry Trends & Insights
The APAC hydraulic tools market is experiencing robust growth, driven by expanding infrastructure development, industrialization, and the increasing adoption of automation across various sectors. The market is projected to witness a Compound Annual Growth Rate (CAGR) of xx% during the forecast period (2025-2033).
Technological disruptions, such as the integration of IoT and AI in hydraulic systems, are transforming the industry, leading to smarter, more efficient, and remotely monitorable equipment. Consumer preferences are shifting towards advanced features like enhanced precision, durability, and ease of maintenance. Competitive dynamics are characterized by continuous product innovation, strategic partnerships, and efforts to enhance supply chain resilience. Market penetration of advanced hydraulic components is steadily increasing, especially in sectors like construction and material handling.
Dominant Markets & Segments in APAC Hydraulic Tools Market
By Country:
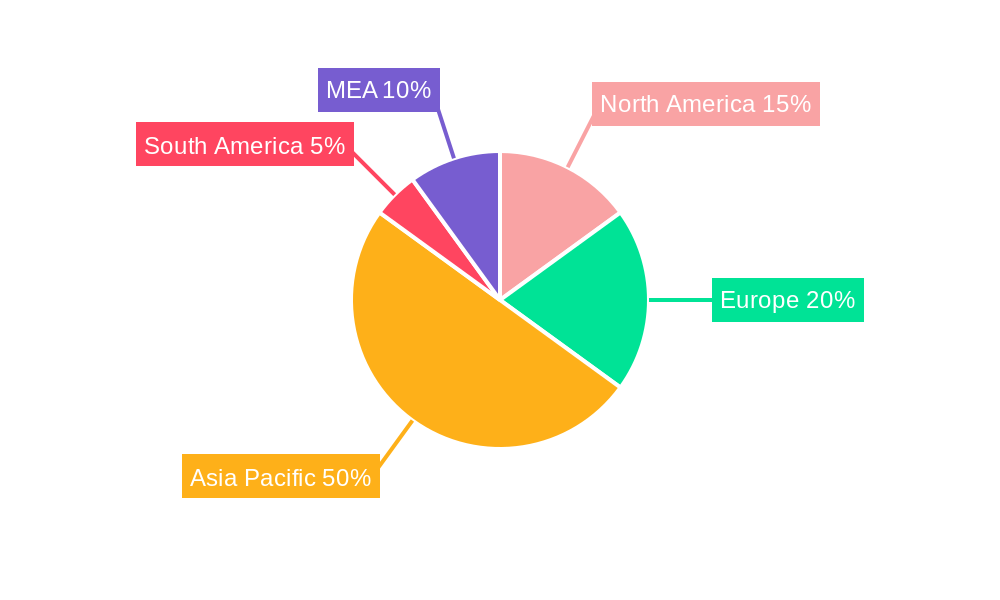
China dominates the APAC hydraulic tools market, accounting for the largest market share in 2025, driven by rapid industrialization and extensive infrastructure projects. India and South Korea are also significant markets, showcasing substantial growth potential. Japan, a technologically advanced nation, maintains a significant market presence, fueled by its robust manufacturing sector.
- Key Drivers for China: Government investments in infrastructure development, rapid urbanization, and a large manufacturing base.
- Key Drivers for India: Rising construction activity, increasing industrial output, and government initiatives to promote infrastructure development.
- Key Drivers for South Korea: Strong manufacturing sector, advanced technology adoption, and substantial government support for industrial automation.
By End-User Industry:
The construction sector represents the largest end-user segment, followed by material handling and agriculture. The oil & gas and aerospace & defense sectors contribute significantly, albeit to a lesser extent than construction. Machine tools and other end-user verticals are also exhibiting steady growth, primarily fueled by the growing demand for automation and precision engineering.
- Construction: High demand for excavators, bulldozers, and other construction equipment.
- Material Handling: Growing use of forklifts, cranes, and other material handling equipment.
- Agriculture: Increased adoption of advanced agricultural machinery.
By Hydraulic Equipment Type:
Pumps, valves, and cylinders represent the major segments within the hydraulic equipment type category. Accumulators and filters are crucial auxiliary components, while "Others" include transmission systems, fluid connectors, and accessories. The pump segment currently holds the largest market share, followed by valves and cylinders.
APAC Hydraulic Tools Market Product Developments
Recent product innovations focus on energy efficiency, improved performance, and enhanced durability. Hydraulic components are increasingly incorporating smart sensors, allowing for real-time monitoring and predictive maintenance. Manufacturers are also emphasizing modular designs and customization options to meet diverse application needs. The integration of advanced materials and manufacturing processes enhances the lifespan and reliability of hydraulic tools. These developments cater to the growing demand for improved efficiency and reduced downtime across diverse end-user applications.
Report Scope & Segmentation Analysis
This report comprehensively segments the APAC hydraulic tools market by:
End-User Industry: Construction, Agriculture, Material Handling, Oil & Gas, Aerospace & Defense, Other End-user Industries, Machine Tools, Other End-User Verticals. Each segment shows varying growth rates based on sector-specific trends.
Country: China, Japan, India, South Korea, Rest of Asia-Pacific. Each country displays unique growth trajectories based on economic activity and infrastructural development.
Hydraulic Equipment Type: Pump, Motor, Valve, Cylinder, Accumulators & Filters, Others (Transmission, Fluid Connectors, Auxiliary Components And Other Accessories). Growth projections for each type are differentiated by market demand and technological trends.
Market size estimations and competitive dynamics are provided for each segment, offering a detailed understanding of market opportunities and challenges.
Key Drivers of APAC Hydraulic Tools Market Growth
Several factors propel the growth of the APAC hydraulic tools market:
- Infrastructure Development: Massive investments in infrastructure projects across the region drive demand for construction and material handling equipment.
- Industrialization: The ongoing industrialization in several APAC countries fuels the demand for hydraulic tools in manufacturing and industrial processes.
- Technological Advancements: The continuous innovation in hydraulic component technologies enhances efficiency and performance, further stimulating market growth.
Challenges in the APAC Hydraulic Tools Market Sector
The APAC hydraulic tools market faces several challenges:
- Supply Chain Disruptions: Global supply chain vulnerabilities affect component availability and production costs.
- Fluctuating Raw Material Prices: Variations in the prices of steel and other raw materials impact manufacturing costs and profitability.
- Intense Competition: The presence of numerous domestic and international players creates intense competitive pressure.
Emerging Opportunities in APAC Hydraulic Tools Market
Emerging opportunities include:
- Smart Hydraulic Systems: The integration of IoT and AI offers significant opportunities for enhanced efficiency, predictive maintenance, and remote monitoring.
- Sustainable Hydraulic Fluids: Growing environmental concerns drive the demand for eco-friendly hydraulic fluids and sustainable practices.
- Specialized Applications: Demand for specialized hydraulic tools in niche applications like robotics and renewable energy is rapidly increasing.
Leading Players in the APAC Hydraulic Tools Market Market
- KYB Corporation
- Taiyuan Heavy Machinery Group Co Ltd (Yuci Hydraulics)
- Daikin Industries Ltd
- Mitsubishi Heavy Industries
- Parker-Hannifin Corporation
- Bosch Rexroth AG
- Emerson Electric Co
- Tata Hitachi Construction Machinery
- Danfoss Power Solutions
- Jiangsu Hengli Hydraulic Co Ltd
- Kobelco Group
- Kawasaki Heavy Industries Ltd
- Shimadzu Corporation
Key Developments in APAC Hydraulic Tools Market Industry
- Jan 2023: Parker-Hannifin Corporation launched a new line of energy-efficient hydraulic pumps.
- Oct 2022: Bosch Rexroth AG and a major construction equipment manufacturer announced a strategic partnership to develop advanced hydraulic systems.
- May 2021: Daikin Industries Ltd. acquired a smaller hydraulic component manufacturer to expand its product portfolio. (Further details on specific acquisitions and partnerships would be included in the full report)
Strategic Outlook for APAC Hydraulic Tools Market Market
The APAC hydraulic tools market is poised for continued growth, driven by sustained infrastructure development, industrialization, and technological advancements. Opportunities exist in developing smart hydraulic systems, adopting sustainable practices, and penetrating niche market segments. Companies with strong innovation capabilities, robust supply chains, and a focus on customer needs are best positioned to capitalize on the market's growth potential. The integration of advanced technologies and a focus on sustainable solutions will be critical for success in the coming years.
APAC Hydraulic Tools Market Segmentation
-
1. Hydraulic Equipment Type
- 1.1. Pump
- 1.2. Motor
- 1.3. Valve
- 1.4. Cylinder
- 1.5. Accumulators & Filters
- 1.6. Others
-
2. End-User Industry
- 2.1. Construction
- 2.2. Agriculture
- 2.3. Material Handling
- 2.4. Oil & Gas
- 2.5. Aerospace & Defense
- 2.6. Other End-user Industries
- 2.7. Machine Tools
- 2.8. Other End-User Verticals
APAC Hydraulic Tools Market Segmentation By Geography
-
1. North America
- 1.1. United States
- 1.2. Canada
- 1.3. Mexico
-
2. South America
- 2.1. Brazil
- 2.2. Argentina
- 2.3. Rest of South America
-
3. Europe
- 3.1. United Kingdom
- 3.2. Germany
- 3.3. France
- 3.4. Italy
- 3.5. Spain
- 3.6. Russia
- 3.7. Benelux
- 3.8. Nordics
- 3.9. Rest of Europe
-
4. Middle East & Africa
- 4.1. Turkey
- 4.2. Israel
- 4.3. GCC
- 4.4. North Africa
- 4.5. South Africa
- 4.6. Rest of Middle East & Africa
-
5. Asia Pacific
- 5.1. China
- 5.2. India
- 5.3. Japan
- 5.4. South Korea
- 5.5. ASEAN
- 5.6. Oceania
- 5.7. Rest of Asia Pacific
APAC Hydraulic Tools Market REPORT HIGHLIGHTS
| Aspects | Details |
|---|---|
| Study Period | 2019-2033 |
| Base Year | 2024 |
| Estimated Year | 2025 |
| Forecast Period | 2025-2033 |
| Historical Period | 2019-2024 |
| Growth Rate | CAGR of 3.12% from 2019-2033 |
| Segmentation |
|
Table of Contents
- 1. Introduction
- 1.1. Research Scope
- 1.2. Market Segmentation
- 1.3. Research Methodology
- 1.4. Definitions and Assumptions
- 2. Executive Summary
- 2.1. Introduction
- 3. Market Dynamics
- 3.1. Introduction
- 3.2. Market Drivers
- 3.2.1. ; Increasing Demand For Material Handling Equipment; Increasing Demand From Construction Industry Via Government Initiatives And Investments
- 3.3. Market Restrains
- 3.3.1. High Maintenance Cost Over the Entire Lifespan is Challenging the Market Growth
- 3.4. Market Trends
- 3.4.1. Construction Sector Will Experience Significant Growth and Drive the Market
- 4. Market Factor Analysis
- 4.1. Porters Five Forces
- 4.2. Supply/Value Chain
- 4.3. PESTEL analysis
- 4.4. Market Entropy
- 4.5. Patent/Trademark Analysis
- 5. Global APAC Hydraulic Tools Market Analysis, Insights and Forecast, 2019-2031
- 5.1. Market Analysis, Insights and Forecast - by Hydraulic Equipment Type
- 5.1.1. Pump
- 5.1.2. Motor
- 5.1.3. Valve
- 5.1.4. Cylinder
- 5.1.5. Accumulators & Filters
- 5.1.6. Others
- 5.2. Market Analysis, Insights and Forecast - by End-User Industry
- 5.2.1. Construction
- 5.2.2. Agriculture
- 5.2.3. Material Handling
- 5.2.4. Oil & Gas
- 5.2.5. Aerospace & Defense
- 5.2.6. Other End-user Industries
- 5.2.7. Machine Tools
- 5.2.8. Other End-User Verticals
- 5.3. Market Analysis, Insights and Forecast - by Region
- 5.3.1. North America
- 5.3.2. South America
- 5.3.3. Europe
- 5.3.4. Middle East & Africa
- 5.3.5. Asia Pacific
- 5.1. Market Analysis, Insights and Forecast - by Hydraulic Equipment Type
- 6. North America APAC Hydraulic Tools Market Analysis, Insights and Forecast, 2019-2031
- 6.1. Market Analysis, Insights and Forecast - by Hydraulic Equipment Type
- 6.1.1. Pump
- 6.1.2. Motor
- 6.1.3. Valve
- 6.1.4. Cylinder
- 6.1.5. Accumulators & Filters
- 6.1.6. Others
- 6.2. Market Analysis, Insights and Forecast - by End-User Industry
- 6.2.1. Construction
- 6.2.2. Agriculture
- 6.2.3. Material Handling
- 6.2.4. Oil & Gas
- 6.2.5. Aerospace & Defense
- 6.2.6. Other End-user Industries
- 6.2.7. Machine Tools
- 6.2.8. Other End-User Verticals
- 6.1. Market Analysis, Insights and Forecast - by Hydraulic Equipment Type
- 7. South America APAC Hydraulic Tools Market Analysis, Insights and Forecast, 2019-2031
- 7.1. Market Analysis, Insights and Forecast - by Hydraulic Equipment Type
- 7.1.1. Pump
- 7.1.2. Motor
- 7.1.3. Valve
- 7.1.4. Cylinder
- 7.1.5. Accumulators & Filters
- 7.1.6. Others
- 7.2. Market Analysis, Insights and Forecast - by End-User Industry
- 7.2.1. Construction
- 7.2.2. Agriculture
- 7.2.3. Material Handling
- 7.2.4. Oil & Gas
- 7.2.5. Aerospace & Defense
- 7.2.6. Other End-user Industries
- 7.2.7. Machine Tools
- 7.2.8. Other End-User Verticals
- 7.1. Market Analysis, Insights and Forecast - by Hydraulic Equipment Type
- 8. Europe APAC Hydraulic Tools Market Analysis, Insights and Forecast, 2019-2031
- 8.1. Market Analysis, Insights and Forecast - by Hydraulic Equipment Type
- 8.1.1. Pump
- 8.1.2. Motor
- 8.1.3. Valve
- 8.1.4. Cylinder
- 8.1.5. Accumulators & Filters
- 8.1.6. Others
- 8.2. Market Analysis, Insights and Forecast - by End-User Industry
- 8.2.1. Construction
- 8.2.2. Agriculture
- 8.2.3. Material Handling
- 8.2.4. Oil & Gas
- 8.2.5. Aerospace & Defense
- 8.2.6. Other End-user Industries
- 8.2.7. Machine Tools
- 8.2.8. Other End-User Verticals
- 8.1. Market Analysis, Insights and Forecast - by Hydraulic Equipment Type
- 9. Middle East & Africa APAC Hydraulic Tools Market Analysis, Insights and Forecast, 2019-2031
- 9.1. Market Analysis, Insights and Forecast - by Hydraulic Equipment Type
- 9.1.1. Pump
- 9.1.2. Motor
- 9.1.3. Valve
- 9.1.4. Cylinder
- 9.1.5. Accumulators & Filters
- 9.1.6. Others
- 9.2. Market Analysis, Insights and Forecast - by End-User Industry
- 9.2.1. Construction
- 9.2.2. Agriculture
- 9.2.3. Material Handling
- 9.2.4. Oil & Gas
- 9.2.5. Aerospace & Defense
- 9.2.6. Other End-user Industries
- 9.2.7. Machine Tools
- 9.2.8. Other End-User Verticals
- 9.1. Market Analysis, Insights and Forecast - by Hydraulic Equipment Type
- 10. Asia Pacific APAC Hydraulic Tools Market Analysis, Insights and Forecast, 2019-2031
- 10.1. Market Analysis, Insights and Forecast - by Hydraulic Equipment Type
- 10.1.1. Pump
- 10.1.2. Motor
- 10.1.3. Valve
- 10.1.4. Cylinder
- 10.1.5. Accumulators & Filters
- 10.1.6. Others
- 10.2. Market Analysis, Insights and Forecast - by End-User Industry
- 10.2.1. Construction
- 10.2.2. Agriculture
- 10.2.3. Material Handling
- 10.2.4. Oil & Gas
- 10.2.5. Aerospace & Defense
- 10.2.6. Other End-user Industries
- 10.2.7. Machine Tools
- 10.2.8. Other End-User Verticals
- 10.1. Market Analysis, Insights and Forecast - by Hydraulic Equipment Type
- 11. North America APAC Hydraulic Tools Market Analysis, Insights and Forecast, 2019-2031
- 11.1. Market Analysis, Insights and Forecast - By Country/Sub-region
- 11.1.1 United States
- 11.1.2 Canada
- 11.1.3 Mexico
- 12. Europe APAC Hydraulic Tools Market Analysis, Insights and Forecast, 2019-2031
- 12.1. Market Analysis, Insights and Forecast - By Country/Sub-region
- 12.1.1 Germany
- 12.1.2 United Kingdom
- 12.1.3 France
- 12.1.4 Spain
- 12.1.5 Italy
- 12.1.6 Spain
- 12.1.7 Belgium
- 12.1.8 Netherland
- 12.1.9 Nordics
- 12.1.10 Rest of Europe
- 13. Asia Pacific APAC Hydraulic Tools Market Analysis, Insights and Forecast, 2019-2031
- 13.1. Market Analysis, Insights and Forecast - By Country/Sub-region
- 13.1.1 China
- 13.1.2 Japan
- 13.1.3 India
- 13.1.4 South Korea
- 13.1.5 Southeast Asia
- 13.1.6 Australia
- 13.1.7 Indonesia
- 13.1.8 Phillipes
- 13.1.9 Singapore
- 13.1.10 Thailandc
- 13.1.11 Rest of Asia Pacific
- 14. South America APAC Hydraulic Tools Market Analysis, Insights and Forecast, 2019-2031
- 14.1. Market Analysis, Insights and Forecast - By Country/Sub-region
- 14.1.1 Brazil
- 14.1.2 Argentina
- 14.1.3 Peru
- 14.1.4 Chile
- 14.1.5 Colombia
- 14.1.6 Ecuador
- 14.1.7 Venezuela
- 14.1.8 Rest of South America
- 15. North America APAC Hydraulic Tools Market Analysis, Insights and Forecast, 2019-2031
- 15.1. Market Analysis, Insights and Forecast - By Country/Sub-region
- 15.1.1 United States
- 15.1.2 Canada
- 15.1.3 Mexico
- 16. MEA APAC Hydraulic Tools Market Analysis, Insights and Forecast, 2019-2031
- 16.1. Market Analysis, Insights and Forecast - By Country/Sub-region
- 16.1.1 United Arab Emirates
- 16.1.2 Saudi Arabia
- 16.1.3 South Africa
- 16.1.4 Rest of Middle East and Africa
- 17. Competitive Analysis
- 17.1. Global Market Share Analysis 2024
- 17.2. Company Profiles
- 17.2.1 KYB Corporation
- 17.2.1.1. Overview
- 17.2.1.2. Products
- 17.2.1.3. SWOT Analysis
- 17.2.1.4. Recent Developments
- 17.2.1.5. Financials (Based on Availability)
- 17.2.2 Taiyuan Heavy Machinery GroupCo Ltd (Yuci Hydraulics
- 17.2.2.1. Overview
- 17.2.2.2. Products
- 17.2.2.3. SWOT Analysis
- 17.2.2.4. Recent Developments
- 17.2.2.5. Financials (Based on Availability)
- 17.2.3 Daikin Industries Ltd
- 17.2.3.1. Overview
- 17.2.3.2. Products
- 17.2.3.3. SWOT Analysis
- 17.2.3.4. Recent Developments
- 17.2.3.5. Financials (Based on Availability)
- 17.2.4 Mitsubishi Heavy Industries
- 17.2.4.1. Overview
- 17.2.4.2. Products
- 17.2.4.3. SWOT Analysis
- 17.2.4.4. Recent Developments
- 17.2.4.5. Financials (Based on Availability)
- 17.2.5 Parker-Hannifin Corporation
- 17.2.5.1. Overview
- 17.2.5.2. Products
- 17.2.5.3. SWOT Analysis
- 17.2.5.4. Recent Developments
- 17.2.5.5. Financials (Based on Availability)
- 17.2.6 Bosch Rexroth AG
- 17.2.6.1. Overview
- 17.2.6.2. Products
- 17.2.6.3. SWOT Analysis
- 17.2.6.4. Recent Developments
- 17.2.6.5. Financials (Based on Availability)
- 17.2.7 Emerson Electric Co
- 17.2.7.1. Overview
- 17.2.7.2. Products
- 17.2.7.3. SWOT Analysis
- 17.2.7.4. Recent Developments
- 17.2.7.5. Financials (Based on Availability)
- 17.2.8 Tata Hitachi Construction Machinery
- 17.2.8.1. Overview
- 17.2.8.2. Products
- 17.2.8.3. SWOT Analysis
- 17.2.8.4. Recent Developments
- 17.2.8.5. Financials (Based on Availability)
- 17.2.9 Danfoss Power Solutions
- 17.2.9.1. Overview
- 17.2.9.2. Products
- 17.2.9.3. SWOT Analysis
- 17.2.9.4. Recent Developments
- 17.2.9.5. Financials (Based on Availability)
- 17.2.10 Jiangsu Hengli Hydraulic Co Ltd
- 17.2.10.1. Overview
- 17.2.10.2. Products
- 17.2.10.3. SWOT Analysis
- 17.2.10.4. Recent Developments
- 17.2.10.5. Financials (Based on Availability)
- 17.2.11 Kobelco Group
- 17.2.11.1. Overview
- 17.2.11.2. Products
- 17.2.11.3. SWOT Analysis
- 17.2.11.4. Recent Developments
- 17.2.11.5. Financials (Based on Availability)
- 17.2.12 Kawasaki Heavy Industries Ltd
- 17.2.12.1. Overview
- 17.2.12.2. Products
- 17.2.12.3. SWOT Analysis
- 17.2.12.4. Recent Developments
- 17.2.12.5. Financials (Based on Availability)
- 17.2.13 Shimadzu Corporation
- 17.2.13.1. Overview
- 17.2.13.2. Products
- 17.2.13.3. SWOT Analysis
- 17.2.13.4. Recent Developments
- 17.2.13.5. Financials (Based on Availability)
- 17.2.1 KYB Corporation
List of Figures
- Figure 1: Global APAC Hydraulic Tools Market Revenue Breakdown (Million, %) by Region 2024 & 2032
- Figure 2: Global APAC Hydraulic Tools Market Volume Breakdown (K Unit, %) by Region 2024 & 2032
- Figure 3: North America APAC Hydraulic Tools Market Revenue (Million), by Country 2024 & 2032
- Figure 4: North America APAC Hydraulic Tools Market Volume (K Unit), by Country 2024 & 2032
- Figure 5: North America APAC Hydraulic Tools Market Revenue Share (%), by Country 2024 & 2032
- Figure 6: North America APAC Hydraulic Tools Market Volume Share (%), by Country 2024 & 2032
- Figure 7: Europe APAC Hydraulic Tools Market Revenue (Million), by Country 2024 & 2032
- Figure 8: Europe APAC Hydraulic Tools Market Volume (K Unit), by Country 2024 & 2032
- Figure 9: Europe APAC Hydraulic Tools Market Revenue Share (%), by Country 2024 & 2032
- Figure 10: Europe APAC Hydraulic Tools Market Volume Share (%), by Country 2024 & 2032
- Figure 11: Asia Pacific APAC Hydraulic Tools Market Revenue (Million), by Country 2024 & 2032
- Figure 12: Asia Pacific APAC Hydraulic Tools Market Volume (K Unit), by Country 2024 & 2032
- Figure 13: Asia Pacific APAC Hydraulic Tools Market Revenue Share (%), by Country 2024 & 2032
- Figure 14: Asia Pacific APAC Hydraulic Tools Market Volume Share (%), by Country 2024 & 2032
- Figure 15: South America APAC Hydraulic Tools Market Revenue (Million), by Country 2024 & 2032
- Figure 16: South America APAC Hydraulic Tools Market Volume (K Unit), by Country 2024 & 2032
- Figure 17: South America APAC Hydraulic Tools Market Revenue Share (%), by Country 2024 & 2032
- Figure 18: South America APAC Hydraulic Tools Market Volume Share (%), by Country 2024 & 2032
- Figure 19: North America APAC Hydraulic Tools Market Revenue (Million), by Country 2024 & 2032
- Figure 20: North America APAC Hydraulic Tools Market Volume (K Unit), by Country 2024 & 2032
- Figure 21: North America APAC Hydraulic Tools Market Revenue Share (%), by Country 2024 & 2032
- Figure 22: North America APAC Hydraulic Tools Market Volume Share (%), by Country 2024 & 2032
- Figure 23: MEA APAC Hydraulic Tools Market Revenue (Million), by Country 2024 & 2032
- Figure 24: MEA APAC Hydraulic Tools Market Volume (K Unit), by Country 2024 & 2032
- Figure 25: MEA APAC Hydraulic Tools Market Revenue Share (%), by Country 2024 & 2032
- Figure 26: MEA APAC Hydraulic Tools Market Volume Share (%), by Country 2024 & 2032
- Figure 27: North America APAC Hydraulic Tools Market Revenue (Million), by Hydraulic Equipment Type 2024 & 2032
- Figure 28: North America APAC Hydraulic Tools Market Volume (K Unit), by Hydraulic Equipment Type 2024 & 2032
- Figure 29: North America APAC Hydraulic Tools Market Revenue Share (%), by Hydraulic Equipment Type 2024 & 2032
- Figure 30: North America APAC Hydraulic Tools Market Volume Share (%), by Hydraulic Equipment Type 2024 & 2032
- Figure 31: North America APAC Hydraulic Tools Market Revenue (Million), by End-User Industry 2024 & 2032
- Figure 32: North America APAC Hydraulic Tools Market Volume (K Unit), by End-User Industry 2024 & 2032
- Figure 33: North America APAC Hydraulic Tools Market Revenue Share (%), by End-User Industry 2024 & 2032
- Figure 34: North America APAC Hydraulic Tools Market Volume Share (%), by End-User Industry 2024 & 2032
- Figure 35: North America APAC Hydraulic Tools Market Revenue (Million), by Country 2024 & 2032
- Figure 36: North America APAC Hydraulic Tools Market Volume (K Unit), by Country 2024 & 2032
- Figure 37: North America APAC Hydraulic Tools Market Revenue Share (%), by Country 2024 & 2032
- Figure 38: North America APAC Hydraulic Tools Market Volume Share (%), by Country 2024 & 2032
- Figure 39: South America APAC Hydraulic Tools Market Revenue (Million), by Hydraulic Equipment Type 2024 & 2032
- Figure 40: South America APAC Hydraulic Tools Market Volume (K Unit), by Hydraulic Equipment Type 2024 & 2032
- Figure 41: South America APAC Hydraulic Tools Market Revenue Share (%), by Hydraulic Equipment Type 2024 & 2032
- Figure 42: South America APAC Hydraulic Tools Market Volume Share (%), by Hydraulic Equipment Type 2024 & 2032
- Figure 43: South America APAC Hydraulic Tools Market Revenue (Million), by End-User Industry 2024 & 2032
- Figure 44: South America APAC Hydraulic Tools Market Volume (K Unit), by End-User Industry 2024 & 2032
- Figure 45: South America APAC Hydraulic Tools Market Revenue Share (%), by End-User Industry 2024 & 2032
- Figure 46: South America APAC Hydraulic Tools Market Volume Share (%), by End-User Industry 2024 & 2032
- Figure 47: South America APAC Hydraulic Tools Market Revenue (Million), by Country 2024 & 2032
- Figure 48: South America APAC Hydraulic Tools Market Volume (K Unit), by Country 2024 & 2032
- Figure 49: South America APAC Hydraulic Tools Market Revenue Share (%), by Country 2024 & 2032
- Figure 50: South America APAC Hydraulic Tools Market Volume Share (%), by Country 2024 & 2032
- Figure 51: Europe APAC Hydraulic Tools Market Revenue (Million), by Hydraulic Equipment Type 2024 & 2032
- Figure 52: Europe APAC Hydraulic Tools Market Volume (K Unit), by Hydraulic Equipment Type 2024 & 2032
- Figure 53: Europe APAC Hydraulic Tools Market Revenue Share (%), by Hydraulic Equipment Type 2024 & 2032
- Figure 54: Europe APAC Hydraulic Tools Market Volume Share (%), by Hydraulic Equipment Type 2024 & 2032
- Figure 55: Europe APAC Hydraulic Tools Market Revenue (Million), by End-User Industry 2024 & 2032
- Figure 56: Europe APAC Hydraulic Tools Market Volume (K Unit), by End-User Industry 2024 & 2032
- Figure 57: Europe APAC Hydraulic Tools Market Revenue Share (%), by End-User Industry 2024 & 2032
- Figure 58: Europe APAC Hydraulic Tools Market Volume Share (%), by End-User Industry 2024 & 2032
- Figure 59: Europe APAC Hydraulic Tools Market Revenue (Million), by Country 2024 & 2032
- Figure 60: Europe APAC Hydraulic Tools Market Volume (K Unit), by Country 2024 & 2032
- Figure 61: Europe APAC Hydraulic Tools Market Revenue Share (%), by Country 2024 & 2032
- Figure 62: Europe APAC Hydraulic Tools Market Volume Share (%), by Country 2024 & 2032
- Figure 63: Middle East & Africa APAC Hydraulic Tools Market Revenue (Million), by Hydraulic Equipment Type 2024 & 2032
- Figure 64: Middle East & Africa APAC Hydraulic Tools Market Volume (K Unit), by Hydraulic Equipment Type 2024 & 2032
- Figure 65: Middle East & Africa APAC Hydraulic Tools Market Revenue Share (%), by Hydraulic Equipment Type 2024 & 2032
- Figure 66: Middle East & Africa APAC Hydraulic Tools Market Volume Share (%), by Hydraulic Equipment Type 2024 & 2032
- Figure 67: Middle East & Africa APAC Hydraulic Tools Market Revenue (Million), by End-User Industry 2024 & 2032
- Figure 68: Middle East & Africa APAC Hydraulic Tools Market Volume (K Unit), by End-User Industry 2024 & 2032
- Figure 69: Middle East & Africa APAC Hydraulic Tools Market Revenue Share (%), by End-User Industry 2024 & 2032
- Figure 70: Middle East & Africa APAC Hydraulic Tools Market Volume Share (%), by End-User Industry 2024 & 2032
- Figure 71: Middle East & Africa APAC Hydraulic Tools Market Revenue (Million), by Country 2024 & 2032
- Figure 72: Middle East & Africa APAC Hydraulic Tools Market Volume (K Unit), by Country 2024 & 2032
- Figure 73: Middle East & Africa APAC Hydraulic Tools Market Revenue Share (%), by Country 2024 & 2032
- Figure 74: Middle East & Africa APAC Hydraulic Tools Market Volume Share (%), by Country 2024 & 2032
- Figure 75: Asia Pacific APAC Hydraulic Tools Market Revenue (Million), by Hydraulic Equipment Type 2024 & 2032
- Figure 76: Asia Pacific APAC Hydraulic Tools Market Volume (K Unit), by Hydraulic Equipment Type 2024 & 2032
- Figure 77: Asia Pacific APAC Hydraulic Tools Market Revenue Share (%), by Hydraulic Equipment Type 2024 & 2032
- Figure 78: Asia Pacific APAC Hydraulic Tools Market Volume Share (%), by Hydraulic Equipment Type 2024 & 2032
- Figure 79: Asia Pacific APAC Hydraulic Tools Market Revenue (Million), by End-User Industry 2024 & 2032
- Figure 80: Asia Pacific APAC Hydraulic Tools Market Volume (K Unit), by End-User Industry 2024 & 2032
- Figure 81: Asia Pacific APAC Hydraulic Tools Market Revenue Share (%), by End-User Industry 2024 & 2032
- Figure 82: Asia Pacific APAC Hydraulic Tools Market Volume Share (%), by End-User Industry 2024 & 2032
- Figure 83: Asia Pacific APAC Hydraulic Tools Market Revenue (Million), by Country 2024 & 2032
- Figure 84: Asia Pacific APAC Hydraulic Tools Market Volume (K Unit), by Country 2024 & 2032
- Figure 85: Asia Pacific APAC Hydraulic Tools Market Revenue Share (%), by Country 2024 & 2032
- Figure 86: Asia Pacific APAC Hydraulic Tools Market Volume Share (%), by Country 2024 & 2032
List of Tables
- Table 1: Global APAC Hydraulic Tools Market Revenue Million Forecast, by Region 2019 & 2032
- Table 2: Global APAC Hydraulic Tools Market Volume K Unit Forecast, by Region 2019 & 2032
- Table 3: Global APAC Hydraulic Tools Market Revenue Million Forecast, by Hydraulic Equipment Type 2019 & 2032
- Table 4: Global APAC Hydraulic Tools Market Volume K Unit Forecast, by Hydraulic Equipment Type 2019 & 2032
- Table 5: Global APAC Hydraulic Tools Market Revenue Million Forecast, by End-User Industry 2019 & 2032
- Table 6: Global APAC Hydraulic Tools Market Volume K Unit Forecast, by End-User Industry 2019 & 2032
- Table 7: Global APAC Hydraulic Tools Market Revenue Million Forecast, by Region 2019 & 2032
- Table 8: Global APAC Hydraulic Tools Market Volume K Unit Forecast, by Region 2019 & 2032
- Table 9: Global APAC Hydraulic Tools Market Revenue Million Forecast, by Country 2019 & 2032
- Table 10: Global APAC Hydraulic Tools Market Volume K Unit Forecast, by Country 2019 & 2032
- Table 11: United States APAC Hydraulic Tools Market Revenue (Million) Forecast, by Application 2019 & 2032
- Table 12: United States APAC Hydraulic Tools Market Volume (K Unit) Forecast, by Application 2019 & 2032
- Table 13: Canada APAC Hydraulic Tools Market Revenue (Million) Forecast, by Application 2019 & 2032
- Table 14: Canada APAC Hydraulic Tools Market Volume (K Unit) Forecast, by Application 2019 & 2032
- Table 15: Mexico APAC Hydraulic Tools Market Revenue (Million) Forecast, by Application 2019 & 2032
- Table 16: Mexico APAC Hydraulic Tools Market Volume (K Unit) Forecast, by Application 2019 & 2032
- Table 17: Global APAC Hydraulic Tools Market Revenue Million Forecast, by Country 2019 & 2032
- Table 18: Global APAC Hydraulic Tools Market Volume K Unit Forecast, by Country 2019 & 2032
- Table 19: Germany APAC Hydraulic Tools Market Revenue (Million) Forecast, by Application 2019 & 2032
- Table 20: Germany APAC Hydraulic Tools Market Volume (K Unit) Forecast, by Application 2019 & 2032
- Table 21: United Kingdom APAC Hydraulic Tools Market Revenue (Million) Forecast, by Application 2019 & 2032
- Table 22: United Kingdom APAC Hydraulic Tools Market Volume (K Unit) Forecast, by Application 2019 & 2032
- Table 23: France APAC Hydraulic Tools Market Revenue (Million) Forecast, by Application 2019 & 2032
- Table 24: France APAC Hydraulic Tools Market Volume (K Unit) Forecast, by Application 2019 & 2032
- Table 25: Spain APAC Hydraulic Tools Market Revenue (Million) Forecast, by Application 2019 & 2032
- Table 26: Spain APAC Hydraulic Tools Market Volume (K Unit) Forecast, by Application 2019 & 2032
- Table 27: Italy APAC Hydraulic Tools Market Revenue (Million) Forecast, by Application 2019 & 2032
- Table 28: Italy APAC Hydraulic Tools Market Volume (K Unit) Forecast, by Application 2019 & 2032
- Table 29: Spain APAC Hydraulic Tools Market Revenue (Million) Forecast, by Application 2019 & 2032
- Table 30: Spain APAC Hydraulic Tools Market Volume (K Unit) Forecast, by Application 2019 & 2032
- Table 31: Belgium APAC Hydraulic Tools Market Revenue (Million) Forecast, by Application 2019 & 2032
- Table 32: Belgium APAC Hydraulic Tools Market Volume (K Unit) Forecast, by Application 2019 & 2032
- Table 33: Netherland APAC Hydraulic Tools Market Revenue (Million) Forecast, by Application 2019 & 2032
- Table 34: Netherland APAC Hydraulic Tools Market Volume (K Unit) Forecast, by Application 2019 & 2032
- Table 35: Nordics APAC Hydraulic Tools Market Revenue (Million) Forecast, by Application 2019 & 2032
- Table 36: Nordics APAC Hydraulic Tools Market Volume (K Unit) Forecast, by Application 2019 & 2032
- Table 37: Rest of Europe APAC Hydraulic Tools Market Revenue (Million) Forecast, by Application 2019 & 2032
- Table 38: Rest of Europe APAC Hydraulic Tools Market Volume (K Unit) Forecast, by Application 2019 & 2032
- Table 39: Global APAC Hydraulic Tools Market Revenue Million Forecast, by Country 2019 & 2032
- Table 40: Global APAC Hydraulic Tools Market Volume K Unit Forecast, by Country 2019 & 2032
- Table 41: China APAC Hydraulic Tools Market Revenue (Million) Forecast, by Application 2019 & 2032
- Table 42: China APAC Hydraulic Tools Market Volume (K Unit) Forecast, by Application 2019 & 2032
- Table 43: Japan APAC Hydraulic Tools Market Revenue (Million) Forecast, by Application 2019 & 2032
- Table 44: Japan APAC Hydraulic Tools Market Volume (K Unit) Forecast, by Application 2019 & 2032
- Table 45: India APAC Hydraulic Tools Market Revenue (Million) Forecast, by Application 2019 & 2032
- Table 46: India APAC Hydraulic Tools Market Volume (K Unit) Forecast, by Application 2019 & 2032
- Table 47: South Korea APAC Hydraulic Tools Market Revenue (Million) Forecast, by Application 2019 & 2032
- Table 48: South Korea APAC Hydraulic Tools Market Volume (K Unit) Forecast, by Application 2019 & 2032
- Table 49: Southeast Asia APAC Hydraulic Tools Market Revenue (Million) Forecast, by Application 2019 & 2032
- Table 50: Southeast Asia APAC Hydraulic Tools Market Volume (K Unit) Forecast, by Application 2019 & 2032
- Table 51: Australia APAC Hydraulic Tools Market Revenue (Million) Forecast, by Application 2019 & 2032
- Table 52: Australia APAC Hydraulic Tools Market Volume (K Unit) Forecast, by Application 2019 & 2032
- Table 53: Indonesia APAC Hydraulic Tools Market Revenue (Million) Forecast, by Application 2019 & 2032
- Table 54: Indonesia APAC Hydraulic Tools Market Volume (K Unit) Forecast, by Application 2019 & 2032
- Table 55: Phillipes APAC Hydraulic Tools Market Revenue (Million) Forecast, by Application 2019 & 2032
- Table 56: Phillipes APAC Hydraulic Tools Market Volume (K Unit) Forecast, by Application 2019 & 2032
- Table 57: Singapore APAC Hydraulic Tools Market Revenue (Million) Forecast, by Application 2019 & 2032
- Table 58: Singapore APAC Hydraulic Tools Market Volume (K Unit) Forecast, by Application 2019 & 2032
- Table 59: Thailandc APAC Hydraulic Tools Market Revenue (Million) Forecast, by Application 2019 & 2032
- Table 60: Thailandc APAC Hydraulic Tools Market Volume (K Unit) Forecast, by Application 2019 & 2032
- Table 61: Rest of Asia Pacific APAC Hydraulic Tools Market Revenue (Million) Forecast, by Application 2019 & 2032
- Table 62: Rest of Asia Pacific APAC Hydraulic Tools Market Volume (K Unit) Forecast, by Application 2019 & 2032
- Table 63: Global APAC Hydraulic Tools Market Revenue Million Forecast, by Country 2019 & 2032
- Table 64: Global APAC Hydraulic Tools Market Volume K Unit Forecast, by Country 2019 & 2032
- Table 65: Brazil APAC Hydraulic Tools Market Revenue (Million) Forecast, by Application 2019 & 2032
- Table 66: Brazil APAC Hydraulic Tools Market Volume (K Unit) Forecast, by Application 2019 & 2032
- Table 67: Argentina APAC Hydraulic Tools Market Revenue (Million) Forecast, by Application 2019 & 2032
- Table 68: Argentina APAC Hydraulic Tools Market Volume (K Unit) Forecast, by Application 2019 & 2032
- Table 69: Peru APAC Hydraulic Tools Market Revenue (Million) Forecast, by Application 2019 & 2032
- Table 70: Peru APAC Hydraulic Tools Market Volume (K Unit) Forecast, by Application 2019 & 2032
- Table 71: Chile APAC Hydraulic Tools Market Revenue (Million) Forecast, by Application 2019 & 2032
- Table 72: Chile APAC Hydraulic Tools Market Volume (K Unit) Forecast, by Application 2019 & 2032
- Table 73: Colombia APAC Hydraulic Tools Market Revenue (Million) Forecast, by Application 2019 & 2032
- Table 74: Colombia APAC Hydraulic Tools Market Volume (K Unit) Forecast, by Application 2019 & 2032
- Table 75: Ecuador APAC Hydraulic Tools Market Revenue (Million) Forecast, by Application 2019 & 2032
- Table 76: Ecuador APAC Hydraulic Tools Market Volume (K Unit) Forecast, by Application 2019 & 2032
- Table 77: Venezuela APAC Hydraulic Tools Market Revenue (Million) Forecast, by Application 2019 & 2032
- Table 78: Venezuela APAC Hydraulic Tools Market Volume (K Unit) Forecast, by Application 2019 & 2032
- Table 79: Rest of South America APAC Hydraulic Tools Market Revenue (Million) Forecast, by Application 2019 & 2032
- Table 80: Rest of South America APAC Hydraulic Tools Market Volume (K Unit) Forecast, by Application 2019 & 2032
- Table 81: Global APAC Hydraulic Tools Market Revenue Million Forecast, by Country 2019 & 2032
- Table 82: Global APAC Hydraulic Tools Market Volume K Unit Forecast, by Country 2019 & 2032
- Table 83: United States APAC Hydraulic Tools Market Revenue (Million) Forecast, by Application 2019 & 2032
- Table 84: United States APAC Hydraulic Tools Market Volume (K Unit) Forecast, by Application 2019 & 2032
- Table 85: Canada APAC Hydraulic Tools Market Revenue (Million) Forecast, by Application 2019 & 2032
- Table 86: Canada APAC Hydraulic Tools Market Volume (K Unit) Forecast, by Application 2019 & 2032
- Table 87: Mexico APAC Hydraulic Tools Market Revenue (Million) Forecast, by Application 2019 & 2032
- Table 88: Mexico APAC Hydraulic Tools Market Volume (K Unit) Forecast, by Application 2019 & 2032
- Table 89: Global APAC Hydraulic Tools Market Revenue Million Forecast, by Country 2019 & 2032
- Table 90: Global APAC Hydraulic Tools Market Volume K Unit Forecast, by Country 2019 & 2032
- Table 91: United Arab Emirates APAC Hydraulic Tools Market Revenue (Million) Forecast, by Application 2019 & 2032
- Table 92: United Arab Emirates APAC Hydraulic Tools Market Volume (K Unit) Forecast, by Application 2019 & 2032
- Table 93: Saudi Arabia APAC Hydraulic Tools Market Revenue (Million) Forecast, by Application 2019 & 2032
- Table 94: Saudi Arabia APAC Hydraulic Tools Market Volume (K Unit) Forecast, by Application 2019 & 2032
- Table 95: South Africa APAC Hydraulic Tools Market Revenue (Million) Forecast, by Application 2019 & 2032
- Table 96: South Africa APAC Hydraulic Tools Market Volume (K Unit) Forecast, by Application 2019 & 2032
- Table 97: Rest of Middle East and Africa APAC Hydraulic Tools Market Revenue (Million) Forecast, by Application 2019 & 2032
- Table 98: Rest of Middle East and Africa APAC Hydraulic Tools Market Volume (K Unit) Forecast, by Application 2019 & 2032
- Table 99: Global APAC Hydraulic Tools Market Revenue Million Forecast, by Hydraulic Equipment Type 2019 & 2032
- Table 100: Global APAC Hydraulic Tools Market Volume K Unit Forecast, by Hydraulic Equipment Type 2019 & 2032
- Table 101: Global APAC Hydraulic Tools Market Revenue Million Forecast, by End-User Industry 2019 & 2032
- Table 102: Global APAC Hydraulic Tools Market Volume K Unit Forecast, by End-User Industry 2019 & 2032
- Table 103: Global APAC Hydraulic Tools Market Revenue Million Forecast, by Country 2019 & 2032
- Table 104: Global APAC Hydraulic Tools Market Volume K Unit Forecast, by Country 2019 & 2032
- Table 105: United States APAC Hydraulic Tools Market Revenue (Million) Forecast, by Application 2019 & 2032
- Table 106: United States APAC Hydraulic Tools Market Volume (K Unit) Forecast, by Application 2019 & 2032
- Table 107: Canada APAC Hydraulic Tools Market Revenue (Million) Forecast, by Application 2019 & 2032
- Table 108: Canada APAC Hydraulic Tools Market Volume (K Unit) Forecast, by Application 2019 & 2032
- Table 109: Mexico APAC Hydraulic Tools Market Revenue (Million) Forecast, by Application 2019 & 2032
- Table 110: Mexico APAC Hydraulic Tools Market Volume (K Unit) Forecast, by Application 2019 & 2032
- Table 111: Global APAC Hydraulic Tools Market Revenue Million Forecast, by Hydraulic Equipment Type 2019 & 2032
- Table 112: Global APAC Hydraulic Tools Market Volume K Unit Forecast, by Hydraulic Equipment Type 2019 & 2032
- Table 113: Global APAC Hydraulic Tools Market Revenue Million Forecast, by End-User Industry 2019 & 2032
- Table 114: Global APAC Hydraulic Tools Market Volume K Unit Forecast, by End-User Industry 2019 & 2032
- Table 115: Global APAC Hydraulic Tools Market Revenue Million Forecast, by Country 2019 & 2032
- Table 116: Global APAC Hydraulic Tools Market Volume K Unit Forecast, by Country 2019 & 2032
- Table 117: Brazil APAC Hydraulic Tools Market Revenue (Million) Forecast, by Application 2019 & 2032
- Table 118: Brazil APAC Hydraulic Tools Market Volume (K Unit) Forecast, by Application 2019 & 2032
- Table 119: Argentina APAC Hydraulic Tools Market Revenue (Million) Forecast, by Application 2019 & 2032
- Table 120: Argentina APAC Hydraulic Tools Market Volume (K Unit) Forecast, by Application 2019 & 2032
- Table 121: Rest of South America APAC Hydraulic Tools Market Revenue (Million) Forecast, by Application 2019 & 2032
- Table 122: Rest of South America APAC Hydraulic Tools Market Volume (K Unit) Forecast, by Application 2019 & 2032
- Table 123: Global APAC Hydraulic Tools Market Revenue Million Forecast, by Hydraulic Equipment Type 2019 & 2032
- Table 124: Global APAC Hydraulic Tools Market Volume K Unit Forecast, by Hydraulic Equipment Type 2019 & 2032
- Table 125: Global APAC Hydraulic Tools Market Revenue Million Forecast, by End-User Industry 2019 & 2032
- Table 126: Global APAC Hydraulic Tools Market Volume K Unit Forecast, by End-User Industry 2019 & 2032
- Table 127: Global APAC Hydraulic Tools Market Revenue Million Forecast, by Country 2019 & 2032
- Table 128: Global APAC Hydraulic Tools Market Volume K Unit Forecast, by Country 2019 & 2032
- Table 129: United Kingdom APAC Hydraulic Tools Market Revenue (Million) Forecast, by Application 2019 & 2032
- Table 130: United Kingdom APAC Hydraulic Tools Market Volume (K Unit) Forecast, by Application 2019 & 2032
- Table 131: Germany APAC Hydraulic Tools Market Revenue (Million) Forecast, by Application 2019 & 2032
- Table 132: Germany APAC Hydraulic Tools Market Volume (K Unit) Forecast, by Application 2019 & 2032
- Table 133: France APAC Hydraulic Tools Market Revenue (Million) Forecast, by Application 2019 & 2032
- Table 134: France APAC Hydraulic Tools Market Volume (K Unit) Forecast, by Application 2019 & 2032
- Table 135: Italy APAC Hydraulic Tools Market Revenue (Million) Forecast, by Application 2019 & 2032
- Table 136: Italy APAC Hydraulic Tools Market Volume (K Unit) Forecast, by Application 2019 & 2032
- Table 137: Spain APAC Hydraulic Tools Market Revenue (Million) Forecast, by Application 2019 & 2032
- Table 138: Spain APAC Hydraulic Tools Market Volume (K Unit) Forecast, by Application 2019 & 2032
- Table 139: Russia APAC Hydraulic Tools Market Revenue (Million) Forecast, by Application 2019 & 2032
- Table 140: Russia APAC Hydraulic Tools Market Volume (K Unit) Forecast, by Application 2019 & 2032
- Table 141: Benelux APAC Hydraulic Tools Market Revenue (Million) Forecast, by Application 2019 & 2032
- Table 142: Benelux APAC Hydraulic Tools Market Volume (K Unit) Forecast, by Application 2019 & 2032
- Table 143: Nordics APAC Hydraulic Tools Market Revenue (Million) Forecast, by Application 2019 & 2032
- Table 144: Nordics APAC Hydraulic Tools Market Volume (K Unit) Forecast, by Application 2019 & 2032
- Table 145: Rest of Europe APAC Hydraulic Tools Market Revenue (Million) Forecast, by Application 2019 & 2032
- Table 146: Rest of Europe APAC Hydraulic Tools Market Volume (K Unit) Forecast, by Application 2019 & 2032
- Table 147: Global APAC Hydraulic Tools Market Revenue Million Forecast, by Hydraulic Equipment Type 2019 & 2032
- Table 148: Global APAC Hydraulic Tools Market Volume K Unit Forecast, by Hydraulic Equipment Type 2019 & 2032
- Table 149: Global APAC Hydraulic Tools Market Revenue Million Forecast, by End-User Industry 2019 & 2032
- Table 150: Global APAC Hydraulic Tools Market Volume K Unit Forecast, by End-User Industry 2019 & 2032
- Table 151: Global APAC Hydraulic Tools Market Revenue Million Forecast, by Country 2019 & 2032
- Table 152: Global APAC Hydraulic Tools Market Volume K Unit Forecast, by Country 2019 & 2032
- Table 153: Turkey APAC Hydraulic Tools Market Revenue (Million) Forecast, by Application 2019 & 2032
- Table 154: Turkey APAC Hydraulic Tools Market Volume (K Unit) Forecast, by Application 2019 & 2032
- Table 155: Israel APAC Hydraulic Tools Market Revenue (Million) Forecast, by Application 2019 & 2032
- Table 156: Israel APAC Hydraulic Tools Market Volume (K Unit) Forecast, by Application 2019 & 2032
- Table 157: GCC APAC Hydraulic Tools Market Revenue (Million) Forecast, by Application 2019 & 2032
- Table 158: GCC APAC Hydraulic Tools Market Volume (K Unit) Forecast, by Application 2019 & 2032
- Table 159: North Africa APAC Hydraulic Tools Market Revenue (Million) Forecast, by Application 2019 & 2032
- Table 160: North Africa APAC Hydraulic Tools Market Volume (K Unit) Forecast, by Application 2019 & 2032
- Table 161: South Africa APAC Hydraulic Tools Market Revenue (Million) Forecast, by Application 2019 & 2032
- Table 162: South Africa APAC Hydraulic Tools Market Volume (K Unit) Forecast, by Application 2019 & 2032
- Table 163: Rest of Middle East & Africa APAC Hydraulic Tools Market Revenue (Million) Forecast, by Application 2019 & 2032
- Table 164: Rest of Middle East & Africa APAC Hydraulic Tools Market Volume (K Unit) Forecast, by Application 2019 & 2032
- Table 165: Global APAC Hydraulic Tools Market Revenue Million Forecast, by Hydraulic Equipment Type 2019 & 2032
- Table 166: Global APAC Hydraulic Tools Market Volume K Unit Forecast, by Hydraulic Equipment Type 2019 & 2032
- Table 167: Global APAC Hydraulic Tools Market Revenue Million Forecast, by End-User Industry 2019 & 2032
- Table 168: Global APAC Hydraulic Tools Market Volume K Unit Forecast, by End-User Industry 2019 & 2032
- Table 169: Global APAC Hydraulic Tools Market Revenue Million Forecast, by Country 2019 & 2032
- Table 170: Global APAC Hydraulic Tools Market Volume K Unit Forecast, by Country 2019 & 2032
- Table 171: China APAC Hydraulic Tools Market Revenue (Million) Forecast, by Application 2019 & 2032
- Table 172: China APAC Hydraulic Tools Market Volume (K Unit) Forecast, by Application 2019 & 2032
- Table 173: India APAC Hydraulic Tools Market Revenue (Million) Forecast, by Application 2019 & 2032
- Table 174: India APAC Hydraulic Tools Market Volume (K Unit) Forecast, by Application 2019 & 2032
- Table 175: Japan APAC Hydraulic Tools Market Revenue (Million) Forecast, by Application 2019 & 2032
- Table 176: Japan APAC Hydraulic Tools Market Volume (K Unit) Forecast, by Application 2019 & 2032
- Table 177: South Korea APAC Hydraulic Tools Market Revenue (Million) Forecast, by Application 2019 & 2032
- Table 178: South Korea APAC Hydraulic Tools Market Volume (K Unit) Forecast, by Application 2019 & 2032
- Table 179: ASEAN APAC Hydraulic Tools Market Revenue (Million) Forecast, by Application 2019 & 2032
- Table 180: ASEAN APAC Hydraulic Tools Market Volume (K Unit) Forecast, by Application 2019 & 2032
- Table 181: Oceania APAC Hydraulic Tools Market Revenue (Million) Forecast, by Application 2019 & 2032
- Table 182: Oceania APAC Hydraulic Tools Market Volume (K Unit) Forecast, by Application 2019 & 2032
- Table 183: Rest of Asia Pacific APAC Hydraulic Tools Market Revenue (Million) Forecast, by Application 2019 & 2032
- Table 184: Rest of Asia Pacific APAC Hydraulic Tools Market Volume (K Unit) Forecast, by Application 2019 & 2032
Frequently Asked Questions
1. What is the projected Compound Annual Growth Rate (CAGR) of the APAC Hydraulic Tools Market?
The projected CAGR is approximately 3.12%.
2. Which companies are prominent players in the APAC Hydraulic Tools Market?
Key companies in the market include KYB Corporation, Taiyuan Heavy Machinery GroupCo Ltd (Yuci Hydraulics, Daikin Industries Ltd, Mitsubishi Heavy Industries, Parker-Hannifin Corporation, Bosch Rexroth AG, Emerson Electric Co, Tata Hitachi Construction Machinery, Danfoss Power Solutions, Jiangsu Hengli Hydraulic Co Ltd, Kobelco Group, Kawasaki Heavy Industries Ltd, Shimadzu Corporation.
3. What are the main segments of the APAC Hydraulic Tools Market?
The market segments include Hydraulic Equipment Type, End-User Industry.
4. Can you provide details about the market size?
The market size is estimated to be USD XX Million as of 2022.
5. What are some drivers contributing to market growth?
; Increasing Demand For Material Handling Equipment; Increasing Demand From Construction Industry Via Government Initiatives And Investments.
6. What are the notable trends driving market growth?
Construction Sector Will Experience Significant Growth and Drive the Market.
7. Are there any restraints impacting market growth?
High Maintenance Cost Over the Entire Lifespan is Challenging the Market Growth.
8. Can you provide examples of recent developments in the market?
N/A
9. What pricing options are available for accessing the report?
Pricing options include single-user, multi-user, and enterprise licenses priced at USD 4750, USD 5250, and USD 8750 respectively.
10. Is the market size provided in terms of value or volume?
The market size is provided in terms of value, measured in Million and volume, measured in K Unit.
11. Are there any specific market keywords associated with the report?
Yes, the market keyword associated with the report is "APAC Hydraulic Tools Market," which aids in identifying and referencing the specific market segment covered.
12. How do I determine which pricing option suits my needs best?
The pricing options vary based on user requirements and access needs. Individual users may opt for single-user licenses, while businesses requiring broader access may choose multi-user or enterprise licenses for cost-effective access to the report.
13. Are there any additional resources or data provided in the APAC Hydraulic Tools Market report?
While the report offers comprehensive insights, it's advisable to review the specific contents or supplementary materials provided to ascertain if additional resources or data are available.
14. How can I stay updated on further developments or reports in the APAC Hydraulic Tools Market?
To stay informed about further developments, trends, and reports in the APAC Hydraulic Tools Market, consider subscribing to industry newsletters, following relevant companies and organizations, or regularly checking reputable industry news sources and publications.
Methodology
Step 1 - Identification of Relevant Samples Size from Population Database


Step 2 - Approaches for Defining Global Market Size (Value, Volume* & Price*)

Note*: In applicable scenarios
Step 3 - Data Sources
Primary Research
- Web Analytics
- Survey Reports
- Research Institute
- Latest Research Reports
- Opinion Leaders
Secondary Research
- Annual Reports
- White Paper
- Latest Press Release
- Industry Association
- Paid Database
- Investor Presentations

Step 4 - Data Triangulation
Involves using different sources of information in order to increase the validity of a study
These sources are likely to be stakeholders in a program - participants, other researchers, program staff, other community members, and so on.
Then we put all data in single framework & apply various statistical tools to find out the dynamic on the market.
During the analysis stage, feedback from the stakeholder groups would be compared to determine areas of agreement as well as areas of divergence


