
Key Insights
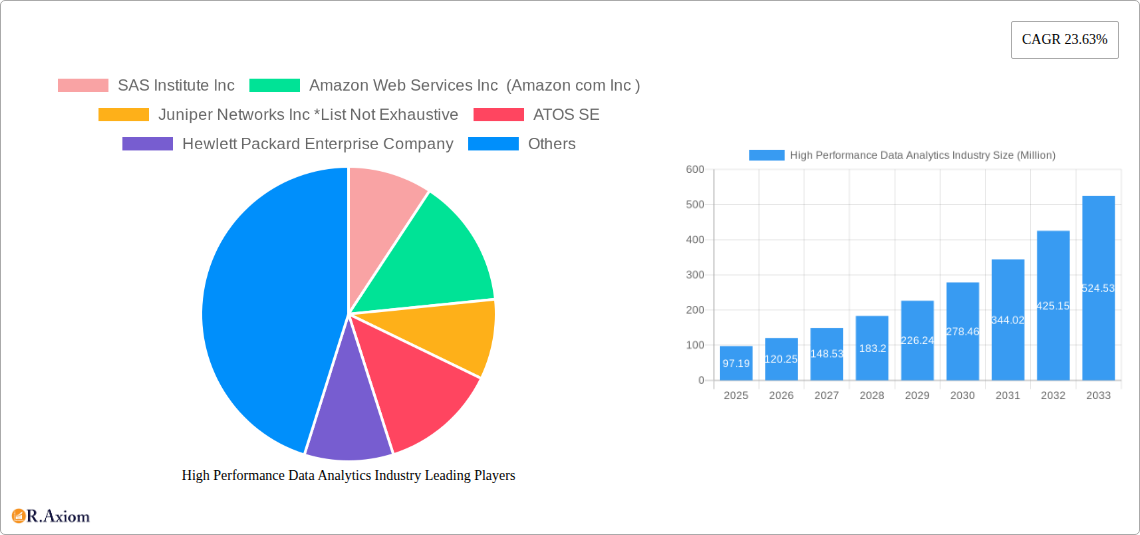
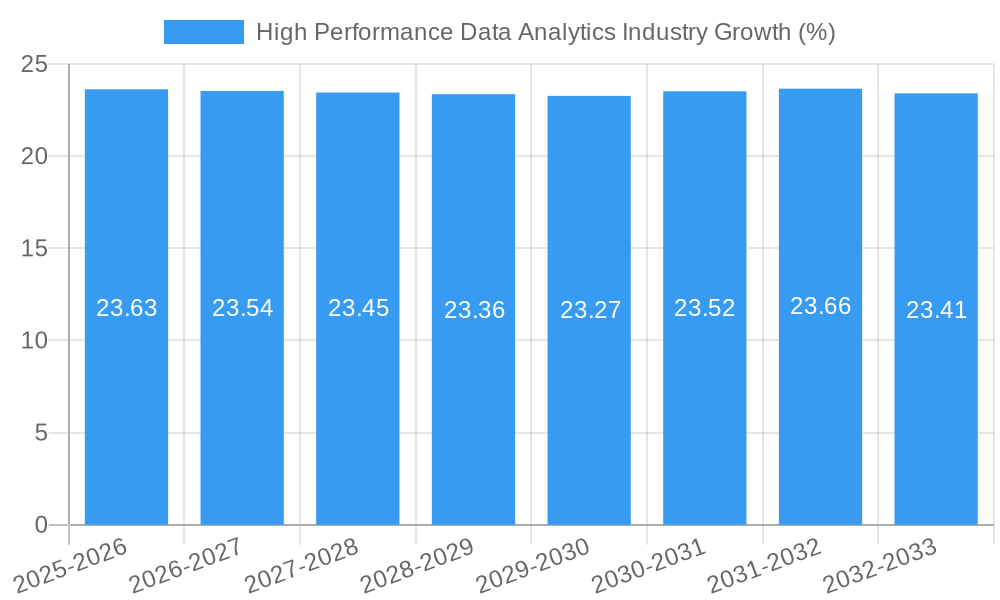
The High-Performance Data Analytics (HPDA) market is experiencing explosive growth, projected to reach \$97.19 million in 2025 and exhibiting a robust Compound Annual Growth Rate (CAGR) of 23.63%. This surge is driven by several key factors. The increasing volume and complexity of data generated across various industries necessitate sophisticated analytical tools capable of processing and interpreting information rapidly. Furthermore, the rising adoption of cloud-based solutions, particularly on-demand services, offers scalability and cost-effectiveness, fueling market expansion. Strong demand from large enterprises, particularly in the BFSI (Banking, Financial Services, and Insurance) and Government & Defense sectors, is significantly contributing to market growth. These sectors rely heavily on timely and accurate insights for strategic decision-making, risk management, and operational efficiency. The shift towards advanced analytics techniques, including machine learning and artificial intelligence, further propels the HPDA market.
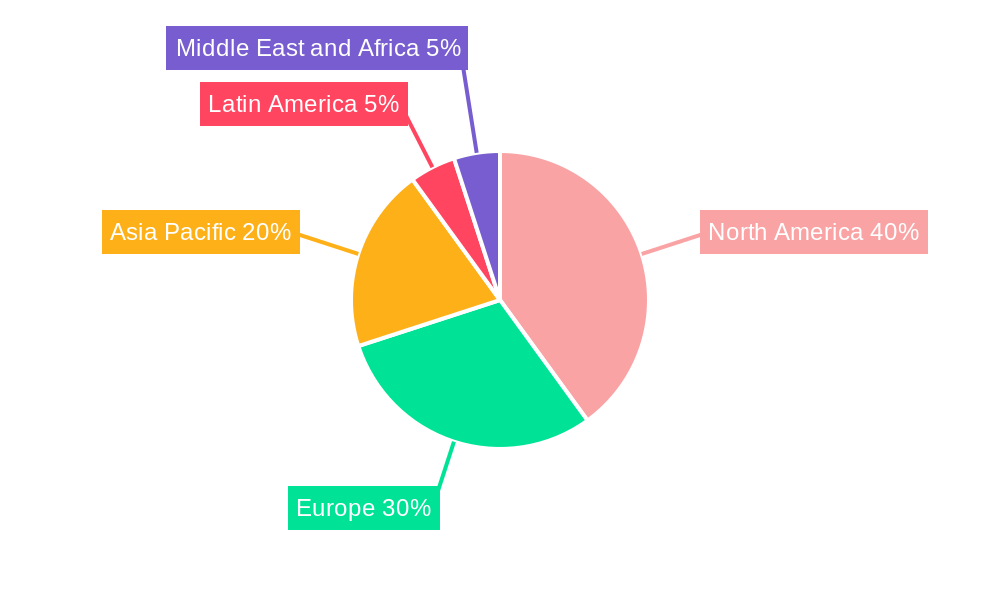
The market segmentation reveals diverse opportunities. While hardware components form a substantial portion of the market, the software and services segments are witnessing faster growth due to increasing demand for specialized analytical tools and expert support. The on-demand deployment model is gaining traction over on-premise solutions, driven by its flexibility and scalability. Geographically, North America and Europe currently hold significant market share, but the Asia-Pacific region is poised for rapid expansion, fueled by increasing digitalization and technological advancements in countries like China and India. Competition among key players, including SAS Institute, AWS, Juniper Networks, and others, is intensifying, driving innovation and fostering competitive pricing. Continued technological advancements, such as the development of faster processors and improved algorithms, will continue to shape the market landscape in the coming years. The market is expected to maintain its strong growth trajectory throughout the forecast period (2025-2033).
This comprehensive report provides a detailed analysis of the High Performance Data Analytics (HPDA) industry, offering invaluable insights for stakeholders, investors, and industry professionals. The report covers the period 2019-2033, with a focus on the forecast period 2025-2033 and a base year of 2025. The market is segmented by component (hardware, software, services), deployment (on-premise, on-demand), organization size (SMEs, large enterprises), and end-user industry (BFSI, government & defense, energy & utilities, retail & e-commerce, others). Key players analyzed include SAS Institute Inc, Amazon Web Services Inc (Amazon.com Inc), Juniper Networks Inc, ATOS SE, Hewlett Packard Enterprise Company, Google LLC (Alphabet Inc), Microsoft Corporation, Fujitsu Limited, IBM Corporation (Red Hat Inc), Oracle Corporation, Dell Technologies Inc, and Intel Corporation. The report projects a market value exceeding xx Million by 2033.
High Performance Data Analytics Industry Market Concentration & Innovation
The HPDA market exhibits a moderately concentrated landscape, with a few major players holding significant market share. While precise market share figures for each company require further proprietary analysis, preliminary estimations suggest that the top 5 players collectively control approximately xx% of the market, with the remaining share distributed among numerous smaller players and niche providers. Innovation is driven by advancements in processor technologies, cloud computing, AI/ML algorithms, and the growing demand for real-time analytics. Regulatory frameworks, particularly concerning data privacy and security (e.g., GDPR, CCPA), significantly influence market dynamics. Product substitutes, primarily traditional data analytics methods, are gradually being displaced as HPDA solutions offer superior speed and scalability. End-user trends show a preference for cloud-based deployments and integrated platforms. M&A activity has been moderate in recent years, with deal values averaging approximately xx Million per transaction. Examples include:
- Strategic acquisitions by major cloud providers to strengthen their data analytics offerings.
- Consolidation among smaller players to enhance capabilities and scale.
High Performance Data Analytics Industry Industry Trends & Insights
The HPDA market is experiencing robust growth, driven by several key factors. The compound annual growth rate (CAGR) during the forecast period (2025-2033) is estimated at xx%, reflecting the escalating demand for advanced data analytics across various sectors. Market penetration is increasing significantly, particularly in large enterprises and sectors like BFSI and government & defense, where the need for sophisticated analytics is paramount. Technological disruptions, such as the rise of edge computing and quantum computing, are poised to further accelerate market growth. Shifting consumer preferences towards faster, more insightful, and secure data analytics solutions are also influencing the industry trajectory. Competitive dynamics are shaped by innovation, pricing strategies, and partnerships. Companies are focusing on developing differentiated solutions and exploring innovative business models, such as subscription-based services and pay-as-you-go options.
Dominant Markets & Segments in High Performance Data Analytics Industry
The North American market currently holds the largest share of the global HPDA market, driven by factors including:
- High adoption of advanced technologies.
- Robust IT infrastructure.
- Significant investments in R&D.
By Component: Software currently dominates the market, fueled by the growing demand for sophisticated analytics tools and platforms. However, hardware is experiencing substantial growth, driven by the need for high-performance computing infrastructure. Services are a key segment, offering expertise in implementation, integration, and maintenance.
By Deployment: On-demand/cloud-based deployments are rapidly gaining traction, driven by their scalability, cost-effectiveness, and accessibility. On-premise deployments retain a significant market share, particularly among large enterprises with stringent security requirements.
By Organization Size: Large enterprises drive the market due to their higher budgets and complex data analytics needs. However, the SME segment is also witnessing increasing adoption, driven by cloud-based solutions and reduced entry barriers.
By End-user Industry: The BFSI sector is a dominant market segment due to its massive data volumes and the critical need for sophisticated risk management and fraud detection. Government & defense and energy & utilities sectors are also key growth drivers.
High Performance Data Analytics Industry Product Developments
Recent product developments focus on enhanced security features, streamlined user interfaces, and improved integration capabilities. Technological trends include the increasing adoption of AI/ML algorithms for advanced analytics, the development of specialized hardware for accelerating data processing, and the integration of cloud-based platforms for enhanced scalability and accessibility. Products are designed to address specific needs across different industries, offering competitive advantages by providing improved accuracy, speed, and cost-effectiveness.
Report Scope & Segmentation Analysis
This report comprehensively analyzes the HPDA market across various segments. Each segment provides distinct growth projections, market sizes, and competitive dynamics.
- By Component: Hardware, software, and services segments offer varying growth trajectories, influenced by technological advancements and market demand.
- By Deployment: On-premise and on-demand deployments represent distinct market segments with differing growth rates, driven by factors like security concerns and cost-efficiency.
- By Organization Size: Small and Medium Enterprises (SMEs) and Large Enterprises demonstrate different adoption rates and growth patterns, reflective of their differing resource capabilities and analytical needs.
- By End-user Industry: BFSI, Government & Defense, Energy & Utilities, Retail & E-commerce, and Other End-user Industries exhibit unique market dynamics and growth forecasts driven by industry-specific requirements and data characteristics.
Key Drivers of High Performance Data Analytics Industry Growth
Several factors drive the growth of the HPDA industry:
- Technological Advancements: Innovations in processor technology, cloud computing, and AI/ML are enhancing the capabilities of HPDA solutions.
- Increased Data Volumes: The exponential growth of data across various sectors necessitates advanced analytics capabilities.
- Demand for Real-time Insights: Businesses increasingly require real-time data analysis for informed decision-making.
- Government Initiatives: Government investments in digital infrastructure and data analytics are fueling market growth.
Challenges in the High Performance Data Analytics Industry Sector
The HPDA industry faces several challenges:
- High Implementation Costs: Implementing HPDA solutions can be expensive, especially for smaller organizations.
- Data Security Concerns: Protecting sensitive data is a major concern, requiring robust security measures.
- Skill Gap: A shortage of skilled professionals hinders the adoption and effective utilization of HPDA solutions.
- Integration Complexity: Integrating HPDA systems with existing IT infrastructure can be complex and time-consuming. These factors can potentially decrease the overall market penetration by an estimated xx% in the next five years if not addressed effectively.
Emerging Opportunities in High Performance Data Analytics Industry
The HPDA industry presents several emerging opportunities:
- Growth in Emerging Markets: Developing economies are increasingly adopting HPDA solutions, presenting significant growth potential.
- Advancements in AI/ML: The continued development of AI/ML algorithms unlocks new applications and possibilities for HPDA.
- Edge Computing: Edge computing enhances real-time analytics capabilities, opening up new applications in various sectors.
- Specialized Solutions: Tailored solutions for specific industry verticals are emerging, catering to unique data characteristics and needs.
Leading Players in the High Performance Data Analytics Industry Market
- SAS Institute Inc
- Amazon Web Services Inc (Amazon.com Inc)
- Juniper Networks Inc
- ATOS SE
- Hewlett Packard Enterprise Company
- Google LLC (Alphabet Inc)
- Microsoft Corporation
- Fujitsu Limited
- IBM Corporation (Red Hat Inc)
- Oracle Corporation
- Dell Technologies Inc
- Intel Corporation
Key Developments in High Performance Data Analytics Industry Industry
- May 2023: NeuroBlade partnered with Dell Technologies to accelerate data analytics, offering enhanced security and reliability.
- January 2023: Atos delivered a high-performance computing cluster to AVL List GmbH, enhancing simulation capabilities in the automotive industry.
Strategic Outlook for High Performance Data Analytics Industry Market
The HPDA market is poised for sustained growth, driven by technological innovation, increasing data volumes, and the growing demand for real-time insights. The market will continue to evolve with the emergence of new technologies and applications, creating substantial opportunities for players that can adapt and innovate. Focus on developing secure, user-friendly, and scalable solutions will be critical for success in this dynamic market. The projected market value surpasses xx Million by 2033, indicating a promising future for the HPDA industry.
High Performance Data Analytics Industry Segmentation
-
1. Component
- 1.1. Hardware
- 1.2. Software
- 1.3. Services
-
2. Deployment
- 2.1. On-Premise
- 2.2. On-Demand
-
3. Organization Size
- 3.1. Small and Medium Enterprises
- 3.2. Large Enterprises
-
4. End-user Industry
- 4.1. BFSI
- 4.2. Government & Defense
- 4.3. Energy & Utilities
- 4.4. Retail & E-Commerce
- 4.5. Other End-User Industry
High Performance Data Analytics Industry Segmentation By Geography
-
1. North America
- 1.1. United States
- 1.2. Canada
-
2. Europe
- 2.1. United Kingdom
- 2.2. Germany
- 2.3. France
-
3. Asia
- 3.1. China
- 3.2. India
- 3.3. Japan
-
4. Latin America
- 4.1. Mexico
- 4.2. Brazil
-
5. Middle East and Africa
- 5.1. United Arab Emirates
- 5.2. Saudi Arabia
High Performance Data Analytics Industry REPORT HIGHLIGHTS
| Aspects | Details |
|---|---|
| Study Period | 2019-2033 |
| Base Year | 2024 |
| Estimated Year | 2025 |
| Forecast Period | 2025-2033 |
| Historical Period | 2019-2024 |
| Growth Rate | CAGR of 23.63% from 2019-2033 |
| Segmentation |
|
Table of Contents
- 1. Introduction
- 1.1. Research Scope
- 1.2. Market Segmentation
- 1.3. Research Methodology
- 1.4. Definitions and Assumptions
- 2. Executive Summary
- 2.1. Introduction
- 3. Market Dynamics
- 3.1. Introduction
- 3.2. Market Drivers
- 3.2.1. Growing Number of IT & Database Industry Across the Globe; Growing Data Volumes; Advancements in High-Performance Computing Activities
- 3.3. Market Restrains
- 3.3.1. High Investment Cost; Stringent Government Regulations
- 3.4. Market Trends
- 3.4.1. On-Demand to Witness the Growth
- 4. Market Factor Analysis
- 4.1. Porters Five Forces
- 4.2. Supply/Value Chain
- 4.3. PESTEL analysis
- 4.4. Market Entropy
- 4.5. Patent/Trademark Analysis
- 5. Global High Performance Data Analytics Industry Analysis, Insights and Forecast, 2019-2031
- 5.1. Market Analysis, Insights and Forecast - by Component
- 5.1.1. Hardware
- 5.1.2. Software
- 5.1.3. Services
- 5.2. Market Analysis, Insights and Forecast - by Deployment
- 5.2.1. On-Premise
- 5.2.2. On-Demand
- 5.3. Market Analysis, Insights and Forecast - by Organization Size
- 5.3.1. Small and Medium Enterprises
- 5.3.2. Large Enterprises
- 5.4. Market Analysis, Insights and Forecast - by End-user Industry
- 5.4.1. BFSI
- 5.4.2. Government & Defense
- 5.4.3. Energy & Utilities
- 5.4.4. Retail & E-Commerce
- 5.4.5. Other End-User Industry
- 5.5. Market Analysis, Insights and Forecast - by Region
- 5.5.1. North America
- 5.5.2. Europe
- 5.5.3. Asia
- 5.5.4. Latin America
- 5.5.5. Middle East and Africa
- 5.1. Market Analysis, Insights and Forecast - by Component
- 6. North America High Performance Data Analytics Industry Analysis, Insights and Forecast, 2019-2031
- 6.1. Market Analysis, Insights and Forecast - by Component
- 6.1.1. Hardware
- 6.1.2. Software
- 6.1.3. Services
- 6.2. Market Analysis, Insights and Forecast - by Deployment
- 6.2.1. On-Premise
- 6.2.2. On-Demand
- 6.3. Market Analysis, Insights and Forecast - by Organization Size
- 6.3.1. Small and Medium Enterprises
- 6.3.2. Large Enterprises
- 6.4. Market Analysis, Insights and Forecast - by End-user Industry
- 6.4.1. BFSI
- 6.4.2. Government & Defense
- 6.4.3. Energy & Utilities
- 6.4.4. Retail & E-Commerce
- 6.4.5. Other End-User Industry
- 6.1. Market Analysis, Insights and Forecast - by Component
- 7. Europe High Performance Data Analytics Industry Analysis, Insights and Forecast, 2019-2031
- 7.1. Market Analysis, Insights and Forecast - by Component
- 7.1.1. Hardware
- 7.1.2. Software
- 7.1.3. Services
- 7.2. Market Analysis, Insights and Forecast - by Deployment
- 7.2.1. On-Premise
- 7.2.2. On-Demand
- 7.3. Market Analysis, Insights and Forecast - by Organization Size
- 7.3.1. Small and Medium Enterprises
- 7.3.2. Large Enterprises
- 7.4. Market Analysis, Insights and Forecast - by End-user Industry
- 7.4.1. BFSI
- 7.4.2. Government & Defense
- 7.4.3. Energy & Utilities
- 7.4.4. Retail & E-Commerce
- 7.4.5. Other End-User Industry
- 7.1. Market Analysis, Insights and Forecast - by Component
- 8. Asia High Performance Data Analytics Industry Analysis, Insights and Forecast, 2019-2031
- 8.1. Market Analysis, Insights and Forecast - by Component
- 8.1.1. Hardware
- 8.1.2. Software
- 8.1.3. Services
- 8.2. Market Analysis, Insights and Forecast - by Deployment
- 8.2.1. On-Premise
- 8.2.2. On-Demand
- 8.3. Market Analysis, Insights and Forecast - by Organization Size
- 8.3.1. Small and Medium Enterprises
- 8.3.2. Large Enterprises
- 8.4. Market Analysis, Insights and Forecast - by End-user Industry
- 8.4.1. BFSI
- 8.4.2. Government & Defense
- 8.4.3. Energy & Utilities
- 8.4.4. Retail & E-Commerce
- 8.4.5. Other End-User Industry
- 8.1. Market Analysis, Insights and Forecast - by Component
- 9. Latin America High Performance Data Analytics Industry Analysis, Insights and Forecast, 2019-2031
- 9.1. Market Analysis, Insights and Forecast - by Component
- 9.1.1. Hardware
- 9.1.2. Software
- 9.1.3. Services
- 9.2. Market Analysis, Insights and Forecast - by Deployment
- 9.2.1. On-Premise
- 9.2.2. On-Demand
- 9.3. Market Analysis, Insights and Forecast - by Organization Size
- 9.3.1. Small and Medium Enterprises
- 9.3.2. Large Enterprises
- 9.4. Market Analysis, Insights and Forecast - by End-user Industry
- 9.4.1. BFSI
- 9.4.2. Government & Defense
- 9.4.3. Energy & Utilities
- 9.4.4. Retail & E-Commerce
- 9.4.5. Other End-User Industry
- 9.1. Market Analysis, Insights and Forecast - by Component
- 10. Middle East and Africa High Performance Data Analytics Industry Analysis, Insights and Forecast, 2019-2031
- 10.1. Market Analysis, Insights and Forecast - by Component
- 10.1.1. Hardware
- 10.1.2. Software
- 10.1.3. Services
- 10.2. Market Analysis, Insights and Forecast - by Deployment
- 10.2.1. On-Premise
- 10.2.2. On-Demand
- 10.3. Market Analysis, Insights and Forecast - by Organization Size
- 10.3.1. Small and Medium Enterprises
- 10.3.2. Large Enterprises
- 10.4. Market Analysis, Insights and Forecast - by End-user Industry
- 10.4.1. BFSI
- 10.4.2. Government & Defense
- 10.4.3. Energy & Utilities
- 10.4.4. Retail & E-Commerce
- 10.4.5. Other End-User Industry
- 10.1. Market Analysis, Insights and Forecast - by Component
- 11. North America High Performance Data Analytics Industry Analysis, Insights and Forecast, 2019-2031
- 11.1. Market Analysis, Insights and Forecast - By Country/Sub-region
- 11.1.1 United States
- 11.1.2 Canada
- 12. Europe High Performance Data Analytics Industry Analysis, Insights and Forecast, 2019-2031
- 12.1. Market Analysis, Insights and Forecast - By Country/Sub-region
- 12.1.1 United Kingdom
- 12.1.2 Germany
- 12.1.3 France
- 12.1.4 Rest of Europe
- 13. Asia Pacific High Performance Data Analytics Industry Analysis, Insights and Forecast, 2019-2031
- 13.1. Market Analysis, Insights and Forecast - By Country/Sub-region
- 13.1.1 China
- 13.1.2 India
- 13.1.3 Japan
- 13.1.4 Rest of Asia Pacific
- 14. Latin America High Performance Data Analytics Industry Analysis, Insights and Forecast, 2019-2031
- 14.1. Market Analysis, Insights and Forecast - By Country/Sub-region
- 14.1.1 Mexico
- 14.1.2 Brazil
- 14.1.3 Rest of Latin America
- 15. Middle East and Africa High Performance Data Analytics Industry Analysis, Insights and Forecast, 2019-2031
- 15.1. Market Analysis, Insights and Forecast - By Country/Sub-region
- 15.1.1 United Arab Emirates
- 15.1.2 Saudi Arabia
- 15.1.3 Rest of Middle East and Africa
- 16. Competitive Analysis
- 16.1. Global Market Share Analysis 2024
- 16.2. Company Profiles
- 16.2.1 SAS Institute Inc
- 16.2.1.1. Overview
- 16.2.1.2. Products
- 16.2.1.3. SWOT Analysis
- 16.2.1.4. Recent Developments
- 16.2.1.5. Financials (Based on Availability)
- 16.2.2 Amazon Web Services Inc (Amazon com Inc )
- 16.2.2.1. Overview
- 16.2.2.2. Products
- 16.2.2.3. SWOT Analysis
- 16.2.2.4. Recent Developments
- 16.2.2.5. Financials (Based on Availability)
- 16.2.3 Juniper Networks Inc *List Not Exhaustive
- 16.2.3.1. Overview
- 16.2.3.2. Products
- 16.2.3.3. SWOT Analysis
- 16.2.3.4. Recent Developments
- 16.2.3.5. Financials (Based on Availability)
- 16.2.4 ATOS SE
- 16.2.4.1. Overview
- 16.2.4.2. Products
- 16.2.4.3. SWOT Analysis
- 16.2.4.4. Recent Developments
- 16.2.4.5. Financials (Based on Availability)
- 16.2.5 Hewlett Packard Enterprise Company
- 16.2.5.1. Overview
- 16.2.5.2. Products
- 16.2.5.3. SWOT Analysis
- 16.2.5.4. Recent Developments
- 16.2.5.5. Financials (Based on Availability)
- 16.2.6 Google LLC (Alphabet Inc )
- 16.2.6.1. Overview
- 16.2.6.2. Products
- 16.2.6.3. SWOT Analysis
- 16.2.6.4. Recent Developments
- 16.2.6.5. Financials (Based on Availability)
- 16.2.7 Microsoft Corporation
- 16.2.7.1. Overview
- 16.2.7.2. Products
- 16.2.7.3. SWOT Analysis
- 16.2.7.4. Recent Developments
- 16.2.7.5. Financials (Based on Availability)
- 16.2.8 Fujitsu Limited
- 16.2.8.1. Overview
- 16.2.8.2. Products
- 16.2.8.3. SWOT Analysis
- 16.2.8.4. Recent Developments
- 16.2.8.5. Financials (Based on Availability)
- 16.2.9 IBM Corporation (Red Hat Inc )
- 16.2.9.1. Overview
- 16.2.9.2. Products
- 16.2.9.3. SWOT Analysis
- 16.2.9.4. Recent Developments
- 16.2.9.5. Financials (Based on Availability)
- 16.2.10 Oracle Corporation
- 16.2.10.1. Overview
- 16.2.10.2. Products
- 16.2.10.3. SWOT Analysis
- 16.2.10.4. Recent Developments
- 16.2.10.5. Financials (Based on Availability)
- 16.2.11 Dell Technologies Inc
- 16.2.11.1. Overview
- 16.2.11.2. Products
- 16.2.11.3. SWOT Analysis
- 16.2.11.4. Recent Developments
- 16.2.11.5. Financials (Based on Availability)
- 16.2.12 Intel Corporation
- 16.2.12.1. Overview
- 16.2.12.2. Products
- 16.2.12.3. SWOT Analysis
- 16.2.12.4. Recent Developments
- 16.2.12.5. Financials (Based on Availability)
- 16.2.1 SAS Institute Inc
List of Figures
- Figure 1: Global High Performance Data Analytics Industry Revenue Breakdown (Million, %) by Region 2024 & 2032
- Figure 2: North America High Performance Data Analytics Industry Revenue (Million), by Country 2024 & 2032
- Figure 3: North America High Performance Data Analytics Industry Revenue Share (%), by Country 2024 & 2032
- Figure 4: Europe High Performance Data Analytics Industry Revenue (Million), by Country 2024 & 2032
- Figure 5: Europe High Performance Data Analytics Industry Revenue Share (%), by Country 2024 & 2032
- Figure 6: Asia Pacific High Performance Data Analytics Industry Revenue (Million), by Country 2024 & 2032
- Figure 7: Asia Pacific High Performance Data Analytics Industry Revenue Share (%), by Country 2024 & 2032
- Figure 8: Latin America High Performance Data Analytics Industry Revenue (Million), by Country 2024 & 2032
- Figure 9: Latin America High Performance Data Analytics Industry Revenue Share (%), by Country 2024 & 2032
- Figure 10: Middle East and Africa High Performance Data Analytics Industry Revenue (Million), by Country 2024 & 2032
- Figure 11: Middle East and Africa High Performance Data Analytics Industry Revenue Share (%), by Country 2024 & 2032
- Figure 12: North America High Performance Data Analytics Industry Revenue (Million), by Component 2024 & 2032
- Figure 13: North America High Performance Data Analytics Industry Revenue Share (%), by Component 2024 & 2032
- Figure 14: North America High Performance Data Analytics Industry Revenue (Million), by Deployment 2024 & 2032
- Figure 15: North America High Performance Data Analytics Industry Revenue Share (%), by Deployment 2024 & 2032
- Figure 16: North America High Performance Data Analytics Industry Revenue (Million), by Organization Size 2024 & 2032
- Figure 17: North America High Performance Data Analytics Industry Revenue Share (%), by Organization Size 2024 & 2032
- Figure 18: North America High Performance Data Analytics Industry Revenue (Million), by End-user Industry 2024 & 2032
- Figure 19: North America High Performance Data Analytics Industry Revenue Share (%), by End-user Industry 2024 & 2032
- Figure 20: North America High Performance Data Analytics Industry Revenue (Million), by Country 2024 & 2032
- Figure 21: North America High Performance Data Analytics Industry Revenue Share (%), by Country 2024 & 2032
- Figure 22: Europe High Performance Data Analytics Industry Revenue (Million), by Component 2024 & 2032
- Figure 23: Europe High Performance Data Analytics Industry Revenue Share (%), by Component 2024 & 2032
- Figure 24: Europe High Performance Data Analytics Industry Revenue (Million), by Deployment 2024 & 2032
- Figure 25: Europe High Performance Data Analytics Industry Revenue Share (%), by Deployment 2024 & 2032
- Figure 26: Europe High Performance Data Analytics Industry Revenue (Million), by Organization Size 2024 & 2032
- Figure 27: Europe High Performance Data Analytics Industry Revenue Share (%), by Organization Size 2024 & 2032
- Figure 28: Europe High Performance Data Analytics Industry Revenue (Million), by End-user Industry 2024 & 2032
- Figure 29: Europe High Performance Data Analytics Industry Revenue Share (%), by End-user Industry 2024 & 2032
- Figure 30: Europe High Performance Data Analytics Industry Revenue (Million), by Country 2024 & 2032
- Figure 31: Europe High Performance Data Analytics Industry Revenue Share (%), by Country 2024 & 2032
- Figure 32: Asia High Performance Data Analytics Industry Revenue (Million), by Component 2024 & 2032
- Figure 33: Asia High Performance Data Analytics Industry Revenue Share (%), by Component 2024 & 2032
- Figure 34: Asia High Performance Data Analytics Industry Revenue (Million), by Deployment 2024 & 2032
- Figure 35: Asia High Performance Data Analytics Industry Revenue Share (%), by Deployment 2024 & 2032
- Figure 36: Asia High Performance Data Analytics Industry Revenue (Million), by Organization Size 2024 & 2032
- Figure 37: Asia High Performance Data Analytics Industry Revenue Share (%), by Organization Size 2024 & 2032
- Figure 38: Asia High Performance Data Analytics Industry Revenue (Million), by End-user Industry 2024 & 2032
- Figure 39: Asia High Performance Data Analytics Industry Revenue Share (%), by End-user Industry 2024 & 2032
- Figure 40: Asia High Performance Data Analytics Industry Revenue (Million), by Country 2024 & 2032
- Figure 41: Asia High Performance Data Analytics Industry Revenue Share (%), by Country 2024 & 2032
- Figure 42: Latin America High Performance Data Analytics Industry Revenue (Million), by Component 2024 & 2032
- Figure 43: Latin America High Performance Data Analytics Industry Revenue Share (%), by Component 2024 & 2032
- Figure 44: Latin America High Performance Data Analytics Industry Revenue (Million), by Deployment 2024 & 2032
- Figure 45: Latin America High Performance Data Analytics Industry Revenue Share (%), by Deployment 2024 & 2032
- Figure 46: Latin America High Performance Data Analytics Industry Revenue (Million), by Organization Size 2024 & 2032
- Figure 47: Latin America High Performance Data Analytics Industry Revenue Share (%), by Organization Size 2024 & 2032
- Figure 48: Latin America High Performance Data Analytics Industry Revenue (Million), by End-user Industry 2024 & 2032
- Figure 49: Latin America High Performance Data Analytics Industry Revenue Share (%), by End-user Industry 2024 & 2032
- Figure 50: Latin America High Performance Data Analytics Industry Revenue (Million), by Country 2024 & 2032
- Figure 51: Latin America High Performance Data Analytics Industry Revenue Share (%), by Country 2024 & 2032
- Figure 52: Middle East and Africa High Performance Data Analytics Industry Revenue (Million), by Component 2024 & 2032
- Figure 53: Middle East and Africa High Performance Data Analytics Industry Revenue Share (%), by Component 2024 & 2032
- Figure 54: Middle East and Africa High Performance Data Analytics Industry Revenue (Million), by Deployment 2024 & 2032
- Figure 55: Middle East and Africa High Performance Data Analytics Industry Revenue Share (%), by Deployment 2024 & 2032
- Figure 56: Middle East and Africa High Performance Data Analytics Industry Revenue (Million), by Organization Size 2024 & 2032
- Figure 57: Middle East and Africa High Performance Data Analytics Industry Revenue Share (%), by Organization Size 2024 & 2032
- Figure 58: Middle East and Africa High Performance Data Analytics Industry Revenue (Million), by End-user Industry 2024 & 2032
- Figure 59: Middle East and Africa High Performance Data Analytics Industry Revenue Share (%), by End-user Industry 2024 & 2032
- Figure 60: Middle East and Africa High Performance Data Analytics Industry Revenue (Million), by Country 2024 & 2032
- Figure 61: Middle East and Africa High Performance Data Analytics Industry Revenue Share (%), by Country 2024 & 2032
List of Tables
- Table 1: Global High Performance Data Analytics Industry Revenue Million Forecast, by Region 2019 & 2032
- Table 2: Global High Performance Data Analytics Industry Revenue Million Forecast, by Component 2019 & 2032
- Table 3: Global High Performance Data Analytics Industry Revenue Million Forecast, by Deployment 2019 & 2032
- Table 4: Global High Performance Data Analytics Industry Revenue Million Forecast, by Organization Size 2019 & 2032
- Table 5: Global High Performance Data Analytics Industry Revenue Million Forecast, by End-user Industry 2019 & 2032
- Table 6: Global High Performance Data Analytics Industry Revenue Million Forecast, by Region 2019 & 2032
- Table 7: Global High Performance Data Analytics Industry Revenue Million Forecast, by Country 2019 & 2032
- Table 8: United States High Performance Data Analytics Industry Revenue (Million) Forecast, by Application 2019 & 2032
- Table 9: Canada High Performance Data Analytics Industry Revenue (Million) Forecast, by Application 2019 & 2032
- Table 10: Global High Performance Data Analytics Industry Revenue Million Forecast, by Country 2019 & 2032
- Table 11: United Kingdom High Performance Data Analytics Industry Revenue (Million) Forecast, by Application 2019 & 2032
- Table 12: Germany High Performance Data Analytics Industry Revenue (Million) Forecast, by Application 2019 & 2032
- Table 13: France High Performance Data Analytics Industry Revenue (Million) Forecast, by Application 2019 & 2032
- Table 14: Rest of Europe High Performance Data Analytics Industry Revenue (Million) Forecast, by Application 2019 & 2032
- Table 15: Global High Performance Data Analytics Industry Revenue Million Forecast, by Country 2019 & 2032
- Table 16: China High Performance Data Analytics Industry Revenue (Million) Forecast, by Application 2019 & 2032
- Table 17: India High Performance Data Analytics Industry Revenue (Million) Forecast, by Application 2019 & 2032
- Table 18: Japan High Performance Data Analytics Industry Revenue (Million) Forecast, by Application 2019 & 2032
- Table 19: Rest of Asia Pacific High Performance Data Analytics Industry Revenue (Million) Forecast, by Application 2019 & 2032
- Table 20: Global High Performance Data Analytics Industry Revenue Million Forecast, by Country 2019 & 2032
- Table 21: Mexico High Performance Data Analytics Industry Revenue (Million) Forecast, by Application 2019 & 2032
- Table 22: Brazil High Performance Data Analytics Industry Revenue (Million) Forecast, by Application 2019 & 2032
- Table 23: Rest of Latin America High Performance Data Analytics Industry Revenue (Million) Forecast, by Application 2019 & 2032
- Table 24: Global High Performance Data Analytics Industry Revenue Million Forecast, by Country 2019 & 2032
- Table 25: United Arab Emirates High Performance Data Analytics Industry Revenue (Million) Forecast, by Application 2019 & 2032
- Table 26: Saudi Arabia High Performance Data Analytics Industry Revenue (Million) Forecast, by Application 2019 & 2032
- Table 27: Rest of Middle East and Africa High Performance Data Analytics Industry Revenue (Million) Forecast, by Application 2019 & 2032
- Table 28: Global High Performance Data Analytics Industry Revenue Million Forecast, by Component 2019 & 2032
- Table 29: Global High Performance Data Analytics Industry Revenue Million Forecast, by Deployment 2019 & 2032
- Table 30: Global High Performance Data Analytics Industry Revenue Million Forecast, by Organization Size 2019 & 2032
- Table 31: Global High Performance Data Analytics Industry Revenue Million Forecast, by End-user Industry 2019 & 2032
- Table 32: Global High Performance Data Analytics Industry Revenue Million Forecast, by Country 2019 & 2032
- Table 33: United States High Performance Data Analytics Industry Revenue (Million) Forecast, by Application 2019 & 2032
- Table 34: Canada High Performance Data Analytics Industry Revenue (Million) Forecast, by Application 2019 & 2032
- Table 35: Global High Performance Data Analytics Industry Revenue Million Forecast, by Component 2019 & 2032
- Table 36: Global High Performance Data Analytics Industry Revenue Million Forecast, by Deployment 2019 & 2032
- Table 37: Global High Performance Data Analytics Industry Revenue Million Forecast, by Organization Size 2019 & 2032
- Table 38: Global High Performance Data Analytics Industry Revenue Million Forecast, by End-user Industry 2019 & 2032
- Table 39: Global High Performance Data Analytics Industry Revenue Million Forecast, by Country 2019 & 2032
- Table 40: United Kingdom High Performance Data Analytics Industry Revenue (Million) Forecast, by Application 2019 & 2032
- Table 41: Germany High Performance Data Analytics Industry Revenue (Million) Forecast, by Application 2019 & 2032
- Table 42: France High Performance Data Analytics Industry Revenue (Million) Forecast, by Application 2019 & 2032
- Table 43: Global High Performance Data Analytics Industry Revenue Million Forecast, by Component 2019 & 2032
- Table 44: Global High Performance Data Analytics Industry Revenue Million Forecast, by Deployment 2019 & 2032
- Table 45: Global High Performance Data Analytics Industry Revenue Million Forecast, by Organization Size 2019 & 2032
- Table 46: Global High Performance Data Analytics Industry Revenue Million Forecast, by End-user Industry 2019 & 2032
- Table 47: Global High Performance Data Analytics Industry Revenue Million Forecast, by Country 2019 & 2032
- Table 48: China High Performance Data Analytics Industry Revenue (Million) Forecast, by Application 2019 & 2032
- Table 49: India High Performance Data Analytics Industry Revenue (Million) Forecast, by Application 2019 & 2032
- Table 50: Japan High Performance Data Analytics Industry Revenue (Million) Forecast, by Application 2019 & 2032
- Table 51: Global High Performance Data Analytics Industry Revenue Million Forecast, by Component 2019 & 2032
- Table 52: Global High Performance Data Analytics Industry Revenue Million Forecast, by Deployment 2019 & 2032
- Table 53: Global High Performance Data Analytics Industry Revenue Million Forecast, by Organization Size 2019 & 2032
- Table 54: Global High Performance Data Analytics Industry Revenue Million Forecast, by End-user Industry 2019 & 2032
- Table 55: Global High Performance Data Analytics Industry Revenue Million Forecast, by Country 2019 & 2032
- Table 56: Mexico High Performance Data Analytics Industry Revenue (Million) Forecast, by Application 2019 & 2032
- Table 57: Brazil High Performance Data Analytics Industry Revenue (Million) Forecast, by Application 2019 & 2032
- Table 58: Global High Performance Data Analytics Industry Revenue Million Forecast, by Component 2019 & 2032
- Table 59: Global High Performance Data Analytics Industry Revenue Million Forecast, by Deployment 2019 & 2032
- Table 60: Global High Performance Data Analytics Industry Revenue Million Forecast, by Organization Size 2019 & 2032
- Table 61: Global High Performance Data Analytics Industry Revenue Million Forecast, by End-user Industry 2019 & 2032
- Table 62: Global High Performance Data Analytics Industry Revenue Million Forecast, by Country 2019 & 2032
- Table 63: United Arab Emirates High Performance Data Analytics Industry Revenue (Million) Forecast, by Application 2019 & 2032
- Table 64: Saudi Arabia High Performance Data Analytics Industry Revenue (Million) Forecast, by Application 2019 & 2032
Frequently Asked Questions
1. What is the projected Compound Annual Growth Rate (CAGR) of the High Performance Data Analytics Industry?
The projected CAGR is approximately 23.63%.
2. Which companies are prominent players in the High Performance Data Analytics Industry?
Key companies in the market include SAS Institute Inc, Amazon Web Services Inc (Amazon com Inc ), Juniper Networks Inc *List Not Exhaustive, ATOS SE, Hewlett Packard Enterprise Company, Google LLC (Alphabet Inc ), Microsoft Corporation, Fujitsu Limited, IBM Corporation (Red Hat Inc ), Oracle Corporation, Dell Technologies Inc, Intel Corporation.
3. What are the main segments of the High Performance Data Analytics Industry?
The market segments include Component, Deployment, Organization Size, End-user Industry.
4. Can you provide details about the market size?
The market size is estimated to be USD 97.19 Million as of 2022.
5. What are some drivers contributing to market growth?
Growing Number of IT & Database Industry Across the Globe; Growing Data Volumes; Advancements in High-Performance Computing Activities.
6. What are the notable trends driving market growth?
On-Demand to Witness the Growth.
7. Are there any restraints impacting market growth?
High Investment Cost; Stringent Government Regulations.
8. Can you provide examples of recent developments in the market?
May 2023: NeuroBlade announced its partnership with Dell Technologies to accelerate data analytics. This solution will offer customers security and reliability, coupled with the industry's first processor architecture proven to accelerate high throughput data analytics workloads. Through the partnership, NeuroBlade strengthen its market strategy and reinforces demand for advanced solutions.
9. What pricing options are available for accessing the report?
Pricing options include single-user, multi-user, and enterprise licenses priced at USD 4750, USD 5250, and USD 8750 respectively.
10. Is the market size provided in terms of value or volume?
The market size is provided in terms of value, measured in Million.
11. Are there any specific market keywords associated with the report?
Yes, the market keyword associated with the report is "High Performance Data Analytics Industry," which aids in identifying and referencing the specific market segment covered.
12. How do I determine which pricing option suits my needs best?
The pricing options vary based on user requirements and access needs. Individual users may opt for single-user licenses, while businesses requiring broader access may choose multi-user or enterprise licenses for cost-effective access to the report.
13. Are there any additional resources or data provided in the High Performance Data Analytics Industry report?
While the report offers comprehensive insights, it's advisable to review the specific contents or supplementary materials provided to ascertain if additional resources or data are available.
14. How can I stay updated on further developments or reports in the High Performance Data Analytics Industry?
To stay informed about further developments, trends, and reports in the High Performance Data Analytics Industry, consider subscribing to industry newsletters, following relevant companies and organizations, or regularly checking reputable industry news sources and publications.
Methodology
Step 1 - Identification of Relevant Samples Size from Population Database


Step 2 - Approaches for Defining Global Market Size (Value, Volume* & Price*)

Note*: In applicable scenarios
Step 3 - Data Sources
Primary Research
- Web Analytics
- Survey Reports
- Research Institute
- Latest Research Reports
- Opinion Leaders
Secondary Research
- Annual Reports
- White Paper
- Latest Press Release
- Industry Association
- Paid Database
- Investor Presentations

Step 4 - Data Triangulation
Involves using different sources of information in order to increase the validity of a study
These sources are likely to be stakeholders in a program - participants, other researchers, program staff, other community members, and so on.
Then we put all data in single framework & apply various statistical tools to find out the dynamic on the market.
During the analysis stage, feedback from the stakeholder groups would be compared to determine areas of agreement as well as areas of divergence


