

Key Insights
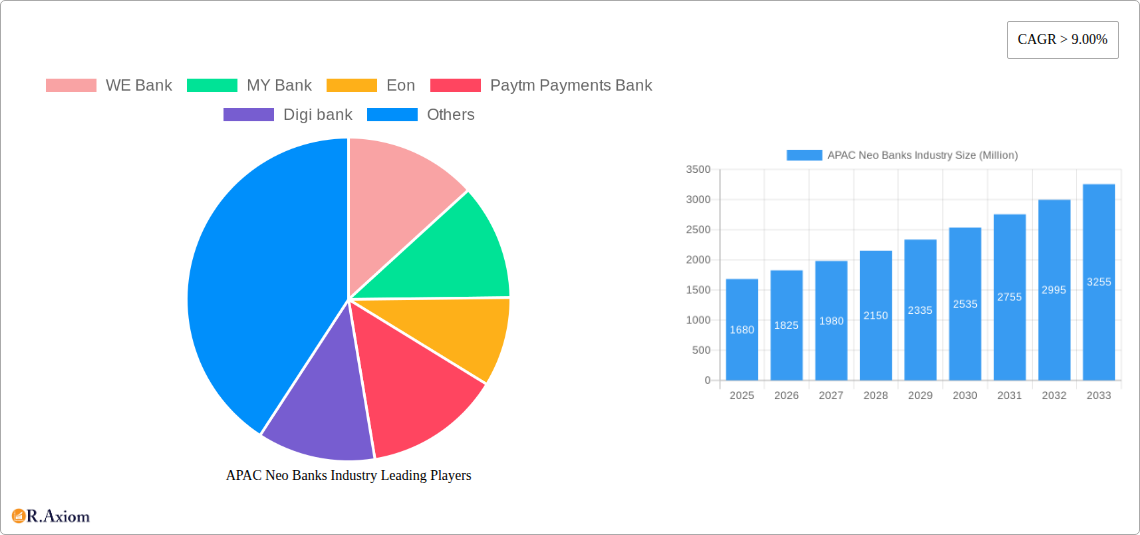
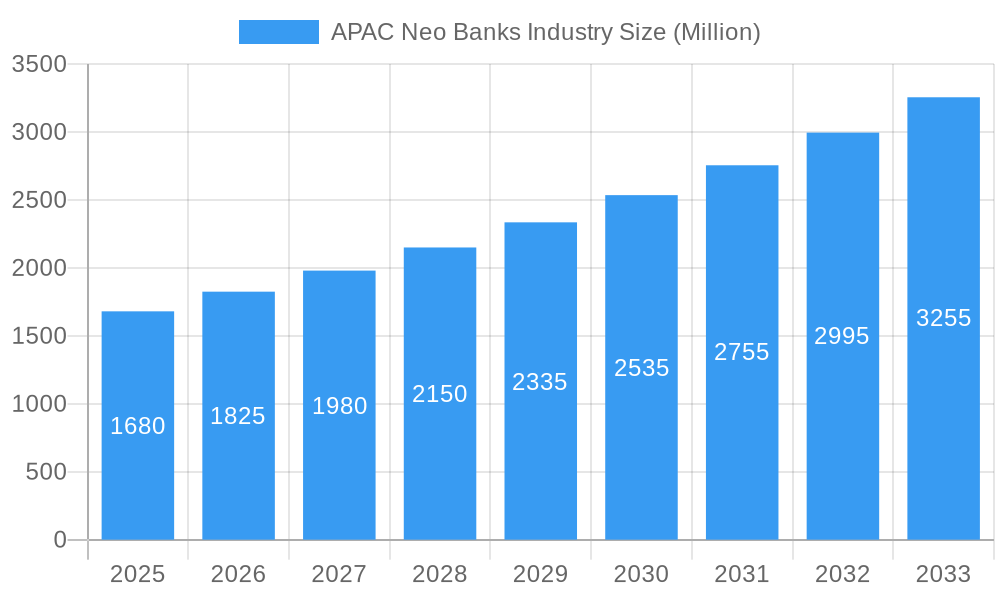
The APAC Neo Banks Industry is poised for substantial expansion, with a current market size of $1.68 Billion. Projections indicate a Compound Annual Growth Rate (CAGR) exceeding 9.00%, signifying robust and sustained expansion over the forecast period of 2025-2033. This growth is primarily fueled by several key drivers. The increasing adoption of digital banking services, driven by a young, tech-savvy population across Asia Pacific, coupled with rising smartphone penetration and affordable internet access, creates a fertile ground for neo-banks. Furthermore, a growing demand for convenient, accessible, and personalized financial solutions, particularly from the unbanked and underbanked segments, is a significant growth catalyst. The proliferation of fintech innovation and supportive regulatory environments in several key APAC markets are also contributing to this positive trajectory.
APAC Neo Banks Industry Market Size (In Billion)
The market is segmented by Service Type, with Payments, Savings Products, and Consumer Credit anticipated to be the dominant revenue generators, reflecting evolving consumer financial behaviors. The Business Segment, especially for SMEs, and the Personal Segment, are expected to drive end-user adoption. Emerging trends include the integration of Artificial Intelligence for enhanced customer experience, the rise of embedded finance, and the development of specialized neo-banking solutions catering to specific niches like freelancers or gig economy workers. While the outlook is overwhelmingly positive, potential restraints could include increasing competition from established traditional banks adapting to digital, evolving regulatory landscapes that may impose stricter compliance measures, and concerns around data security and customer trust. However, the inherent agility and customer-centric approach of neo-banks are expected to allow them to effectively navigate these challenges.
APAC Neo Banks Industry Company Market Share
APAC Neo Banks Industry Market Concentration & Innovation
The APAC Neo Banks industry is characterized by a dynamic and evolving market concentration, with a significant shift towards digital-first financial solutions. Innovation drivers are primarily fueled by the rapid adoption of mobile technology, increasing internet penetration, and a growing demand for seamless digital banking experiences. Regulatory frameworks across the Asia-Pacific region are becoming more conducive to digital banking, with governments actively promoting financial inclusion and digital payments. Product substitutes, such as traditional banking services, are gradually losing ground to neobanks offering lower fees and greater convenience. End-user trends show a strong preference for personalized services, faster transactions, and integrated financial management tools, particularly among millennials and Gen Z. Mergers and acquisitions (M&A) activities are on the rise as established players seek to acquire innovative technologies and neobanks look to scale their operations. The estimated M&A deal value in the APAC neo banks sector is projected to reach approximately $5,000 Million by 2028, indicating a consolidation trend. Key market share leaders include Paytm Payments Bank, with an estimated 25% market share in its core operating markets, followed by WE Bank and MY Bank, each holding significant stakes.
APAC Neo Banks Industry Industry Trends & Insights
The APAC Neo Banks industry is experiencing an unprecedented surge in growth, driven by a confluence of technological advancements, evolving consumer behaviors, and supportive regulatory environments. The market is projected to witness a Compound Annual Growth Rate (CAGR) of approximately 20% from 2025 to 2033. This impressive expansion is underpinned by several key trends. Technological disruptions, such as the widespread adoption of AI and machine learning for personalized customer service and fraud detection, are revolutionizing the banking experience. The increasing penetration of smartphones and affordable data plans in emerging economies across APAC has opened up vast new customer segments for neobanks. Consumer preferences are shifting dramatically towards digital-native banking solutions that offer intuitive interfaces, instant access to services, and a superior user experience compared to traditional brick-and-mortar banks. Features like real-time transaction alerts, budgeting tools, and seamless international money transfers are becoming table stakes. The competitive dynamics are intensifying, with a mix of well-funded startups and incumbent banks launching their own digital-only offerings. This competitive landscape is driving innovation and pushing the boundaries of what digital financial services can offer. Market penetration of neo banking services in urban centers has already surpassed 40% and is steadily increasing in semi-urban and rural areas. The focus on financial inclusion remains a powerful growth driver, as neobanks are uniquely positioned to serve the unbanked and underbanked populations across the region. Furthermore, the increasing acceptance of QR code payments and contactless transactions, accelerated by events like the pandemic, has created a fertile ground for neobanks to thrive. The integration of non-banking financial services, such as investment platforms and insurance products, within neo banking apps is another significant trend enhancing customer stickiness and expanding revenue streams. The rise of open banking APIs is also fostering an ecosystem of innovation, allowing third-party developers to build new financial products and services on top of neo banking infrastructure. This interconnectedness is creating a more comprehensive and user-centric financial landscape.
Dominant Markets & Segments in APAC Neo Banks Industry
The APAC Neo Banks industry exhibits dominance across several key regions and segments, driven by a combination of economic policies, robust digital infrastructure, and evolving consumer needs.
Leading Region
- Southeast Asia is emerging as a dominant region for neo banking growth, fueled by its young, tech-savvy population, high mobile penetration, and a strong push towards digital transformation from governments. Countries like Indonesia, Vietnam, and the Philippines are experiencing rapid adoption of neo banking services. Economic policies promoting financial inclusion and digital payments have been instrumental. The development of reliable internet infrastructure, even in remote areas, further bolsters this dominance.
Dominant Segments by Service Type
- Payments: This segment holds the largest market share within the APAC neo banking landscape. The sheer volume of digital transactions, from e-commerce to peer-to-peer transfers, makes this a critical area. Drivers include the convenience of mobile payments, the growth of online retail, and government initiatives to promote cashless economies.
- Consumer Credit: As financial literacy and access to formal credit expand, consumer credit products offered by neobanks are gaining significant traction. The ability to offer faster loan approvals and more flexible repayment terms compared to traditional banks is a key differentiator. Economic growth and rising disposable incomes contribute to this demand.
- Savings Products: Neobanks are attracting users with attractive interest rates and simplified account opening processes for savings accounts. The desire for higher returns than traditional savings accounts, coupled with ease of management through mobile apps, drives growth.
- Current Account: Neobanks are disrupting the traditional current account market by offering fee-free accounts, integrated budgeting tools, and seamless transaction management, appealing to both individuals and small businesses seeking cost-effective banking solutions.
Dominant Segments by End-User Type
- Personal Segment: This segment constitutes the majority of neo bank users in APAC. The convenience, user-friendly interfaces, and access to a wide range of digital financial services catering to individual needs, such as payments, savings, and personal loans, are key drivers. The increasing digital adoption among younger demographics fuels this dominance.
- Business Segment: While currently smaller than the personal segment, the business segment for neo banking is experiencing rapid growth, particularly among SMEs. Neobanks are offering streamlined business accounts, simplified invoicing, faster payment processing, and integrated accounting tools, addressing the unique needs of small and medium-sized enterprises. Government support for SME digitalization further propels this segment.
APAC Neo Banks Industry Product Developments
Neo banks in APAC are continuously innovating their product offerings to capture a larger market share and enhance customer loyalty. Recent developments include the introduction of AI-powered personalized financial advice, advanced budgeting and expense tracking tools, and seamless integration with e-commerce platforms for a frictionless checkout experience. The emphasis is on developing user-friendly mobile applications that offer a comprehensive suite of financial services, from payments and savings to lending and investments. Competitive advantages are being carved out through competitive interest rates on savings products, lower fees on transactions, and faster loan approvals. The adoption of cutting-edge technologies like blockchain for enhanced security and efficiency is also a key trend.
Report Scope & Segmentation Analysis
This report meticulously analyzes the APAC Neo Banks industry, covering a comprehensive segmentation across various service types and end-user categories. The market is segmented by Service Type including Payments, Savings Products, Current Account, Consumer Credit, Loans, and Others, providing detailed insights into the growth trajectories and market shares of each. Furthermore, the analysis extends to End-User Type, differentiating between the Business Segment and the Personal Segment, to understand the unique adoption patterns and demands of each user group. Growth projections for each segment are estimated, with the Payments segment expected to maintain its leading position due to widespread digital adoption. Competitive dynamics within each segment are assessed, highlighting the key players and their strategies for market dominance.
Key Drivers of APAC Neo Banks Industry Growth
The APAC Neo Banks industry is propelled by a robust set of growth drivers. Technologically, the widespread adoption of smartphones, high internet penetration, and advancements in mobile banking infrastructure are foundational. Economically, the growing middle class, increasing disposable incomes, and a rising demand for accessible and affordable financial services in emerging markets are critical. Regulatory support, with governments actively promoting financial inclusion and digital transformation through favorable policies, further bolsters growth. The inherent advantages of neobanks, such as lower operational costs, faster service delivery, and a customer-centric approach, also contribute significantly to their expanding market presence.
Challenges in the APAC Neo Banks Industry Sector
Despite the immense growth potential, the APAC Neo Banks industry faces several challenges. Regulatory hurdles remain a significant concern, with varying compliance requirements across different countries impacting expansion strategies. Cybersecurity threats and data privacy issues pose constant risks, necessitating substantial investments in robust security measures. Intense competition from both established banks launching digital offerings and other neo banks necessitates continuous innovation and customer acquisition strategies. Supply chain issues, particularly related to the sourcing of advanced technological components for digital infrastructure, can sometimes affect development timelines. Acquiring and retaining customers in a crowded market also presents an ongoing challenge, requiring effective marketing and superior user experience.
Emerging Opportunities in APAC Neo Banks Industry
The APAC Neo Banks industry is ripe with emerging opportunities. The untapped potential of rural and remote populations presents a significant opportunity for financial inclusion. The increasing demand for embedded finance, where banking services are integrated into non-financial platforms, offers new avenues for growth. The burgeoning market for digital assets and cryptocurrencies presents a potential area for neo banks to explore and offer innovative solutions. Furthermore, partnerships with fintech companies and technology providers can unlock new revenue streams and enhance service offerings. The growing trend of personalized financial management and wealth creation services also opens doors for specialized product development.
Leading Players in the APAC Neo Banks Industry Market
- WE Bank
- MY Bank
- Eon
- Paytm Payments Bank
- Digi bank
- Jenius
- SBI Sumishin Net Bank
- Kakao Bank
- K Plus
- Timo
- Volt
- Xinja
- BigPay
- Neat
Key Developments in APAC Neo Banks Industry Industry
- October 2023: Paytm launched the industry’s first alternate ID-based guest checkout solution for merchants, enhancing security through tokenization that masks card numbers to prevent misuse and theft from merchant websites.
- July 2023: Paytm announced the launch of two innovative 4G enabled payment devices: the Paytm Pocket Soundbox and Paytm Music Soundbox. The pocket-sized Paytm Pocket Soundbox empowers merchants on the go with instant audio payment alerts.
Strategic Outlook for APAC Neo Banks Industry Market
The strategic outlook for the APAC Neo Banks Industry Market is overwhelmingly positive, marked by continued innovation and expansion. Future growth will be fueled by the increasing digitization of economies across the region and a persistent demand for convenient, low-cost financial services. Strategic initiatives will focus on enhancing customer experience through AI-driven personalization, expanding product portfolios to include wealth management and investment solutions, and forging strategic partnerships to accelerate market penetration. The ongoing shift towards cashless societies and government-led digital transformation agendas will provide a conducive environment for neo banks to capture significant market share, particularly in emerging economies.
APAC Neo Banks Industry Segmentation
-
1. Service Type
- 1.1. Payments
- 1.2. Savings Products
- 1.3. Current Account
- 1.4. Consumer Credit
- 1.5. Loans
- 1.6. Others
-
2. End-User Type
- 2.1. Business Segment
- 2.2. Personal Segment
APAC Neo Banks Industry Segmentation By Geography
-
1. North America
- 1.1. United States
- 1.2. Canada
- 1.3. Mexico
-
2. South America
- 2.1. Brazil
- 2.2. Argentina
- 2.3. Rest of South America
-
3. Europe
- 3.1. United Kingdom
- 3.2. Germany
- 3.3. France
- 3.4. Italy
- 3.5. Spain
- 3.6. Russia
- 3.7. Benelux
- 3.8. Nordics
- 3.9. Rest of Europe
-
4. Middle East & Africa
- 4.1. Turkey
- 4.2. Israel
- 4.3. GCC
- 4.4. North Africa
- 4.5. South Africa
- 4.6. Rest of Middle East & Africa
-
5. Asia Pacific
- 5.1. China
- 5.2. India
- 5.3. Japan
- 5.4. South Korea
- 5.5. ASEAN
- 5.6. Oceania
- 5.7. Rest of Asia Pacific
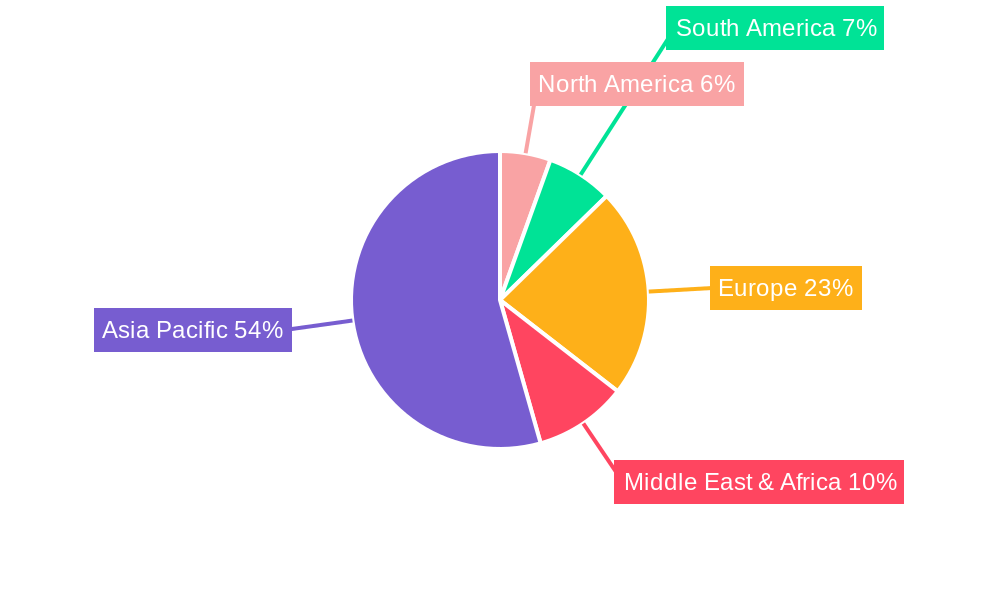
APAC Neo Banks Industry Regional Market Share
Geographic Coverage of APAC Neo Banks Industry
APAC Neo Banks Industry REPORT HIGHLIGHTS
| Aspects | Details |
|---|---|
| Study Period | 2020-2034 |
| Base Year | 2025 |
| Estimated Year | 2026 |
| Forecast Period | 2026-2034 |
| Historical Period | 2020-2025 |
| Growth Rate | CAGR of > 9.00% from 2020-2034 |
| Segmentation |
|
Table of Contents
- 1. Introduction
- 1.1. Research Scope
- 1.2. Market Segmentation
- 1.3. Research Objective
- 1.4. Definitions and Assumptions
- 2. Executive Summary
- 2.1. Market Snapshot
- 3. Market Dynamics
- 3.1. Market Drivers
- 3.2. Market Restrains
- 3.3. Market Trends
- 3.4. Market Opportunities
- 4. Market Factor Analysis
- 4.1. Porters Five Forces
- 4.1.1. Bargaining Power of Suppliers
- 4.1.2. Bargaining Power of Buyers
- 4.1.3. Threat of New Entrants
- 4.1.4. Threat of Substitutes
- 4.1.5. Competitive Rivalry
- 4.2. PESTEL analysis
- 4.3. BCG Analysis
- 4.3.1. Stars (High Growth, High Market Share)
- 4.3.2. Cash Cows (Low Growth, High Market Share)
- 4.3.3. Question Mark (High Growth, Low Market Share)
- 4.3.4. Dogs (Low Growth, Low Market Share)
- 4.4. Ansoff Matrix Analysis
- 4.5. Supply Chain Analysis
- 4.6. Regulatory Landscape
- 4.7. Current Market Potential and Opportunity Assessment (TAM–SAM–SOM Framework)
- 4.8. RAX Analyst Note
- 4.1. Porters Five Forces
- 5. Market Analysis, Insights and Forecast 2021-2033
- 5.1. Market Analysis, Insights and Forecast - by Service Type
- 5.1.1. Payments
- 5.1.2. Savings Products
- 5.1.3. Current Account
- 5.1.4. Consumer Credit
- 5.1.5. Loans
- 5.1.6. Others
- 5.2. Market Analysis, Insights and Forecast - by End-User Type
- 5.2.1. Business Segment
- 5.2.2. Personal Segment
- 5.3. Market Analysis, Insights and Forecast - by Region
- 5.3.1. North America
- 5.3.2. South America
- 5.3.3. Europe
- 5.3.4. Middle East & Africa
- 5.3.5. Asia Pacific
- 5.1. Market Analysis, Insights and Forecast - by Service Type
- 6. Global APAC Neo Banks Industry Analysis, Insights and Forecast, 2021-2033
- 6.1. Market Analysis, Insights and Forecast - by Service Type
- 6.1.1. Payments
- 6.1.2. Savings Products
- 6.1.3. Current Account
- 6.1.4. Consumer Credit
- 6.1.5. Loans
- 6.1.6. Others
- 6.2. Market Analysis, Insights and Forecast - by End-User Type
- 6.2.1. Business Segment
- 6.2.2. Personal Segment
- 6.1. Market Analysis, Insights and Forecast - by Service Type
- 7. North America APAC Neo Banks Industry Analysis, Insights and Forecast, 2020-2032
- 7.1. Market Analysis, Insights and Forecast - by Service Type
- 7.1.1. Payments
- 7.1.2. Savings Products
- 7.1.3. Current Account
- 7.1.4. Consumer Credit
- 7.1.5. Loans
- 7.1.6. Others
- 7.2. Market Analysis, Insights and Forecast - by End-User Type
- 7.2.1. Business Segment
- 7.2.2. Personal Segment
- 7.1. Market Analysis, Insights and Forecast - by Service Type
- 8. South America APAC Neo Banks Industry Analysis, Insights and Forecast, 2020-2032
- 8.1. Market Analysis, Insights and Forecast - by Service Type
- 8.1.1. Payments
- 8.1.2. Savings Products
- 8.1.3. Current Account
- 8.1.4. Consumer Credit
- 8.1.5. Loans
- 8.1.6. Others
- 8.2. Market Analysis, Insights and Forecast - by End-User Type
- 8.2.1. Business Segment
- 8.2.2. Personal Segment
- 8.1. Market Analysis, Insights and Forecast - by Service Type
- 9. Europe APAC Neo Banks Industry Analysis, Insights and Forecast, 2020-2032
- 9.1. Market Analysis, Insights and Forecast - by Service Type
- 9.1.1. Payments
- 9.1.2. Savings Products
- 9.1.3. Current Account
- 9.1.4. Consumer Credit
- 9.1.5. Loans
- 9.1.6. Others
- 9.2. Market Analysis, Insights and Forecast - by End-User Type
- 9.2.1. Business Segment
- 9.2.2. Personal Segment
- 9.1. Market Analysis, Insights and Forecast - by Service Type
- 10. Middle East & Africa APAC Neo Banks Industry Analysis, Insights and Forecast, 2020-2032
- 10.1. Market Analysis, Insights and Forecast - by Service Type
- 10.1.1. Payments
- 10.1.2. Savings Products
- 10.1.3. Current Account
- 10.1.4. Consumer Credit
- 10.1.5. Loans
- 10.1.6. Others
- 10.2. Market Analysis, Insights and Forecast - by End-User Type
- 10.2.1. Business Segment
- 10.2.2. Personal Segment
- 10.1. Market Analysis, Insights and Forecast - by Service Type
- 11. Asia Pacific APAC Neo Banks Industry Analysis, Insights and Forecast, 2020-2032
- 11.1. Market Analysis, Insights and Forecast - by Service Type
- 11.1.1. Payments
- 11.1.2. Savings Products
- 11.1.3. Current Account
- 11.1.4. Consumer Credit
- 11.1.5. Loans
- 11.1.6. Others
- 11.2. Market Analysis, Insights and Forecast - by End-User Type
- 11.2.1. Business Segment
- 11.2.2. Personal Segment
- 11.1. Market Analysis, Insights and Forecast - by Service Type
- 12. Competitive Analysis
- 12.1. Company Profiles
- 12.1.1 WE Bank
- 12.1.1.1. Company Overview
- 12.1.1.2. Products
- 12.1.1.3. Company Financials
- 12.1.1.4. SWOT Analysis
- 12.1.2 MY Bank
- 12.1.2.1. Company Overview
- 12.1.2.2. Products
- 12.1.2.3. Company Financials
- 12.1.2.4. SWOT Analysis
- 12.1.3 Eon
- 12.1.3.1. Company Overview
- 12.1.3.2. Products
- 12.1.3.3. Company Financials
- 12.1.3.4. SWOT Analysis
- 12.1.4 Paytm Payments Bank
- 12.1.4.1. Company Overview
- 12.1.4.2. Products
- 12.1.4.3. Company Financials
- 12.1.4.4. SWOT Analysis
- 12.1.5 Digi bank
- 12.1.5.1. Company Overview
- 12.1.5.2. Products
- 12.1.5.3. Company Financials
- 12.1.5.4. SWOT Analysis
- 12.1.6 Jenius
- 12.1.6.1. Company Overview
- 12.1.6.2. Products
- 12.1.6.3. Company Financials
- 12.1.6.4. SWOT Analysis
- 12.1.7 SBI Sumishin Net Bank
- 12.1.7.1. Company Overview
- 12.1.7.2. Products
- 12.1.7.3. Company Financials
- 12.1.7.4. SWOT Analysis
- 12.1.8 Kakao Bank
- 12.1.8.1. Company Overview
- 12.1.8.2. Products
- 12.1.8.3. Company Financials
- 12.1.8.4. SWOT Analysis
- 12.1.9 K Plus
- 12.1.9.1. Company Overview
- 12.1.9.2. Products
- 12.1.9.3. Company Financials
- 12.1.9.4. SWOT Analysis
- 12.1.10 Timo
- 12.1.10.1. Company Overview
- 12.1.10.2. Products
- 12.1.10.3. Company Financials
- 12.1.10.4. SWOT Analysis
- 12.1.11 Volt
- 12.1.11.1. Company Overview
- 12.1.11.2. Products
- 12.1.11.3. Company Financials
- 12.1.11.4. SWOT Analysis
- 12.1.12 Xinja
- 12.1.12.1. Company Overview
- 12.1.12.2. Products
- 12.1.12.3. Company Financials
- 12.1.12.4. SWOT Analysis
- 12.1.13 BigPay
- 12.1.13.1. Company Overview
- 12.1.13.2. Products
- 12.1.13.3. Company Financials
- 12.1.13.4. SWOT Analysis
- 12.1.14 Neat**List Not Exhaustive
- 12.1.14.1. Company Overview
- 12.1.14.2. Products
- 12.1.14.3. Company Financials
- 12.1.14.4. SWOT Analysis
- 12.1.1 WE Bank
- 12.2. Market Entropy
- 12.2.1 Company's Key Areas Served
- 12.2.2 Recent Developments
- 12.3. Company Market Share Analysis 2025
- 12.3.1 Top 5 Companies Market Share Analysis
- 12.3.2 Top 3 Companies Market Share Analysis
- 12.4. List of Potential Customers
- 13. Research Methodology
List of Figures
- Figure 1: Global APAC Neo Banks Industry Revenue Breakdown (Million, %) by Region 2025 & 2033
- Figure 2: Global APAC Neo Banks Industry Volume Breakdown (Billion, %) by Region 2025 & 2033
- Figure 3: North America APAC Neo Banks Industry Revenue (Million), by Service Type 2025 & 2033
- Figure 4: North America APAC Neo Banks Industry Volume (Billion), by Service Type 2025 & 2033
- Figure 5: North America APAC Neo Banks Industry Revenue Share (%), by Service Type 2025 & 2033
- Figure 6: North America APAC Neo Banks Industry Volume Share (%), by Service Type 2025 & 2033
- Figure 7: North America APAC Neo Banks Industry Revenue (Million), by End-User Type 2025 & 2033
- Figure 8: North America APAC Neo Banks Industry Volume (Billion), by End-User Type 2025 & 2033
- Figure 9: North America APAC Neo Banks Industry Revenue Share (%), by End-User Type 2025 & 2033
- Figure 10: North America APAC Neo Banks Industry Volume Share (%), by End-User Type 2025 & 2033
- Figure 11: North America APAC Neo Banks Industry Revenue (Million), by Country 2025 & 2033
- Figure 12: North America APAC Neo Banks Industry Volume (Billion), by Country 2025 & 2033
- Figure 13: North America APAC Neo Banks Industry Revenue Share (%), by Country 2025 & 2033
- Figure 14: North America APAC Neo Banks Industry Volume Share (%), by Country 2025 & 2033
- Figure 15: South America APAC Neo Banks Industry Revenue (Million), by Service Type 2025 & 2033
- Figure 16: South America APAC Neo Banks Industry Volume (Billion), by Service Type 2025 & 2033
- Figure 17: South America APAC Neo Banks Industry Revenue Share (%), by Service Type 2025 & 2033
- Figure 18: South America APAC Neo Banks Industry Volume Share (%), by Service Type 2025 & 2033
- Figure 19: South America APAC Neo Banks Industry Revenue (Million), by End-User Type 2025 & 2033
- Figure 20: South America APAC Neo Banks Industry Volume (Billion), by End-User Type 2025 & 2033
- Figure 21: South America APAC Neo Banks Industry Revenue Share (%), by End-User Type 2025 & 2033
- Figure 22: South America APAC Neo Banks Industry Volume Share (%), by End-User Type 2025 & 2033
- Figure 23: South America APAC Neo Banks Industry Revenue (Million), by Country 2025 & 2033
- Figure 24: South America APAC Neo Banks Industry Volume (Billion), by Country 2025 & 2033
- Figure 25: South America APAC Neo Banks Industry Revenue Share (%), by Country 2025 & 2033
- Figure 26: South America APAC Neo Banks Industry Volume Share (%), by Country 2025 & 2033
- Figure 27: Europe APAC Neo Banks Industry Revenue (Million), by Service Type 2025 & 2033
- Figure 28: Europe APAC Neo Banks Industry Volume (Billion), by Service Type 2025 & 2033
- Figure 29: Europe APAC Neo Banks Industry Revenue Share (%), by Service Type 2025 & 2033
- Figure 30: Europe APAC Neo Banks Industry Volume Share (%), by Service Type 2025 & 2033
- Figure 31: Europe APAC Neo Banks Industry Revenue (Million), by End-User Type 2025 & 2033
- Figure 32: Europe APAC Neo Banks Industry Volume (Billion), by End-User Type 2025 & 2033
- Figure 33: Europe APAC Neo Banks Industry Revenue Share (%), by End-User Type 2025 & 2033
- Figure 34: Europe APAC Neo Banks Industry Volume Share (%), by End-User Type 2025 & 2033
- Figure 35: Europe APAC Neo Banks Industry Revenue (Million), by Country 2025 & 2033
- Figure 36: Europe APAC Neo Banks Industry Volume (Billion), by Country 2025 & 2033
- Figure 37: Europe APAC Neo Banks Industry Revenue Share (%), by Country 2025 & 2033
- Figure 38: Europe APAC Neo Banks Industry Volume Share (%), by Country 2025 & 2033
- Figure 39: Middle East & Africa APAC Neo Banks Industry Revenue (Million), by Service Type 2025 & 2033
- Figure 40: Middle East & Africa APAC Neo Banks Industry Volume (Billion), by Service Type 2025 & 2033
- Figure 41: Middle East & Africa APAC Neo Banks Industry Revenue Share (%), by Service Type 2025 & 2033
- Figure 42: Middle East & Africa APAC Neo Banks Industry Volume Share (%), by Service Type 2025 & 2033
- Figure 43: Middle East & Africa APAC Neo Banks Industry Revenue (Million), by End-User Type 2025 & 2033
- Figure 44: Middle East & Africa APAC Neo Banks Industry Volume (Billion), by End-User Type 2025 & 2033
- Figure 45: Middle East & Africa APAC Neo Banks Industry Revenue Share (%), by End-User Type 2025 & 2033
- Figure 46: Middle East & Africa APAC Neo Banks Industry Volume Share (%), by End-User Type 2025 & 2033
- Figure 47: Middle East & Africa APAC Neo Banks Industry Revenue (Million), by Country 2025 & 2033
- Figure 48: Middle East & Africa APAC Neo Banks Industry Volume (Billion), by Country 2025 & 2033
- Figure 49: Middle East & Africa APAC Neo Banks Industry Revenue Share (%), by Country 2025 & 2033
- Figure 50: Middle East & Africa APAC Neo Banks Industry Volume Share (%), by Country 2025 & 2033
- Figure 51: Asia Pacific APAC Neo Banks Industry Revenue (Million), by Service Type 2025 & 2033
- Figure 52: Asia Pacific APAC Neo Banks Industry Volume (Billion), by Service Type 2025 & 2033
- Figure 53: Asia Pacific APAC Neo Banks Industry Revenue Share (%), by Service Type 2025 & 2033
- Figure 54: Asia Pacific APAC Neo Banks Industry Volume Share (%), by Service Type 2025 & 2033
- Figure 55: Asia Pacific APAC Neo Banks Industry Revenue (Million), by End-User Type 2025 & 2033
- Figure 56: Asia Pacific APAC Neo Banks Industry Volume (Billion), by End-User Type 2025 & 2033
- Figure 57: Asia Pacific APAC Neo Banks Industry Revenue Share (%), by End-User Type 2025 & 2033
- Figure 58: Asia Pacific APAC Neo Banks Industry Volume Share (%), by End-User Type 2025 & 2033
- Figure 59: Asia Pacific APAC Neo Banks Industry Revenue (Million), by Country 2025 & 2033
- Figure 60: Asia Pacific APAC Neo Banks Industry Volume (Billion), by Country 2025 & 2033
- Figure 61: Asia Pacific APAC Neo Banks Industry Revenue Share (%), by Country 2025 & 2033
- Figure 62: Asia Pacific APAC Neo Banks Industry Volume Share (%), by Country 2025 & 2033
List of Tables
- Table 1: Global APAC Neo Banks Industry Revenue Million Forecast, by Service Type 2020 & 2033
- Table 2: Global APAC Neo Banks Industry Volume Billion Forecast, by Service Type 2020 & 2033
- Table 3: Global APAC Neo Banks Industry Revenue Million Forecast, by End-User Type 2020 & 2033
- Table 4: Global APAC Neo Banks Industry Volume Billion Forecast, by End-User Type 2020 & 2033
- Table 5: Global APAC Neo Banks Industry Revenue Million Forecast, by Region 2020 & 2033
- Table 6: Global APAC Neo Banks Industry Volume Billion Forecast, by Region 2020 & 2033
- Table 7: Global APAC Neo Banks Industry Revenue Million Forecast, by Service Type 2020 & 2033
- Table 8: Global APAC Neo Banks Industry Volume Billion Forecast, by Service Type 2020 & 2033
- Table 9: Global APAC Neo Banks Industry Revenue Million Forecast, by End-User Type 2020 & 2033
- Table 10: Global APAC Neo Banks Industry Volume Billion Forecast, by End-User Type 2020 & 2033
- Table 11: Global APAC Neo Banks Industry Revenue Million Forecast, by Country 2020 & 2033
- Table 12: Global APAC Neo Banks Industry Volume Billion Forecast, by Country 2020 & 2033
- Table 13: United States APAC Neo Banks Industry Revenue (Million) Forecast, by Application 2020 & 2033
- Table 14: United States APAC Neo Banks Industry Volume (Billion) Forecast, by Application 2020 & 2033
- Table 15: Canada APAC Neo Banks Industry Revenue (Million) Forecast, by Application 2020 & 2033
- Table 16: Canada APAC Neo Banks Industry Volume (Billion) Forecast, by Application 2020 & 2033
- Table 17: Mexico APAC Neo Banks Industry Revenue (Million) Forecast, by Application 2020 & 2033
- Table 18: Mexico APAC Neo Banks Industry Volume (Billion) Forecast, by Application 2020 & 2033
- Table 19: Global APAC Neo Banks Industry Revenue Million Forecast, by Service Type 2020 & 2033
- Table 20: Global APAC Neo Banks Industry Volume Billion Forecast, by Service Type 2020 & 2033
- Table 21: Global APAC Neo Banks Industry Revenue Million Forecast, by End-User Type 2020 & 2033
- Table 22: Global APAC Neo Banks Industry Volume Billion Forecast, by End-User Type 2020 & 2033
- Table 23: Global APAC Neo Banks Industry Revenue Million Forecast, by Country 2020 & 2033
- Table 24: Global APAC Neo Banks Industry Volume Billion Forecast, by Country 2020 & 2033
- Table 25: Brazil APAC Neo Banks Industry Revenue (Million) Forecast, by Application 2020 & 2033
- Table 26: Brazil APAC Neo Banks Industry Volume (Billion) Forecast, by Application 2020 & 2033
- Table 27: Argentina APAC Neo Banks Industry Revenue (Million) Forecast, by Application 2020 & 2033
- Table 28: Argentina APAC Neo Banks Industry Volume (Billion) Forecast, by Application 2020 & 2033
- Table 29: Rest of South America APAC Neo Banks Industry Revenue (Million) Forecast, by Application 2020 & 2033
- Table 30: Rest of South America APAC Neo Banks Industry Volume (Billion) Forecast, by Application 2020 & 2033
- Table 31: Global APAC Neo Banks Industry Revenue Million Forecast, by Service Type 2020 & 2033
- Table 32: Global APAC Neo Banks Industry Volume Billion Forecast, by Service Type 2020 & 2033
- Table 33: Global APAC Neo Banks Industry Revenue Million Forecast, by End-User Type 2020 & 2033
- Table 34: Global APAC Neo Banks Industry Volume Billion Forecast, by End-User Type 2020 & 2033
- Table 35: Global APAC Neo Banks Industry Revenue Million Forecast, by Country 2020 & 2033
- Table 36: Global APAC Neo Banks Industry Volume Billion Forecast, by Country 2020 & 2033
- Table 37: United Kingdom APAC Neo Banks Industry Revenue (Million) Forecast, by Application 2020 & 2033
- Table 38: United Kingdom APAC Neo Banks Industry Volume (Billion) Forecast, by Application 2020 & 2033
- Table 39: Germany APAC Neo Banks Industry Revenue (Million) Forecast, by Application 2020 & 2033
- Table 40: Germany APAC Neo Banks Industry Volume (Billion) Forecast, by Application 2020 & 2033
- Table 41: France APAC Neo Banks Industry Revenue (Million) Forecast, by Application 2020 & 2033
- Table 42: France APAC Neo Banks Industry Volume (Billion) Forecast, by Application 2020 & 2033
- Table 43: Italy APAC Neo Banks Industry Revenue (Million) Forecast, by Application 2020 & 2033
- Table 44: Italy APAC Neo Banks Industry Volume (Billion) Forecast, by Application 2020 & 2033
- Table 45: Spain APAC Neo Banks Industry Revenue (Million) Forecast, by Application 2020 & 2033
- Table 46: Spain APAC Neo Banks Industry Volume (Billion) Forecast, by Application 2020 & 2033
- Table 47: Russia APAC Neo Banks Industry Revenue (Million) Forecast, by Application 2020 & 2033
- Table 48: Russia APAC Neo Banks Industry Volume (Billion) Forecast, by Application 2020 & 2033
- Table 49: Benelux APAC Neo Banks Industry Revenue (Million) Forecast, by Application 2020 & 2033
- Table 50: Benelux APAC Neo Banks Industry Volume (Billion) Forecast, by Application 2020 & 2033
- Table 51: Nordics APAC Neo Banks Industry Revenue (Million) Forecast, by Application 2020 & 2033
- Table 52: Nordics APAC Neo Banks Industry Volume (Billion) Forecast, by Application 2020 & 2033
- Table 53: Rest of Europe APAC Neo Banks Industry Revenue (Million) Forecast, by Application 2020 & 2033
- Table 54: Rest of Europe APAC Neo Banks Industry Volume (Billion) Forecast, by Application 2020 & 2033
- Table 55: Global APAC Neo Banks Industry Revenue Million Forecast, by Service Type 2020 & 2033
- Table 56: Global APAC Neo Banks Industry Volume Billion Forecast, by Service Type 2020 & 2033
- Table 57: Global APAC Neo Banks Industry Revenue Million Forecast, by End-User Type 2020 & 2033
- Table 58: Global APAC Neo Banks Industry Volume Billion Forecast, by End-User Type 2020 & 2033
- Table 59: Global APAC Neo Banks Industry Revenue Million Forecast, by Country 2020 & 2033
- Table 60: Global APAC Neo Banks Industry Volume Billion Forecast, by Country 2020 & 2033
- Table 61: Turkey APAC Neo Banks Industry Revenue (Million) Forecast, by Application 2020 & 2033
- Table 62: Turkey APAC Neo Banks Industry Volume (Billion) Forecast, by Application 2020 & 2033
- Table 63: Israel APAC Neo Banks Industry Revenue (Million) Forecast, by Application 2020 & 2033
- Table 64: Israel APAC Neo Banks Industry Volume (Billion) Forecast, by Application 2020 & 2033
- Table 65: GCC APAC Neo Banks Industry Revenue (Million) Forecast, by Application 2020 & 2033
- Table 66: GCC APAC Neo Banks Industry Volume (Billion) Forecast, by Application 2020 & 2033
- Table 67: North Africa APAC Neo Banks Industry Revenue (Million) Forecast, by Application 2020 & 2033
- Table 68: North Africa APAC Neo Banks Industry Volume (Billion) Forecast, by Application 2020 & 2033
- Table 69: South Africa APAC Neo Banks Industry Revenue (Million) Forecast, by Application 2020 & 2033
- Table 70: South Africa APAC Neo Banks Industry Volume (Billion) Forecast, by Application 2020 & 2033
- Table 71: Rest of Middle East & Africa APAC Neo Banks Industry Revenue (Million) Forecast, by Application 2020 & 2033
- Table 72: Rest of Middle East & Africa APAC Neo Banks Industry Volume (Billion) Forecast, by Application 2020 & 2033
- Table 73: Global APAC Neo Banks Industry Revenue Million Forecast, by Service Type 2020 & 2033
- Table 74: Global APAC Neo Banks Industry Volume Billion Forecast, by Service Type 2020 & 2033
- Table 75: Global APAC Neo Banks Industry Revenue Million Forecast, by End-User Type 2020 & 2033
- Table 76: Global APAC Neo Banks Industry Volume Billion Forecast, by End-User Type 2020 & 2033
- Table 77: Global APAC Neo Banks Industry Revenue Million Forecast, by Country 2020 & 2033
- Table 78: Global APAC Neo Banks Industry Volume Billion Forecast, by Country 2020 & 2033
- Table 79: China APAC Neo Banks Industry Revenue (Million) Forecast, by Application 2020 & 2033
- Table 80: China APAC Neo Banks Industry Volume (Billion) Forecast, by Application 2020 & 2033
- Table 81: India APAC Neo Banks Industry Revenue (Million) Forecast, by Application 2020 & 2033
- Table 82: India APAC Neo Banks Industry Volume (Billion) Forecast, by Application 2020 & 2033
- Table 83: Japan APAC Neo Banks Industry Revenue (Million) Forecast, by Application 2020 & 2033
- Table 84: Japan APAC Neo Banks Industry Volume (Billion) Forecast, by Application 2020 & 2033
- Table 85: South Korea APAC Neo Banks Industry Revenue (Million) Forecast, by Application 2020 & 2033
- Table 86: South Korea APAC Neo Banks Industry Volume (Billion) Forecast, by Application 2020 & 2033
- Table 87: ASEAN APAC Neo Banks Industry Revenue (Million) Forecast, by Application 2020 & 2033
- Table 88: ASEAN APAC Neo Banks Industry Volume (Billion) Forecast, by Application 2020 & 2033
- Table 89: Oceania APAC Neo Banks Industry Revenue (Million) Forecast, by Application 2020 & 2033
- Table 90: Oceania APAC Neo Banks Industry Volume (Billion) Forecast, by Application 2020 & 2033
- Table 91: Rest of Asia Pacific APAC Neo Banks Industry Revenue (Million) Forecast, by Application 2020 & 2033
- Table 92: Rest of Asia Pacific APAC Neo Banks Industry Volume (Billion) Forecast, by Application 2020 & 2033
Frequently Asked Questions
1. What is the projected Compound Annual Growth Rate (CAGR) of the APAC Neo Banks Industry?
The projected CAGR is approximately > 9.00%.
2. Which companies are prominent players in the APAC Neo Banks Industry?
Key companies in the market include WE Bank, MY Bank, Eon, Paytm Payments Bank, Digi bank, Jenius, SBI Sumishin Net Bank, Kakao Bank, K Plus, Timo, Volt, Xinja, BigPay, Neat**List Not Exhaustive.
3. What are the main segments of the APAC Neo Banks Industry?
The market segments include Service Type, End-User Type.
4. Can you provide details about the market size?
The market size is estimated to be USD 1.68 Million as of 2022.
5. What are some drivers contributing to market growth?
Increase in Internet Penetration is Driving the Market.
6. What are the notable trends driving market growth?
Raise in Mobile Penetration and High Unbanked Adults in the Region.
7. Are there any restraints impacting market growth?
Increase in Internet Penetration is Driving the Market.
8. Can you provide examples of recent developments in the market?
In October 2023, Paytm launched the industry’s first alternate ID-based guest checkout solution for merchants. Tokenisation masks the 16-digit debit or credit card number with a unique token that is specific to one’s card to prevent misuse and theft from merchant websites.
9. What pricing options are available for accessing the report?
Pricing options include single-user, multi-user, and enterprise licenses priced at USD 4750, USD 5250, and USD 8750 respectively.
10. Is the market size provided in terms of value or volume?
The market size is provided in terms of value, measured in Million and volume, measured in Billion.
11. Are there any specific market keywords associated with the report?
Yes, the market keyword associated with the report is "APAC Neo Banks Industry," which aids in identifying and referencing the specific market segment covered.
12. How do I determine which pricing option suits my needs best?
The pricing options vary based on user requirements and access needs. Individual users may opt for single-user licenses, while businesses requiring broader access may choose multi-user or enterprise licenses for cost-effective access to the report.
13. Are there any additional resources or data provided in the APAC Neo Banks Industry report?
While the report offers comprehensive insights, it's advisable to review the specific contents or supplementary materials provided to ascertain if additional resources or data are available.
14. How can I stay updated on further developments or reports in the APAC Neo Banks Industry?
To stay informed about further developments, trends, and reports in the APAC Neo Banks Industry, consider subscribing to industry newsletters, following relevant companies and organizations, or regularly checking reputable industry news sources and publications.
Methodology
Step 1 - Identification of Relevant Samples Size from Population Database


Step 2 - Approaches for Defining Global Market Size (Value, Volume* & Price*)

Note*: In applicable scenarios
Step 3 - Data Sources
Primary Research
- Web Analytics
- Survey Reports
- Research Institute
- Latest Research Reports
- Opinion Leaders
Secondary Research
- Annual Reports
- White Paper
- Latest Press Release
- Industry Association
- Paid Database
- Investor Presentations

Step 4 - Data Triangulation
Involves using different sources of information in order to increase the validity of a study
These sources are likely to be stakeholders in a program - participants, other researchers, program staff, other community members, and so on.
Then we put all data in single framework & apply various statistical tools to find out the dynamic on the market.
During the analysis stage, feedback from the stakeholder groups would be compared to determine areas of agreement as well as areas of divergence