

Key Insights
The Asia-Pacific (APAC) non-woven fabrics market is experiencing robust growth, driven by expanding industrialization, rising disposable incomes, and increasing demand across diverse sectors. The region's large population and burgeoning middle class fuel significant consumption in applications like hygiene products, construction materials, and automotive components. China, India, and Japan are key contributors to this growth, representing substantial market share due to their established manufacturing bases and robust domestic demand. While polyester remains the dominant material due to its cost-effectiveness and versatility, a growing interest in sustainable alternatives like bio-component and wood pulp non-wovens is emerging, driven by environmental concerns and regulatory pressures. This shift toward eco-friendly materials is expected to impact the market composition in the coming years. The construction sector, particularly in rapidly developing economies within APAC, presents a significant growth opportunity for non-woven fabrics used in insulation, roofing, and filtration systems. However, fluctuations in raw material prices and regional economic uncertainties could pose challenges to consistent growth. The projected CAGR of over 8% indicates a promising outlook for the APAC non-woven fabrics market, with significant expansion expected throughout the forecast period (2025-2033). Competitive intensity is high, with both global and regional players vying for market share. Innovation in material technology and product diversification will be crucial for companies seeking sustained success in this dynamic market.
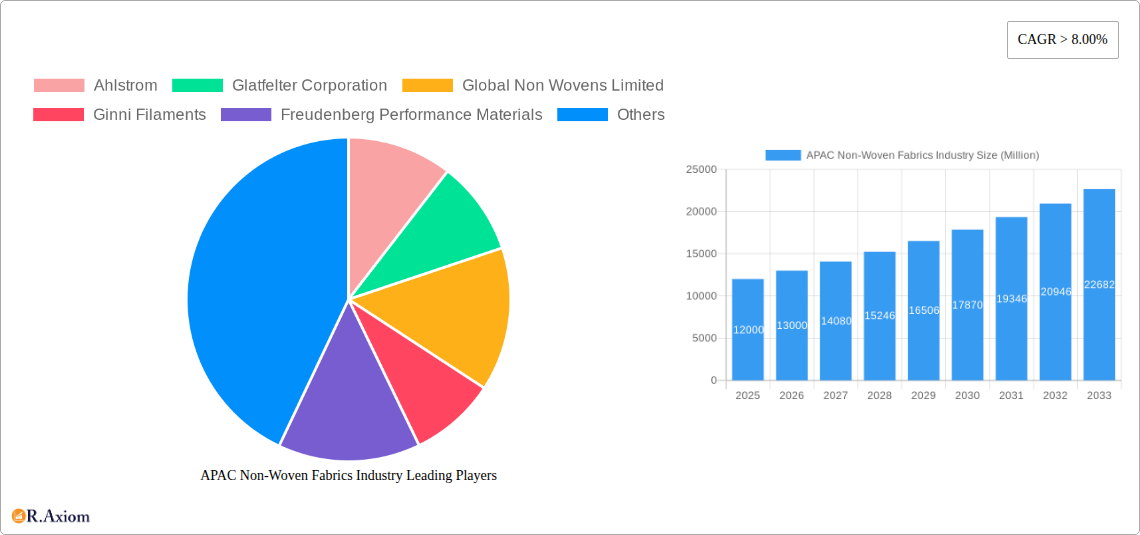
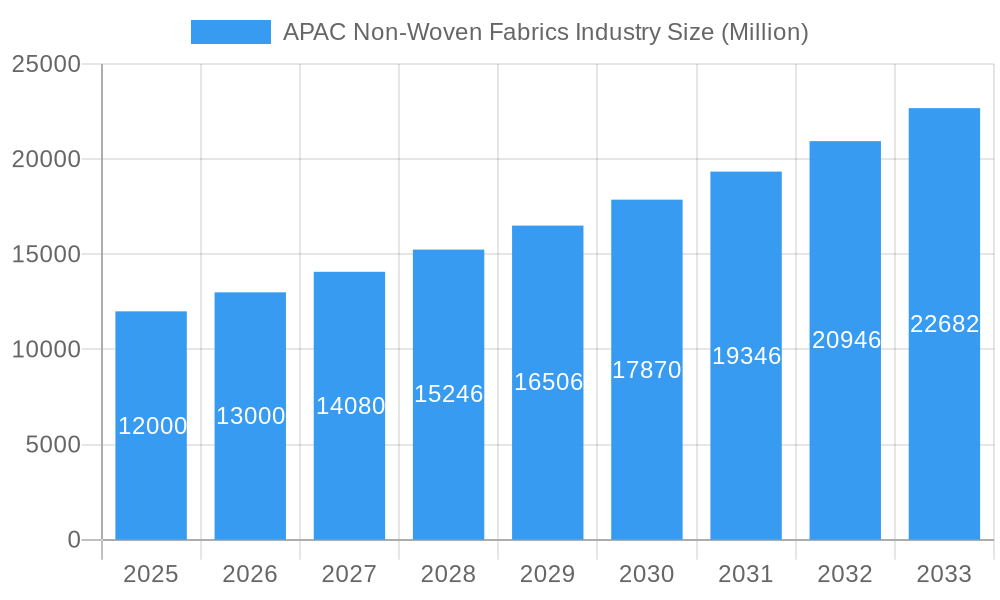
APAC Non-Woven Fabrics Industry Market Size (In Billion)
The segment breakdown within APAC reveals a complex landscape. While spun-bond technology currently holds a significant market share due to its cost-effectiveness and diverse applications, advancements in wet-laid and dry-laid technologies are expected to gradually increase their market penetration. The healthcare industry is a major driver of demand for specialized non-woven fabrics, emphasizing the need for manufacturers to adapt to specific regulatory requirements and hygiene standards. The automotive industry's increasing adoption of non-woven materials for filtration and interior applications further contributes to market growth. Government initiatives promoting sustainable manufacturing practices will influence the trajectory of the market, favoring companies that prioritize environmentally friendly materials and production processes. Overall, the APAC non-woven fabrics market exhibits a healthy growth trajectory, driven by a confluence of factors and with considerable potential for continued expansion in the years to come.
APAC Non-Woven Fabrics Industry Company Market Share
APAC Non-Woven Fabrics Industry: A Comprehensive Market Report (2019-2033)
This comprehensive report provides an in-depth analysis of the Asia-Pacific (APAC) non-woven fabrics industry, offering valuable insights for stakeholders, investors, and industry professionals. The report covers the period from 2019 to 2033, with a base year of 2025 and a forecast period of 2025-2033. The historical period analyzed is 2019-2024. The market size across various segments is estimated in Millions (USD).
APAC Non-Woven Fabrics Industry Market Concentration & Innovation
This section analyzes the competitive landscape of the APAC non-woven fabrics market, examining market concentration, innovation drivers, regulatory influences, and market dynamics. The analysis includes an assessment of mergers and acquisitions (M&A) activity and its impact on market share.
Market Concentration: The APAC non-woven fabrics market exhibits a moderately concentrated structure, with several large multinational players like Ahlstrom, Glatfelter Corporation, DuPont, and TORAY INDUSTRIES INC holding significant market share. However, several smaller regional players also contribute significantly, leading to a dynamic competitive landscape. The precise market share for each major player is currently under review and will be included in the full report (xx%).
Innovation Drivers: Key innovation drivers include advancements in fiber technology (e.g., bio-based materials), improved manufacturing processes (e.g., increased production efficiency), and the development of specialized non-woven fabrics for niche applications (e.g., medical textiles, advanced filtration).
Regulatory Frameworks: Government regulations regarding environmental sustainability and product safety are influencing industry practices and driving innovation in eco-friendly materials and manufacturing processes.
Product Substitutes: The market faces competition from alternative materials such as traditional woven fabrics and plastics, but the superior properties of non-woven fabrics (e.g., breathability, disposability) maintain their market dominance in several applications.
End-User Trends: Growing demand from key end-user industries like healthcare, automotive, and construction are major growth drivers. Shifting consumer preferences towards sustainable and high-performance products are further shaping the market.
M&A Activities: The APAC non-woven fabrics market has witnessed several M&A activities in recent years, with deal values ranging from xx Million to xx Million. These activities reflect the consolidation trend and strategic expansion efforts of major players.
APAC Non-Woven Fabrics Industry Industry Trends & Insights
This section delves into the key trends and insights shaping the APAC non-woven fabrics market. The analysis encompasses market growth drivers, technological advancements, consumer preferences, and competitive dynamics.
The APAC non-woven fabrics market is experiencing robust growth, driven by factors such as increasing disposable incomes, rising urbanization, and the expanding healthcare sector. Technological advancements, such as the development of advanced materials and manufacturing processes, are further fueling market expansion. Consumer preferences towards eco-friendly and high-performance products are significantly impacting the demand for specific non-woven fabric types. The competitive landscape is dynamic, with both established players and new entrants vying for market share, resulting in innovation and price competition. The Compound Annual Growth Rate (CAGR) for the forecast period (2025-2033) is projected to be xx%, with market penetration expected to reach xx% by 2033. Specific regional variations in CAGR will be detailed in the full report.
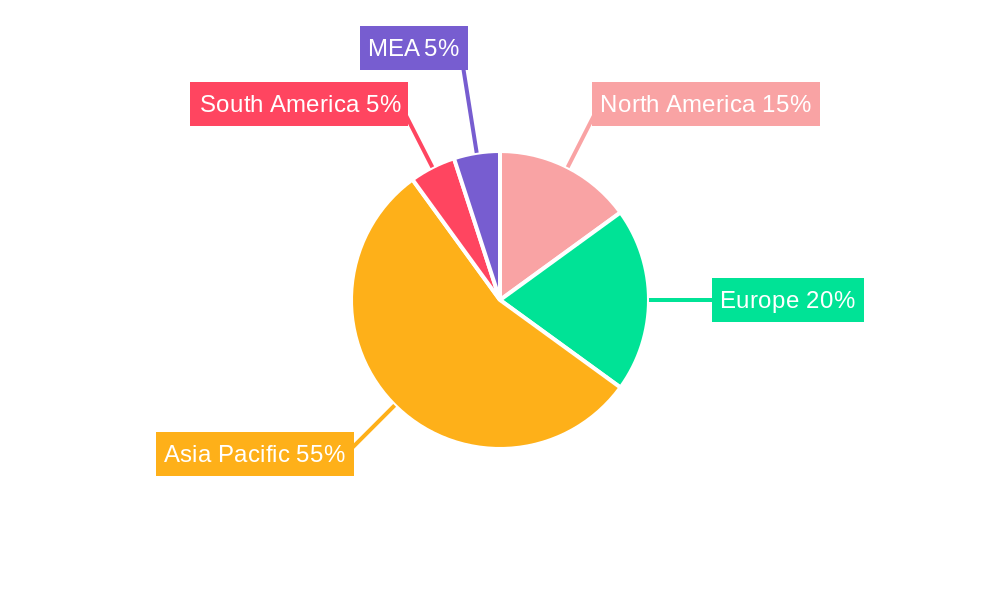
Dominant Markets & Segments in APAP Non-Woven Fabrics Industry
This section identifies the leading regions, countries, and market segments within the APAC non-woven fabrics industry.
Leading Regions/Countries: China and India are expected to remain dominant markets due to their large populations, expanding manufacturing sectors, and favorable economic policies. Other significant markets include Japan, South Korea, and Southeast Asian nations.
Dominant Technology Segments: Spun-bond technology dominates the market due to its versatility and cost-effectiveness. Wet-laid technology holds a smaller but growing market share due to its suitability for producing high-quality fabrics. Dry-laid technology maintains a niche market within specific applications. Other technologies like electrostatic spinning and flash-spun are also making inroads in specific niche applications.
Dominant Material Segments: Polypropylene and Polyester are the most widely used materials due to their excellent properties and cost-effectiveness. Polyethylene finds applications in specific segments while Rayon and other materials (Wood Pulp, Bio-Component) are witnessing increasing demand driven by the sustainable product preference.
Dominant End-User Industries: The healthcare industry is a major driver, followed by the automotive and construction sectors. The personal care and consumer goods segments also contribute significantly to market growth. Each segment’s growth is influenced by unique factors, including government regulations, infrastructure investments, and consumer behavior. Specific data on regional market share breakdowns for each of these segments will be contained within the full report.
APAC Non-Woven Fabrics Industry Product Developments
Recent product innovations focus on enhancing functionality, sustainability, and cost-effectiveness. New materials, such as bio-based polymers and recycled fibers, are gaining traction. Technological advancements are leading to improved fabric properties, such as breathability, absorbency, and strength. These developments enable new applications in diverse sectors, including medical, hygiene, and filtration. The competitive landscape favors companies that successfully integrate these innovations into their product offerings, catering to specific market needs and customer preferences.
Report Scope & Segmentation Analysis
The report provides a comprehensive analysis of the APAC non-woven fabrics market across various segments:
Technology: Spun-bond, Wet-laid, Dry-laid, Others (Electrostatic spinning, Flash-spun, etc.) Each technology segment exhibits unique growth projections based on its applications and market dynamics.
Material: Polyester, Polypropylene, Polyethylene, Rayon, Others (Wood Pulp, Bio-Component, etc.) Market size and growth projections vary for each material based on its properties, cost, and sustainability profile.
End-User Industry: Construction, Textiles, Healthcare, Automotive, Others (Personal Care, Consumer Goods, etc.) The growth of each end-user industry segment influences the demand for specific types of non-woven fabrics.
Key Drivers of APAC Non-Woven Fabrics Industry Growth
The growth of the APAC non-woven fabrics market is driven by several factors: The rising demand from the healthcare industry, driven by increasing disposable incomes and aging populations, fuels significant growth. Advancements in material science and manufacturing technology are continuously improving the functionality and cost-effectiveness of non-woven fabrics. Favorable government policies promoting sustainable materials and manufacturing practices are creating growth opportunities for eco-friendly non-woven fabrics.
Challenges in the APAC Non-Woven Fabrics Industry Sector
The industry faces challenges including fluctuating raw material prices, increasing environmental regulations, and intense competition. Supply chain disruptions can lead to production delays and increased costs, impacting profitability. Meeting stringent environmental regulations requires investment in sustainable technologies and practices, potentially increasing operational costs.
Emerging Opportunities in APAC Non-Woven Fabrics Industry
Emerging opportunities include the growing demand for sustainable and biodegradable non-woven fabrics, the expansion of applications in advanced filtration technologies, and the development of specialized non-woven fabrics for niche applications in diverse industries like agriculture and packaging. The integration of smart technologies and advanced functionalities into non-woven fabrics presents significant growth potential.
Leading Players in the APAC Non-Woven Fabrics Industry Market
- Ahlstrom
- Glatfelter Corporation
- Global Non Wovens Limited
- Ginni Filaments
- Freudenberg Performance Materials
- Cygnus Group
- Eximius Innovative Pvt Ltd
- Fitesa S A
- DuPont
- Autotech Nonwovens Pvt Ltd
- TORAY INDUSTRIES INC
- Johns Manville
- Berry Global Inc
- Reliance Non-woven Industry LLC
Key Developments in APAC Non-Woven Fabrics Industry Industry
- November 2022: Fitesa announced the expansion of its production capacity for nonwoven fabrics for medical applications. This expansion reflects the growing demand for medical-grade non-woven fabrics and signifies Fitesa's commitment to the healthcare sector.
Strategic Outlook for APAC Non-Woven Fabrics Industry Market
The APAC non-woven fabrics market presents significant growth opportunities in the coming years. Continued innovation in materials and technologies, coupled with increasing demand from key end-user industries, will drive market expansion. Companies that effectively adapt to evolving consumer preferences and regulatory frameworks are well-positioned to capitalize on this growth potential. The focus on sustainability and eco-friendly products will further shape the future of the industry.
APAC Non-Woven Fabrics Industry Segmentation
-
1. Technology
- 1.1. Spun-Bond
- 1.2. Wet Laid
- 1.3. Dry Laid
- 1.4. Others (Electrostatic spinning, Flash-spun, etc.)
-
2. Material
- 2.1. Polyester
- 2.2. Polypropylene
- 2.3. Polyethylene
- 2.4. Rayon
- 2.5. Others (Wood Pulp, Bio-Component, etc.)
-
3. End-User Industry
- 3.1. Construction
- 3.2. Textiles
- 3.3. Healthcare
- 3.4. Automotive
- 3.5. Others (Personal Care, Consumer Goods, etc.)
-
4. Geography
- 4.1. China
- 4.2. India
- 4.3. Japan
- 4.4. South Korea
- 4.5. Indonesia
- 4.6. Malaysia
- 4.7. Thailand
- 4.8. Vietnam
- 4.9. Rest of Asia-Pacific
APAC Non-Woven Fabrics Industry Segmentation By Geography
- 1. China
- 2. India
- 3. Japan
- 4. South Korea
- 5. Indonesia
- 6. Malaysia
- 7. Thailand
- 8. Vietnam
- 9. Rest of Asia Pacific
APAC Non-Woven Fabrics Industry Regional Market Share
Geographic Coverage of APAC Non-Woven Fabrics Industry
APAC Non-Woven Fabrics Industry REPORT HIGHLIGHTS
| Aspects | Details |
|---|---|
| Study Period | 2020-2034 |
| Base Year | 2025 |
| Estimated Year | 2026 |
| Forecast Period | 2026-2034 |
| Historical Period | 2020-2025 |
| Growth Rate | CAGR of > 8.00% from 2020-2034 |
| Segmentation |
|
Table of Contents
- 1. Introduction
- 1.1. Research Scope
- 1.2. Market Segmentation
- 1.3. Research Objective
- 1.4. Definitions and Assumptions
- 2. Executive Summary
- 2.1. Market Snapshot
- 3. Market Dynamics
- 3.1. Market Drivers
- 3.2. Market Restrains
- 3.3. Market Trends
- 3.4. Market Opportunities
- 4. Market Factor Analysis
- 4.1. Porters Five Forces
- 4.1.1. Bargaining Power of Suppliers
- 4.1.2. Bargaining Power of Buyers
- 4.1.3. Threat of New Entrants
- 4.1.4. Threat of Substitutes
- 4.1.5. Competitive Rivalry
- 4.2. PESTEL analysis
- 4.3. BCG Analysis
- 4.3.1. Stars (High Growth, High Market Share)
- 4.3.2. Cash Cows (Low Growth, High Market Share)
- 4.3.3. Question Mark (High Growth, Low Market Share)
- 4.3.4. Dogs (Low Growth, Low Market Share)
- 4.4. Ansoff Matrix Analysis
- 4.5. Supply Chain Analysis
- 4.6. Regulatory Landscape
- 4.7. Current Market Potential and Opportunity Assessment (TAM–SAM–SOM Framework)
- 4.8. RAX Analyst Note
- 4.1. Porters Five Forces
- 5. Market Analysis, Insights and Forecast 2021-2033
- 5.1. Market Analysis, Insights and Forecast - by Technology
- 5.1.1. Spun-Bond
- 5.1.2. Wet Laid
- 5.1.3. Dry Laid
- 5.1.4. Others (Electrostatic spinning, Flash-spun, etc.)
- 5.2. Market Analysis, Insights and Forecast - by Material
- 5.2.1. Polyester
- 5.2.2. Polypropylene
- 5.2.3. Polyethylene
- 5.2.4. Rayon
- 5.2.5. Others (Wood Pulp, Bio-Component, etc.)
- 5.3. Market Analysis, Insights and Forecast - by End-User Industry
- 5.3.1. Construction
- 5.3.2. Textiles
- 5.3.3. Healthcare
- 5.3.4. Automotive
- 5.3.5. Others (Personal Care, Consumer Goods, etc.)
- 5.4. Market Analysis, Insights and Forecast - by Geography
- 5.4.1. China
- 5.4.2. India
- 5.4.3. Japan
- 5.4.4. South Korea
- 5.4.5. Indonesia
- 5.4.6. Malaysia
- 5.4.7. Thailand
- 5.4.8. Vietnam
- 5.4.9. Rest of Asia-Pacific
- 5.5. Market Analysis, Insights and Forecast - by Region
- 5.5.1. China
- 5.5.2. India
- 5.5.3. Japan
- 5.5.4. South Korea
- 5.5.5. Indonesia
- 5.5.6. Malaysia
- 5.5.7. Thailand
- 5.5.8. Vietnam
- 5.5.9. Rest of Asia Pacific
- 5.1. Market Analysis, Insights and Forecast - by Technology
- 6. Global APAC Non-Woven Fabrics Industry Analysis, Insights and Forecast, 2021-2033
- 6.1. Market Analysis, Insights and Forecast - by Technology
- 6.1.1. Spun-Bond
- 6.1.2. Wet Laid
- 6.1.3. Dry Laid
- 6.1.4. Others (Electrostatic spinning, Flash-spun, etc.)
- 6.2. Market Analysis, Insights and Forecast - by Material
- 6.2.1. Polyester
- 6.2.2. Polypropylene
- 6.2.3. Polyethylene
- 6.2.4. Rayon
- 6.2.5. Others (Wood Pulp, Bio-Component, etc.)
- 6.3. Market Analysis, Insights and Forecast - by End-User Industry
- 6.3.1. Construction
- 6.3.2. Textiles
- 6.3.3. Healthcare
- 6.3.4. Automotive
- 6.3.5. Others (Personal Care, Consumer Goods, etc.)
- 6.4. Market Analysis, Insights and Forecast - by Geography
- 6.4.1. China
- 6.4.2. India
- 6.4.3. Japan
- 6.4.4. South Korea
- 6.4.5. Indonesia
- 6.4.6. Malaysia
- 6.4.7. Thailand
- 6.4.8. Vietnam
- 6.4.9. Rest of Asia-Pacific
- 6.1. Market Analysis, Insights and Forecast - by Technology
- 7. China APAC Non-Woven Fabrics Industry Analysis, Insights and Forecast, 2020-2032
- 7.1. Market Analysis, Insights and Forecast - by Technology
- 7.1.1. Spun-Bond
- 7.1.2. Wet Laid
- 7.1.3. Dry Laid
- 7.1.4. Others (Electrostatic spinning, Flash-spun, etc.)
- 7.2. Market Analysis, Insights and Forecast - by Material
- 7.2.1. Polyester
- 7.2.2. Polypropylene
- 7.2.3. Polyethylene
- 7.2.4. Rayon
- 7.2.5. Others (Wood Pulp, Bio-Component, etc.)
- 7.3. Market Analysis, Insights and Forecast - by End-User Industry
- 7.3.1. Construction
- 7.3.2. Textiles
- 7.3.3. Healthcare
- 7.3.4. Automotive
- 7.3.5. Others (Personal Care, Consumer Goods, etc.)
- 7.4. Market Analysis, Insights and Forecast - by Geography
- 7.4.1. China
- 7.4.2. India
- 7.4.3. Japan
- 7.4.4. South Korea
- 7.4.5. Indonesia
- 7.4.6. Malaysia
- 7.4.7. Thailand
- 7.4.8. Vietnam
- 7.4.9. Rest of Asia-Pacific
- 7.1. Market Analysis, Insights and Forecast - by Technology
- 8. India APAC Non-Woven Fabrics Industry Analysis, Insights and Forecast, 2020-2032
- 8.1. Market Analysis, Insights and Forecast - by Technology
- 8.1.1. Spun-Bond
- 8.1.2. Wet Laid
- 8.1.3. Dry Laid
- 8.1.4. Others (Electrostatic spinning, Flash-spun, etc.)
- 8.2. Market Analysis, Insights and Forecast - by Material
- 8.2.1. Polyester
- 8.2.2. Polypropylene
- 8.2.3. Polyethylene
- 8.2.4. Rayon
- 8.2.5. Others (Wood Pulp, Bio-Component, etc.)
- 8.3. Market Analysis, Insights and Forecast - by End-User Industry
- 8.3.1. Construction
- 8.3.2. Textiles
- 8.3.3. Healthcare
- 8.3.4. Automotive
- 8.3.5. Others (Personal Care, Consumer Goods, etc.)
- 8.4. Market Analysis, Insights and Forecast - by Geography
- 8.4.1. China
- 8.4.2. India
- 8.4.3. Japan
- 8.4.4. South Korea
- 8.4.5. Indonesia
- 8.4.6. Malaysia
- 8.4.7. Thailand
- 8.4.8. Vietnam
- 8.4.9. Rest of Asia-Pacific
- 8.1. Market Analysis, Insights and Forecast - by Technology
- 9. Japan APAC Non-Woven Fabrics Industry Analysis, Insights and Forecast, 2020-2032
- 9.1. Market Analysis, Insights and Forecast - by Technology
- 9.1.1. Spun-Bond
- 9.1.2. Wet Laid
- 9.1.3. Dry Laid
- 9.1.4. Others (Electrostatic spinning, Flash-spun, etc.)
- 9.2. Market Analysis, Insights and Forecast - by Material
- 9.2.1. Polyester
- 9.2.2. Polypropylene
- 9.2.3. Polyethylene
- 9.2.4. Rayon
- 9.2.5. Others (Wood Pulp, Bio-Component, etc.)
- 9.3. Market Analysis, Insights and Forecast - by End-User Industry
- 9.3.1. Construction
- 9.3.2. Textiles
- 9.3.3. Healthcare
- 9.3.4. Automotive
- 9.3.5. Others (Personal Care, Consumer Goods, etc.)
- 9.4. Market Analysis, Insights and Forecast - by Geography
- 9.4.1. China
- 9.4.2. India
- 9.4.3. Japan
- 9.4.4. South Korea
- 9.4.5. Indonesia
- 9.4.6. Malaysia
- 9.4.7. Thailand
- 9.4.8. Vietnam
- 9.4.9. Rest of Asia-Pacific
- 9.1. Market Analysis, Insights and Forecast - by Technology
- 10. South Korea APAC Non-Woven Fabrics Industry Analysis, Insights and Forecast, 2020-2032
- 10.1. Market Analysis, Insights and Forecast - by Technology
- 10.1.1. Spun-Bond
- 10.1.2. Wet Laid
- 10.1.3. Dry Laid
- 10.1.4. Others (Electrostatic spinning, Flash-spun, etc.)
- 10.2. Market Analysis, Insights and Forecast - by Material
- 10.2.1. Polyester
- 10.2.2. Polypropylene
- 10.2.3. Polyethylene
- 10.2.4. Rayon
- 10.2.5. Others (Wood Pulp, Bio-Component, etc.)
- 10.3. Market Analysis, Insights and Forecast - by End-User Industry
- 10.3.1. Construction
- 10.3.2. Textiles
- 10.3.3. Healthcare
- 10.3.4. Automotive
- 10.3.5. Others (Personal Care, Consumer Goods, etc.)
- 10.4. Market Analysis, Insights and Forecast - by Geography
- 10.4.1. China
- 10.4.2. India
- 10.4.3. Japan
- 10.4.4. South Korea
- 10.4.5. Indonesia
- 10.4.6. Malaysia
- 10.4.7. Thailand
- 10.4.8. Vietnam
- 10.4.9. Rest of Asia-Pacific
- 10.1. Market Analysis, Insights and Forecast - by Technology
- 11. Indonesia APAC Non-Woven Fabrics Industry Analysis, Insights and Forecast, 2020-2032
- 11.1. Market Analysis, Insights and Forecast - by Technology
- 11.1.1. Spun-Bond
- 11.1.2. Wet Laid
- 11.1.3. Dry Laid
- 11.1.4. Others (Electrostatic spinning, Flash-spun, etc.)
- 11.2. Market Analysis, Insights and Forecast - by Material
- 11.2.1. Polyester
- 11.2.2. Polypropylene
- 11.2.3. Polyethylene
- 11.2.4. Rayon
- 11.2.5. Others (Wood Pulp, Bio-Component, etc.)
- 11.3. Market Analysis, Insights and Forecast - by End-User Industry
- 11.3.1. Construction
- 11.3.2. Textiles
- 11.3.3. Healthcare
- 11.3.4. Automotive
- 11.3.5. Others (Personal Care, Consumer Goods, etc.)
- 11.4. Market Analysis, Insights and Forecast - by Geography
- 11.4.1. China
- 11.4.2. India
- 11.4.3. Japan
- 11.4.4. South Korea
- 11.4.5. Indonesia
- 11.4.6. Malaysia
- 11.4.7. Thailand
- 11.4.8. Vietnam
- 11.4.9. Rest of Asia-Pacific
- 11.1. Market Analysis, Insights and Forecast - by Technology
- 12. Malaysia APAC Non-Woven Fabrics Industry Analysis, Insights and Forecast, 2020-2032
- 12.1. Market Analysis, Insights and Forecast - by Technology
- 12.1.1. Spun-Bond
- 12.1.2. Wet Laid
- 12.1.3. Dry Laid
- 12.1.4. Others (Electrostatic spinning, Flash-spun, etc.)
- 12.2. Market Analysis, Insights and Forecast - by Material
- 12.2.1. Polyester
- 12.2.2. Polypropylene
- 12.2.3. Polyethylene
- 12.2.4. Rayon
- 12.2.5. Others (Wood Pulp, Bio-Component, etc.)
- 12.3. Market Analysis, Insights and Forecast - by End-User Industry
- 12.3.1. Construction
- 12.3.2. Textiles
- 12.3.3. Healthcare
- 12.3.4. Automotive
- 12.3.5. Others (Personal Care, Consumer Goods, etc.)
- 12.4. Market Analysis, Insights and Forecast - by Geography
- 12.4.1. China
- 12.4.2. India
- 12.4.3. Japan
- 12.4.4. South Korea
- 12.4.5. Indonesia
- 12.4.6. Malaysia
- 12.4.7. Thailand
- 12.4.8. Vietnam
- 12.4.9. Rest of Asia-Pacific
- 12.1. Market Analysis, Insights and Forecast - by Technology
- 13. Thailand APAC Non-Woven Fabrics Industry Analysis, Insights and Forecast, 2020-2032
- 13.1. Market Analysis, Insights and Forecast - by Technology
- 13.1.1. Spun-Bond
- 13.1.2. Wet Laid
- 13.1.3. Dry Laid
- 13.1.4. Others (Electrostatic spinning, Flash-spun, etc.)
- 13.2. Market Analysis, Insights and Forecast - by Material
- 13.2.1. Polyester
- 13.2.2. Polypropylene
- 13.2.3. Polyethylene
- 13.2.4. Rayon
- 13.2.5. Others (Wood Pulp, Bio-Component, etc.)
- 13.3. Market Analysis, Insights and Forecast - by End-User Industry
- 13.3.1. Construction
- 13.3.2. Textiles
- 13.3.3. Healthcare
- 13.3.4. Automotive
- 13.3.5. Others (Personal Care, Consumer Goods, etc.)
- 13.4. Market Analysis, Insights and Forecast - by Geography
- 13.4.1. China
- 13.4.2. India
- 13.4.3. Japan
- 13.4.4. South Korea
- 13.4.5. Indonesia
- 13.4.6. Malaysia
- 13.4.7. Thailand
- 13.4.8. Vietnam
- 13.4.9. Rest of Asia-Pacific
- 13.1. Market Analysis, Insights and Forecast - by Technology
- 14. Vietnam APAC Non-Woven Fabrics Industry Analysis, Insights and Forecast, 2020-2032
- 14.1. Market Analysis, Insights and Forecast - by Technology
- 14.1.1. Spun-Bond
- 14.1.2. Wet Laid
- 14.1.3. Dry Laid
- 14.1.4. Others (Electrostatic spinning, Flash-spun, etc.)
- 14.2. Market Analysis, Insights and Forecast - by Material
- 14.2.1. Polyester
- 14.2.2. Polypropylene
- 14.2.3. Polyethylene
- 14.2.4. Rayon
- 14.2.5. Others (Wood Pulp, Bio-Component, etc.)
- 14.3. Market Analysis, Insights and Forecast - by End-User Industry
- 14.3.1. Construction
- 14.3.2. Textiles
- 14.3.3. Healthcare
- 14.3.4. Automotive
- 14.3.5. Others (Personal Care, Consumer Goods, etc.)
- 14.4. Market Analysis, Insights and Forecast - by Geography
- 14.4.1. China
- 14.4.2. India
- 14.4.3. Japan
- 14.4.4. South Korea
- 14.4.5. Indonesia
- 14.4.6. Malaysia
- 14.4.7. Thailand
- 14.4.8. Vietnam
- 14.4.9. Rest of Asia-Pacific
- 14.1. Market Analysis, Insights and Forecast - by Technology
- 15. Rest of Asia Pacific APAC Non-Woven Fabrics Industry Analysis, Insights and Forecast, 2020-2032
- 15.1. Market Analysis, Insights and Forecast - by Technology
- 15.1.1. Spun-Bond
- 15.1.2. Wet Laid
- 15.1.3. Dry Laid
- 15.1.4. Others (Electrostatic spinning, Flash-spun, etc.)
- 15.2. Market Analysis, Insights and Forecast - by Material
- 15.2.1. Polyester
- 15.2.2. Polypropylene
- 15.2.3. Polyethylene
- 15.2.4. Rayon
- 15.2.5. Others (Wood Pulp, Bio-Component, etc.)
- 15.3. Market Analysis, Insights and Forecast - by End-User Industry
- 15.3.1. Construction
- 15.3.2. Textiles
- 15.3.3. Healthcare
- 15.3.4. Automotive
- 15.3.5. Others (Personal Care, Consumer Goods, etc.)
- 15.4. Market Analysis, Insights and Forecast - by Geography
- 15.4.1. China
- 15.4.2. India
- 15.4.3. Japan
- 15.4.4. South Korea
- 15.4.5. Indonesia
- 15.4.6. Malaysia
- 15.4.7. Thailand
- 15.4.8. Vietnam
- 15.4.9. Rest of Asia-Pacific
- 15.1. Market Analysis, Insights and Forecast - by Technology
- 16. Competitive Analysis
- 16.1. Company Profiles
- 16.1.1 Ahlstrom
- 16.1.1.1. Company Overview
- 16.1.1.2. Products
- 16.1.1.3. Company Financials
- 16.1.1.4. SWOT Analysis
- 16.1.2 Glatfelter Corporation
- 16.1.2.1. Company Overview
- 16.1.2.2. Products
- 16.1.2.3. Company Financials
- 16.1.2.4. SWOT Analysis
- 16.1.3 Global Non Wovens Limited
- 16.1.3.1. Company Overview
- 16.1.3.2. Products
- 16.1.3.3. Company Financials
- 16.1.3.4. SWOT Analysis
- 16.1.4 Ginni Filaments
- 16.1.4.1. Company Overview
- 16.1.4.2. Products
- 16.1.4.3. Company Financials
- 16.1.4.4. SWOT Analysis
- 16.1.5 Freudenberg Performance Materials
- 16.1.5.1. Company Overview
- 16.1.5.2. Products
- 16.1.5.3. Company Financials
- 16.1.5.4. SWOT Analysis
- 16.1.6 Cygnus Group
- 16.1.6.1. Company Overview
- 16.1.6.2. Products
- 16.1.6.3. Company Financials
- 16.1.6.4. SWOT Analysis
- 16.1.7 Eximius Innovative Pvt Ltd
- 16.1.7.1. Company Overview
- 16.1.7.2. Products
- 16.1.7.3. Company Financials
- 16.1.7.4. SWOT Analysis
- 16.1.8 Fitesa S A
- 16.1.8.1. Company Overview
- 16.1.8.2. Products
- 16.1.8.3. Company Financials
- 16.1.8.4. SWOT Analysis
- 16.1.9 DuPont
- 16.1.9.1. Company Overview
- 16.1.9.2. Products
- 16.1.9.3. Company Financials
- 16.1.9.4. SWOT Analysis
- 16.1.10 Autotech Nonwovens Pvt Ltd
- 16.1.10.1. Company Overview
- 16.1.10.2. Products
- 16.1.10.3. Company Financials
- 16.1.10.4. SWOT Analysis
- 16.1.11 TORAY INDUSTRIES INC *List Not Exhaustive
- 16.1.11.1. Company Overview
- 16.1.11.2. Products
- 16.1.11.3. Company Financials
- 16.1.11.4. SWOT Analysis
- 16.1.12 Johns Manville
- 16.1.12.1. Company Overview
- 16.1.12.2. Products
- 16.1.12.3. Company Financials
- 16.1.12.4. SWOT Analysis
- 16.1.13 Berry Global Inc
- 16.1.13.1. Company Overview
- 16.1.13.2. Products
- 16.1.13.3. Company Financials
- 16.1.13.4. SWOT Analysis
- 16.1.14 Reliance Non-woven Industry LLC
- 16.1.14.1. Company Overview
- 16.1.14.2. Products
- 16.1.14.3. Company Financials
- 16.1.14.4. SWOT Analysis
- 16.1.1 Ahlstrom
- 16.2. Market Entropy
- 16.2.1 Company's Key Areas Served
- 16.2.2 Recent Developments
- 16.3. Company Market Share Analysis 2025
- 16.3.1 Top 5 Companies Market Share Analysis
- 16.3.2 Top 3 Companies Market Share Analysis
- 16.4. List of Potential Customers
- 17. Research Methodology
List of Figures
- Figure 1: Global APAC Non-Woven Fabrics Industry Revenue Breakdown (Million, %) by Region 2025 & 2033
- Figure 2: Global APAC Non-Woven Fabrics Industry Volume Breakdown (K Tons, %) by Region 2025 & 2033
- Figure 3: China APAC Non-Woven Fabrics Industry Revenue (Million), by Technology 2025 & 2033
- Figure 4: China APAC Non-Woven Fabrics Industry Volume (K Tons), by Technology 2025 & 2033
- Figure 5: China APAC Non-Woven Fabrics Industry Revenue Share (%), by Technology 2025 & 2033
- Figure 6: China APAC Non-Woven Fabrics Industry Volume Share (%), by Technology 2025 & 2033
- Figure 7: China APAC Non-Woven Fabrics Industry Revenue (Million), by Material 2025 & 2033
- Figure 8: China APAC Non-Woven Fabrics Industry Volume (K Tons), by Material 2025 & 2033
- Figure 9: China APAC Non-Woven Fabrics Industry Revenue Share (%), by Material 2025 & 2033
- Figure 10: China APAC Non-Woven Fabrics Industry Volume Share (%), by Material 2025 & 2033
- Figure 11: China APAC Non-Woven Fabrics Industry Revenue (Million), by End-User Industry 2025 & 2033
- Figure 12: China APAC Non-Woven Fabrics Industry Volume (K Tons), by End-User Industry 2025 & 2033
- Figure 13: China APAC Non-Woven Fabrics Industry Revenue Share (%), by End-User Industry 2025 & 2033
- Figure 14: China APAC Non-Woven Fabrics Industry Volume Share (%), by End-User Industry 2025 & 2033
- Figure 15: China APAC Non-Woven Fabrics Industry Revenue (Million), by Geography 2025 & 2033
- Figure 16: China APAC Non-Woven Fabrics Industry Volume (K Tons), by Geography 2025 & 2033
- Figure 17: China APAC Non-Woven Fabrics Industry Revenue Share (%), by Geography 2025 & 2033
- Figure 18: China APAC Non-Woven Fabrics Industry Volume Share (%), by Geography 2025 & 2033
- Figure 19: China APAC Non-Woven Fabrics Industry Revenue (Million), by Country 2025 & 2033
- Figure 20: China APAC Non-Woven Fabrics Industry Volume (K Tons), by Country 2025 & 2033
- Figure 21: China APAC Non-Woven Fabrics Industry Revenue Share (%), by Country 2025 & 2033
- Figure 22: China APAC Non-Woven Fabrics Industry Volume Share (%), by Country 2025 & 2033
- Figure 23: India APAC Non-Woven Fabrics Industry Revenue (Million), by Technology 2025 & 2033
- Figure 24: India APAC Non-Woven Fabrics Industry Volume (K Tons), by Technology 2025 & 2033
- Figure 25: India APAC Non-Woven Fabrics Industry Revenue Share (%), by Technology 2025 & 2033
- Figure 26: India APAC Non-Woven Fabrics Industry Volume Share (%), by Technology 2025 & 2033
- Figure 27: India APAC Non-Woven Fabrics Industry Revenue (Million), by Material 2025 & 2033
- Figure 28: India APAC Non-Woven Fabrics Industry Volume (K Tons), by Material 2025 & 2033
- Figure 29: India APAC Non-Woven Fabrics Industry Revenue Share (%), by Material 2025 & 2033
- Figure 30: India APAC Non-Woven Fabrics Industry Volume Share (%), by Material 2025 & 2033
- Figure 31: India APAC Non-Woven Fabrics Industry Revenue (Million), by End-User Industry 2025 & 2033
- Figure 32: India APAC Non-Woven Fabrics Industry Volume (K Tons), by End-User Industry 2025 & 2033
- Figure 33: India APAC Non-Woven Fabrics Industry Revenue Share (%), by End-User Industry 2025 & 2033
- Figure 34: India APAC Non-Woven Fabrics Industry Volume Share (%), by End-User Industry 2025 & 2033
- Figure 35: India APAC Non-Woven Fabrics Industry Revenue (Million), by Geography 2025 & 2033
- Figure 36: India APAC Non-Woven Fabrics Industry Volume (K Tons), by Geography 2025 & 2033
- Figure 37: India APAC Non-Woven Fabrics Industry Revenue Share (%), by Geography 2025 & 2033
- Figure 38: India APAC Non-Woven Fabrics Industry Volume Share (%), by Geography 2025 & 2033
- Figure 39: India APAC Non-Woven Fabrics Industry Revenue (Million), by Country 2025 & 2033
- Figure 40: India APAC Non-Woven Fabrics Industry Volume (K Tons), by Country 2025 & 2033
- Figure 41: India APAC Non-Woven Fabrics Industry Revenue Share (%), by Country 2025 & 2033
- Figure 42: India APAC Non-Woven Fabrics Industry Volume Share (%), by Country 2025 & 2033
- Figure 43: Japan APAC Non-Woven Fabrics Industry Revenue (Million), by Technology 2025 & 2033
- Figure 44: Japan APAC Non-Woven Fabrics Industry Volume (K Tons), by Technology 2025 & 2033
- Figure 45: Japan APAC Non-Woven Fabrics Industry Revenue Share (%), by Technology 2025 & 2033
- Figure 46: Japan APAC Non-Woven Fabrics Industry Volume Share (%), by Technology 2025 & 2033
- Figure 47: Japan APAC Non-Woven Fabrics Industry Revenue (Million), by Material 2025 & 2033
- Figure 48: Japan APAC Non-Woven Fabrics Industry Volume (K Tons), by Material 2025 & 2033
- Figure 49: Japan APAC Non-Woven Fabrics Industry Revenue Share (%), by Material 2025 & 2033
- Figure 50: Japan APAC Non-Woven Fabrics Industry Volume Share (%), by Material 2025 & 2033
- Figure 51: Japan APAC Non-Woven Fabrics Industry Revenue (Million), by End-User Industry 2025 & 2033
- Figure 52: Japan APAC Non-Woven Fabrics Industry Volume (K Tons), by End-User Industry 2025 & 2033
- Figure 53: Japan APAC Non-Woven Fabrics Industry Revenue Share (%), by End-User Industry 2025 & 2033
- Figure 54: Japan APAC Non-Woven Fabrics Industry Volume Share (%), by End-User Industry 2025 & 2033
- Figure 55: Japan APAC Non-Woven Fabrics Industry Revenue (Million), by Geography 2025 & 2033
- Figure 56: Japan APAC Non-Woven Fabrics Industry Volume (K Tons), by Geography 2025 & 2033
- Figure 57: Japan APAC Non-Woven Fabrics Industry Revenue Share (%), by Geography 2025 & 2033
- Figure 58: Japan APAC Non-Woven Fabrics Industry Volume Share (%), by Geography 2025 & 2033
- Figure 59: Japan APAC Non-Woven Fabrics Industry Revenue (Million), by Country 2025 & 2033
- Figure 60: Japan APAC Non-Woven Fabrics Industry Volume (K Tons), by Country 2025 & 2033
- Figure 61: Japan APAC Non-Woven Fabrics Industry Revenue Share (%), by Country 2025 & 2033
- Figure 62: Japan APAC Non-Woven Fabrics Industry Volume Share (%), by Country 2025 & 2033
- Figure 63: South Korea APAC Non-Woven Fabrics Industry Revenue (Million), by Technology 2025 & 2033
- Figure 64: South Korea APAC Non-Woven Fabrics Industry Volume (K Tons), by Technology 2025 & 2033
- Figure 65: South Korea APAC Non-Woven Fabrics Industry Revenue Share (%), by Technology 2025 & 2033
- Figure 66: South Korea APAC Non-Woven Fabrics Industry Volume Share (%), by Technology 2025 & 2033
- Figure 67: South Korea APAC Non-Woven Fabrics Industry Revenue (Million), by Material 2025 & 2033
- Figure 68: South Korea APAC Non-Woven Fabrics Industry Volume (K Tons), by Material 2025 & 2033
- Figure 69: South Korea APAC Non-Woven Fabrics Industry Revenue Share (%), by Material 2025 & 2033
- Figure 70: South Korea APAC Non-Woven Fabrics Industry Volume Share (%), by Material 2025 & 2033
- Figure 71: South Korea APAC Non-Woven Fabrics Industry Revenue (Million), by End-User Industry 2025 & 2033
- Figure 72: South Korea APAC Non-Woven Fabrics Industry Volume (K Tons), by End-User Industry 2025 & 2033
- Figure 73: South Korea APAC Non-Woven Fabrics Industry Revenue Share (%), by End-User Industry 2025 & 2033
- Figure 74: South Korea APAC Non-Woven Fabrics Industry Volume Share (%), by End-User Industry 2025 & 2033
- Figure 75: South Korea APAC Non-Woven Fabrics Industry Revenue (Million), by Geography 2025 & 2033
- Figure 76: South Korea APAC Non-Woven Fabrics Industry Volume (K Tons), by Geography 2025 & 2033
- Figure 77: South Korea APAC Non-Woven Fabrics Industry Revenue Share (%), by Geography 2025 & 2033
- Figure 78: South Korea APAC Non-Woven Fabrics Industry Volume Share (%), by Geography 2025 & 2033
- Figure 79: South Korea APAC Non-Woven Fabrics Industry Revenue (Million), by Country 2025 & 2033
- Figure 80: South Korea APAC Non-Woven Fabrics Industry Volume (K Tons), by Country 2025 & 2033
- Figure 81: South Korea APAC Non-Woven Fabrics Industry Revenue Share (%), by Country 2025 & 2033
- Figure 82: South Korea APAC Non-Woven Fabrics Industry Volume Share (%), by Country 2025 & 2033
- Figure 83: Indonesia APAC Non-Woven Fabrics Industry Revenue (Million), by Technology 2025 & 2033
- Figure 84: Indonesia APAC Non-Woven Fabrics Industry Volume (K Tons), by Technology 2025 & 2033
- Figure 85: Indonesia APAC Non-Woven Fabrics Industry Revenue Share (%), by Technology 2025 & 2033
- Figure 86: Indonesia APAC Non-Woven Fabrics Industry Volume Share (%), by Technology 2025 & 2033
- Figure 87: Indonesia APAC Non-Woven Fabrics Industry Revenue (Million), by Material 2025 & 2033
- Figure 88: Indonesia APAC Non-Woven Fabrics Industry Volume (K Tons), by Material 2025 & 2033
- Figure 89: Indonesia APAC Non-Woven Fabrics Industry Revenue Share (%), by Material 2025 & 2033
- Figure 90: Indonesia APAC Non-Woven Fabrics Industry Volume Share (%), by Material 2025 & 2033
- Figure 91: Indonesia APAC Non-Woven Fabrics Industry Revenue (Million), by End-User Industry 2025 & 2033
- Figure 92: Indonesia APAC Non-Woven Fabrics Industry Volume (K Tons), by End-User Industry 2025 & 2033
- Figure 93: Indonesia APAC Non-Woven Fabrics Industry Revenue Share (%), by End-User Industry 2025 & 2033
- Figure 94: Indonesia APAC Non-Woven Fabrics Industry Volume Share (%), by End-User Industry 2025 & 2033
- Figure 95: Indonesia APAC Non-Woven Fabrics Industry Revenue (Million), by Geography 2025 & 2033
- Figure 96: Indonesia APAC Non-Woven Fabrics Industry Volume (K Tons), by Geography 2025 & 2033
- Figure 97: Indonesia APAC Non-Woven Fabrics Industry Revenue Share (%), by Geography 2025 & 2033
- Figure 98: Indonesia APAC Non-Woven Fabrics Industry Volume Share (%), by Geography 2025 & 2033
- Figure 99: Indonesia APAC Non-Woven Fabrics Industry Revenue (Million), by Country 2025 & 2033
- Figure 100: Indonesia APAC Non-Woven Fabrics Industry Volume (K Tons), by Country 2025 & 2033
- Figure 101: Indonesia APAC Non-Woven Fabrics Industry Revenue Share (%), by Country 2025 & 2033
- Figure 102: Indonesia APAC Non-Woven Fabrics Industry Volume Share (%), by Country 2025 & 2033
- Figure 103: Malaysia APAC Non-Woven Fabrics Industry Revenue (Million), by Technology 2025 & 2033
- Figure 104: Malaysia APAC Non-Woven Fabrics Industry Volume (K Tons), by Technology 2025 & 2033
- Figure 105: Malaysia APAC Non-Woven Fabrics Industry Revenue Share (%), by Technology 2025 & 2033
- Figure 106: Malaysia APAC Non-Woven Fabrics Industry Volume Share (%), by Technology 2025 & 2033
- Figure 107: Malaysia APAC Non-Woven Fabrics Industry Revenue (Million), by Material 2025 & 2033
- Figure 108: Malaysia APAC Non-Woven Fabrics Industry Volume (K Tons), by Material 2025 & 2033
- Figure 109: Malaysia APAC Non-Woven Fabrics Industry Revenue Share (%), by Material 2025 & 2033
- Figure 110: Malaysia APAC Non-Woven Fabrics Industry Volume Share (%), by Material 2025 & 2033
- Figure 111: Malaysia APAC Non-Woven Fabrics Industry Revenue (Million), by End-User Industry 2025 & 2033
- Figure 112: Malaysia APAC Non-Woven Fabrics Industry Volume (K Tons), by End-User Industry 2025 & 2033
- Figure 113: Malaysia APAC Non-Woven Fabrics Industry Revenue Share (%), by End-User Industry 2025 & 2033
- Figure 114: Malaysia APAC Non-Woven Fabrics Industry Volume Share (%), by End-User Industry 2025 & 2033
- Figure 115: Malaysia APAC Non-Woven Fabrics Industry Revenue (Million), by Geography 2025 & 2033
- Figure 116: Malaysia APAC Non-Woven Fabrics Industry Volume (K Tons), by Geography 2025 & 2033
- Figure 117: Malaysia APAC Non-Woven Fabrics Industry Revenue Share (%), by Geography 2025 & 2033
- Figure 118: Malaysia APAC Non-Woven Fabrics Industry Volume Share (%), by Geography 2025 & 2033
- Figure 119: Malaysia APAC Non-Woven Fabrics Industry Revenue (Million), by Country 2025 & 2033
- Figure 120: Malaysia APAC Non-Woven Fabrics Industry Volume (K Tons), by Country 2025 & 2033
- Figure 121: Malaysia APAC Non-Woven Fabrics Industry Revenue Share (%), by Country 2025 & 2033
- Figure 122: Malaysia APAC Non-Woven Fabrics Industry Volume Share (%), by Country 2025 & 2033
- Figure 123: Thailand APAC Non-Woven Fabrics Industry Revenue (Million), by Technology 2025 & 2033
- Figure 124: Thailand APAC Non-Woven Fabrics Industry Volume (K Tons), by Technology 2025 & 2033
- Figure 125: Thailand APAC Non-Woven Fabrics Industry Revenue Share (%), by Technology 2025 & 2033
- Figure 126: Thailand APAC Non-Woven Fabrics Industry Volume Share (%), by Technology 2025 & 2033
- Figure 127: Thailand APAC Non-Woven Fabrics Industry Revenue (Million), by Material 2025 & 2033
- Figure 128: Thailand APAC Non-Woven Fabrics Industry Volume (K Tons), by Material 2025 & 2033
- Figure 129: Thailand APAC Non-Woven Fabrics Industry Revenue Share (%), by Material 2025 & 2033
- Figure 130: Thailand APAC Non-Woven Fabrics Industry Volume Share (%), by Material 2025 & 2033
- Figure 131: Thailand APAC Non-Woven Fabrics Industry Revenue (Million), by End-User Industry 2025 & 2033
- Figure 132: Thailand APAC Non-Woven Fabrics Industry Volume (K Tons), by End-User Industry 2025 & 2033
- Figure 133: Thailand APAC Non-Woven Fabrics Industry Revenue Share (%), by End-User Industry 2025 & 2033
- Figure 134: Thailand APAC Non-Woven Fabrics Industry Volume Share (%), by End-User Industry 2025 & 2033
- Figure 135: Thailand APAC Non-Woven Fabrics Industry Revenue (Million), by Geography 2025 & 2033
- Figure 136: Thailand APAC Non-Woven Fabrics Industry Volume (K Tons), by Geography 2025 & 2033
- Figure 137: Thailand APAC Non-Woven Fabrics Industry Revenue Share (%), by Geography 2025 & 2033
- Figure 138: Thailand APAC Non-Woven Fabrics Industry Volume Share (%), by Geography 2025 & 2033
- Figure 139: Thailand APAC Non-Woven Fabrics Industry Revenue (Million), by Country 2025 & 2033
- Figure 140: Thailand APAC Non-Woven Fabrics Industry Volume (K Tons), by Country 2025 & 2033
- Figure 141: Thailand APAC Non-Woven Fabrics Industry Revenue Share (%), by Country 2025 & 2033
- Figure 142: Thailand APAC Non-Woven Fabrics Industry Volume Share (%), by Country 2025 & 2033
- Figure 143: Vietnam APAC Non-Woven Fabrics Industry Revenue (Million), by Technology 2025 & 2033
- Figure 144: Vietnam APAC Non-Woven Fabrics Industry Volume (K Tons), by Technology 2025 & 2033
- Figure 145: Vietnam APAC Non-Woven Fabrics Industry Revenue Share (%), by Technology 2025 & 2033
- Figure 146: Vietnam APAC Non-Woven Fabrics Industry Volume Share (%), by Technology 2025 & 2033
- Figure 147: Vietnam APAC Non-Woven Fabrics Industry Revenue (Million), by Material 2025 & 2033
- Figure 148: Vietnam APAC Non-Woven Fabrics Industry Volume (K Tons), by Material 2025 & 2033
- Figure 149: Vietnam APAC Non-Woven Fabrics Industry Revenue Share (%), by Material 2025 & 2033
- Figure 150: Vietnam APAC Non-Woven Fabrics Industry Volume Share (%), by Material 2025 & 2033
- Figure 151: Vietnam APAC Non-Woven Fabrics Industry Revenue (Million), by End-User Industry 2025 & 2033
- Figure 152: Vietnam APAC Non-Woven Fabrics Industry Volume (K Tons), by End-User Industry 2025 & 2033
- Figure 153: Vietnam APAC Non-Woven Fabrics Industry Revenue Share (%), by End-User Industry 2025 & 2033
- Figure 154: Vietnam APAC Non-Woven Fabrics Industry Volume Share (%), by End-User Industry 2025 & 2033
- Figure 155: Vietnam APAC Non-Woven Fabrics Industry Revenue (Million), by Geography 2025 & 2033
- Figure 156: Vietnam APAC Non-Woven Fabrics Industry Volume (K Tons), by Geography 2025 & 2033
- Figure 157: Vietnam APAC Non-Woven Fabrics Industry Revenue Share (%), by Geography 2025 & 2033
- Figure 158: Vietnam APAC Non-Woven Fabrics Industry Volume Share (%), by Geography 2025 & 2033
- Figure 159: Vietnam APAC Non-Woven Fabrics Industry Revenue (Million), by Country 2025 & 2033
- Figure 160: Vietnam APAC Non-Woven Fabrics Industry Volume (K Tons), by Country 2025 & 2033
- Figure 161: Vietnam APAC Non-Woven Fabrics Industry Revenue Share (%), by Country 2025 & 2033
- Figure 162: Vietnam APAC Non-Woven Fabrics Industry Volume Share (%), by Country 2025 & 2033
- Figure 163: Rest of Asia Pacific APAC Non-Woven Fabrics Industry Revenue (Million), by Technology 2025 & 2033
- Figure 164: Rest of Asia Pacific APAC Non-Woven Fabrics Industry Volume (K Tons), by Technology 2025 & 2033
- Figure 165: Rest of Asia Pacific APAC Non-Woven Fabrics Industry Revenue Share (%), by Technology 2025 & 2033
- Figure 166: Rest of Asia Pacific APAC Non-Woven Fabrics Industry Volume Share (%), by Technology 2025 & 2033
- Figure 167: Rest of Asia Pacific APAC Non-Woven Fabrics Industry Revenue (Million), by Material 2025 & 2033
- Figure 168: Rest of Asia Pacific APAC Non-Woven Fabrics Industry Volume (K Tons), by Material 2025 & 2033
- Figure 169: Rest of Asia Pacific APAC Non-Woven Fabrics Industry Revenue Share (%), by Material 2025 & 2033
- Figure 170: Rest of Asia Pacific APAC Non-Woven Fabrics Industry Volume Share (%), by Material 2025 & 2033
- Figure 171: Rest of Asia Pacific APAC Non-Woven Fabrics Industry Revenue (Million), by End-User Industry 2025 & 2033
- Figure 172: Rest of Asia Pacific APAC Non-Woven Fabrics Industry Volume (K Tons), by End-User Industry 2025 & 2033
- Figure 173: Rest of Asia Pacific APAC Non-Woven Fabrics Industry Revenue Share (%), by End-User Industry 2025 & 2033
- Figure 174: Rest of Asia Pacific APAC Non-Woven Fabrics Industry Volume Share (%), by End-User Industry 2025 & 2033
- Figure 175: Rest of Asia Pacific APAC Non-Woven Fabrics Industry Revenue (Million), by Geography 2025 & 2033
- Figure 176: Rest of Asia Pacific APAC Non-Woven Fabrics Industry Volume (K Tons), by Geography 2025 & 2033
- Figure 177: Rest of Asia Pacific APAC Non-Woven Fabrics Industry Revenue Share (%), by Geography 2025 & 2033
- Figure 178: Rest of Asia Pacific APAC Non-Woven Fabrics Industry Volume Share (%), by Geography 2025 & 2033
- Figure 179: Rest of Asia Pacific APAC Non-Woven Fabrics Industry Revenue (Million), by Country 2025 & 2033
- Figure 180: Rest of Asia Pacific APAC Non-Woven Fabrics Industry Volume (K Tons), by Country 2025 & 2033
- Figure 181: Rest of Asia Pacific APAC Non-Woven Fabrics Industry Revenue Share (%), by Country 2025 & 2033
- Figure 182: Rest of Asia Pacific APAC Non-Woven Fabrics Industry Volume Share (%), by Country 2025 & 2033
List of Tables
- Table 1: Global APAC Non-Woven Fabrics Industry Revenue Million Forecast, by Technology 2020 & 2033
- Table 2: Global APAC Non-Woven Fabrics Industry Volume K Tons Forecast, by Technology 2020 & 2033
- Table 3: Global APAC Non-Woven Fabrics Industry Revenue Million Forecast, by Material 2020 & 2033
- Table 4: Global APAC Non-Woven Fabrics Industry Volume K Tons Forecast, by Material 2020 & 2033
- Table 5: Global APAC Non-Woven Fabrics Industry Revenue Million Forecast, by End-User Industry 2020 & 2033
- Table 6: Global APAC Non-Woven Fabrics Industry Volume K Tons Forecast, by End-User Industry 2020 & 2033
- Table 7: Global APAC Non-Woven Fabrics Industry Revenue Million Forecast, by Geography 2020 & 2033
- Table 8: Global APAC Non-Woven Fabrics Industry Volume K Tons Forecast, by Geography 2020 & 2033
- Table 9: Global APAC Non-Woven Fabrics Industry Revenue Million Forecast, by Region 2020 & 2033
- Table 10: Global APAC Non-Woven Fabrics Industry Volume K Tons Forecast, by Region 2020 & 2033
- Table 11: Global APAC Non-Woven Fabrics Industry Revenue Million Forecast, by Technology 2020 & 2033
- Table 12: Global APAC Non-Woven Fabrics Industry Volume K Tons Forecast, by Technology 2020 & 2033
- Table 13: Global APAC Non-Woven Fabrics Industry Revenue Million Forecast, by Material 2020 & 2033
- Table 14: Global APAC Non-Woven Fabrics Industry Volume K Tons Forecast, by Material 2020 & 2033
- Table 15: Global APAC Non-Woven Fabrics Industry Revenue Million Forecast, by End-User Industry 2020 & 2033
- Table 16: Global APAC Non-Woven Fabrics Industry Volume K Tons Forecast, by End-User Industry 2020 & 2033
- Table 17: Global APAC Non-Woven Fabrics Industry Revenue Million Forecast, by Geography 2020 & 2033
- Table 18: Global APAC Non-Woven Fabrics Industry Volume K Tons Forecast, by Geography 2020 & 2033
- Table 19: Global APAC Non-Woven Fabrics Industry Revenue Million Forecast, by Country 2020 & 2033
- Table 20: Global APAC Non-Woven Fabrics Industry Volume K Tons Forecast, by Country 2020 & 2033
- Table 21: Global APAC Non-Woven Fabrics Industry Revenue Million Forecast, by Technology 2020 & 2033
- Table 22: Global APAC Non-Woven Fabrics Industry Volume K Tons Forecast, by Technology 2020 & 2033
- Table 23: Global APAC Non-Woven Fabrics Industry Revenue Million Forecast, by Material 2020 & 2033
- Table 24: Global APAC Non-Woven Fabrics Industry Volume K Tons Forecast, by Material 2020 & 2033
- Table 25: Global APAC Non-Woven Fabrics Industry Revenue Million Forecast, by End-User Industry 2020 & 2033
- Table 26: Global APAC Non-Woven Fabrics Industry Volume K Tons Forecast, by End-User Industry 2020 & 2033
- Table 27: Global APAC Non-Woven Fabrics Industry Revenue Million Forecast, by Geography 2020 & 2033
- Table 28: Global APAC Non-Woven Fabrics Industry Volume K Tons Forecast, by Geography 2020 & 2033
- Table 29: Global APAC Non-Woven Fabrics Industry Revenue Million Forecast, by Country 2020 & 2033
- Table 30: Global APAC Non-Woven Fabrics Industry Volume K Tons Forecast, by Country 2020 & 2033
- Table 31: Global APAC Non-Woven Fabrics Industry Revenue Million Forecast, by Technology 2020 & 2033
- Table 32: Global APAC Non-Woven Fabrics Industry Volume K Tons Forecast, by Technology 2020 & 2033
- Table 33: Global APAC Non-Woven Fabrics Industry Revenue Million Forecast, by Material 2020 & 2033
- Table 34: Global APAC Non-Woven Fabrics Industry Volume K Tons Forecast, by Material 2020 & 2033
- Table 35: Global APAC Non-Woven Fabrics Industry Revenue Million Forecast, by End-User Industry 2020 & 2033
- Table 36: Global APAC Non-Woven Fabrics Industry Volume K Tons Forecast, by End-User Industry 2020 & 2033
- Table 37: Global APAC Non-Woven Fabrics Industry Revenue Million Forecast, by Geography 2020 & 2033
- Table 38: Global APAC Non-Woven Fabrics Industry Volume K Tons Forecast, by Geography 2020 & 2033
- Table 39: Global APAC Non-Woven Fabrics Industry Revenue Million Forecast, by Country 2020 & 2033
- Table 40: Global APAC Non-Woven Fabrics Industry Volume K Tons Forecast, by Country 2020 & 2033
- Table 41: Global APAC Non-Woven Fabrics Industry Revenue Million Forecast, by Technology 2020 & 2033
- Table 42: Global APAC Non-Woven Fabrics Industry Volume K Tons Forecast, by Technology 2020 & 2033
- Table 43: Global APAC Non-Woven Fabrics Industry Revenue Million Forecast, by Material 2020 & 2033
- Table 44: Global APAC Non-Woven Fabrics Industry Volume K Tons Forecast, by Material 2020 & 2033
- Table 45: Global APAC Non-Woven Fabrics Industry Revenue Million Forecast, by End-User Industry 2020 & 2033
- Table 46: Global APAC Non-Woven Fabrics Industry Volume K Tons Forecast, by End-User Industry 2020 & 2033
- Table 47: Global APAC Non-Woven Fabrics Industry Revenue Million Forecast, by Geography 2020 & 2033
- Table 48: Global APAC Non-Woven Fabrics Industry Volume K Tons Forecast, by Geography 2020 & 2033
- Table 49: Global APAC Non-Woven Fabrics Industry Revenue Million Forecast, by Country 2020 & 2033
- Table 50: Global APAC Non-Woven Fabrics Industry Volume K Tons Forecast, by Country 2020 & 2033
- Table 51: Global APAC Non-Woven Fabrics Industry Revenue Million Forecast, by Technology 2020 & 2033
- Table 52: Global APAC Non-Woven Fabrics Industry Volume K Tons Forecast, by Technology 2020 & 2033
- Table 53: Global APAC Non-Woven Fabrics Industry Revenue Million Forecast, by Material 2020 & 2033
- Table 54: Global APAC Non-Woven Fabrics Industry Volume K Tons Forecast, by Material 2020 & 2033
- Table 55: Global APAC Non-Woven Fabrics Industry Revenue Million Forecast, by End-User Industry 2020 & 2033
- Table 56: Global APAC Non-Woven Fabrics Industry Volume K Tons Forecast, by End-User Industry 2020 & 2033
- Table 57: Global APAC Non-Woven Fabrics Industry Revenue Million Forecast, by Geography 2020 & 2033
- Table 58: Global APAC Non-Woven Fabrics Industry Volume K Tons Forecast, by Geography 2020 & 2033
- Table 59: Global APAC Non-Woven Fabrics Industry Revenue Million Forecast, by Country 2020 & 2033
- Table 60: Global APAC Non-Woven Fabrics Industry Volume K Tons Forecast, by Country 2020 & 2033
- Table 61: Global APAC Non-Woven Fabrics Industry Revenue Million Forecast, by Technology 2020 & 2033
- Table 62: Global APAC Non-Woven Fabrics Industry Volume K Tons Forecast, by Technology 2020 & 2033
- Table 63: Global APAC Non-Woven Fabrics Industry Revenue Million Forecast, by Material 2020 & 2033
- Table 64: Global APAC Non-Woven Fabrics Industry Volume K Tons Forecast, by Material 2020 & 2033
- Table 65: Global APAC Non-Woven Fabrics Industry Revenue Million Forecast, by End-User Industry 2020 & 2033
- Table 66: Global APAC Non-Woven Fabrics Industry Volume K Tons Forecast, by End-User Industry 2020 & 2033
- Table 67: Global APAC Non-Woven Fabrics Industry Revenue Million Forecast, by Geography 2020 & 2033
- Table 68: Global APAC Non-Woven Fabrics Industry Volume K Tons Forecast, by Geography 2020 & 2033
- Table 69: Global APAC Non-Woven Fabrics Industry Revenue Million Forecast, by Country 2020 & 2033
- Table 70: Global APAC Non-Woven Fabrics Industry Volume K Tons Forecast, by Country 2020 & 2033
- Table 71: Global APAC Non-Woven Fabrics Industry Revenue Million Forecast, by Technology 2020 & 2033
- Table 72: Global APAC Non-Woven Fabrics Industry Volume K Tons Forecast, by Technology 2020 & 2033
- Table 73: Global APAC Non-Woven Fabrics Industry Revenue Million Forecast, by Material 2020 & 2033
- Table 74: Global APAC Non-Woven Fabrics Industry Volume K Tons Forecast, by Material 2020 & 2033
- Table 75: Global APAC Non-Woven Fabrics Industry Revenue Million Forecast, by End-User Industry 2020 & 2033
- Table 76: Global APAC Non-Woven Fabrics Industry Volume K Tons Forecast, by End-User Industry 2020 & 2033
- Table 77: Global APAC Non-Woven Fabrics Industry Revenue Million Forecast, by Geography 2020 & 2033
- Table 78: Global APAC Non-Woven Fabrics Industry Volume K Tons Forecast, by Geography 2020 & 2033
- Table 79: Global APAC Non-Woven Fabrics Industry Revenue Million Forecast, by Country 2020 & 2033
- Table 80: Global APAC Non-Woven Fabrics Industry Volume K Tons Forecast, by Country 2020 & 2033
- Table 81: Global APAC Non-Woven Fabrics Industry Revenue Million Forecast, by Technology 2020 & 2033
- Table 82: Global APAC Non-Woven Fabrics Industry Volume K Tons Forecast, by Technology 2020 & 2033
- Table 83: Global APAC Non-Woven Fabrics Industry Revenue Million Forecast, by Material 2020 & 2033
- Table 84: Global APAC Non-Woven Fabrics Industry Volume K Tons Forecast, by Material 2020 & 2033
- Table 85: Global APAC Non-Woven Fabrics Industry Revenue Million Forecast, by End-User Industry 2020 & 2033
- Table 86: Global APAC Non-Woven Fabrics Industry Volume K Tons Forecast, by End-User Industry 2020 & 2033
- Table 87: Global APAC Non-Woven Fabrics Industry Revenue Million Forecast, by Geography 2020 & 2033
- Table 88: Global APAC Non-Woven Fabrics Industry Volume K Tons Forecast, by Geography 2020 & 2033
- Table 89: Global APAC Non-Woven Fabrics Industry Revenue Million Forecast, by Country 2020 & 2033
- Table 90: Global APAC Non-Woven Fabrics Industry Volume K Tons Forecast, by Country 2020 & 2033
- Table 91: Global APAC Non-Woven Fabrics Industry Revenue Million Forecast, by Technology 2020 & 2033
- Table 92: Global APAC Non-Woven Fabrics Industry Volume K Tons Forecast, by Technology 2020 & 2033
- Table 93: Global APAC Non-Woven Fabrics Industry Revenue Million Forecast, by Material 2020 & 2033
- Table 94: Global APAC Non-Woven Fabrics Industry Volume K Tons Forecast, by Material 2020 & 2033
- Table 95: Global APAC Non-Woven Fabrics Industry Revenue Million Forecast, by End-User Industry 2020 & 2033
- Table 96: Global APAC Non-Woven Fabrics Industry Volume K Tons Forecast, by End-User Industry 2020 & 2033
- Table 97: Global APAC Non-Woven Fabrics Industry Revenue Million Forecast, by Geography 2020 & 2033
- Table 98: Global APAC Non-Woven Fabrics Industry Volume K Tons Forecast, by Geography 2020 & 2033
- Table 99: Global APAC Non-Woven Fabrics Industry Revenue Million Forecast, by Country 2020 & 2033
- Table 100: Global APAC Non-Woven Fabrics Industry Volume K Tons Forecast, by Country 2020 & 2033
Frequently Asked Questions
1. What is the projected Compound Annual Growth Rate (CAGR) of the APAC Non-Woven Fabrics Industry?
The projected CAGR is approximately > 8.00%.
2. Which companies are prominent players in the APAC Non-Woven Fabrics Industry?
Key companies in the market include Ahlstrom, Glatfelter Corporation, Global Non Wovens Limited, Ginni Filaments, Freudenberg Performance Materials, Cygnus Group, Eximius Innovative Pvt Ltd, Fitesa S A, DuPont, Autotech Nonwovens Pvt Ltd, TORAY INDUSTRIES INC *List Not Exhaustive, Johns Manville, Berry Global Inc, Reliance Non-woven Industry LLC.
3. What are the main segments of the APAC Non-Woven Fabrics Industry?
The market segments include Technology, Material, End-User Industry, Geography.
4. Can you provide details about the market size?
The market size is estimated to be USD 36.76 Million as of 2022.
5. What are some drivers contributing to market growth?
Increasing Application Base in the Healthcare Industry; Growth in The Automotive Industry; Increasing Demand for Non-Woven Fabrics in The Textile Industry.
6. What are the notable trends driving market growth?
Healthcare End-User Industry to Dominate The Market.
7. Are there any restraints impacting market growth?
Lack of Awareness Among Consumers; Volatility in Raw Material Prices.
8. Can you provide examples of recent developments in the market?
November 2022: Fitesa announced the expansion of its production capacity for nonwoven fabrics for medical applications. The company is expected to invest in new machinery to meet the growing demand for these products.
9. What pricing options are available for accessing the report?
Pricing options include single-user, multi-user, and enterprise licenses priced at USD 4750, USD 5250, and USD 8750 respectively.
10. Is the market size provided in terms of value or volume?
The market size is provided in terms of value, measured in Million and volume, measured in K Tons.
11. Are there any specific market keywords associated with the report?
Yes, the market keyword associated with the report is "APAC Non-Woven Fabrics Industry," which aids in identifying and referencing the specific market segment covered.
12. How do I determine which pricing option suits my needs best?
The pricing options vary based on user requirements and access needs. Individual users may opt for single-user licenses, while businesses requiring broader access may choose multi-user or enterprise licenses for cost-effective access to the report.
13. Are there any additional resources or data provided in the APAC Non-Woven Fabrics Industry report?
While the report offers comprehensive insights, it's advisable to review the specific contents or supplementary materials provided to ascertain if additional resources or data are available.
14. How can I stay updated on further developments or reports in the APAC Non-Woven Fabrics Industry?
To stay informed about further developments, trends, and reports in the APAC Non-Woven Fabrics Industry, consider subscribing to industry newsletters, following relevant companies and organizations, or regularly checking reputable industry news sources and publications.
Methodology
Step 1 - Identification of Relevant Samples Size from Population Database


Step 2 - Approaches for Defining Global Market Size (Value, Volume* & Price*)

Note*: In applicable scenarios
Step 3 - Data Sources
Primary Research
- Web Analytics
- Survey Reports
- Research Institute
- Latest Research Reports
- Opinion Leaders
Secondary Research
- Annual Reports
- White Paper
- Latest Press Release
- Industry Association
- Paid Database
- Investor Presentations

Step 4 - Data Triangulation
Involves using different sources of information in order to increase the validity of a study
These sources are likely to be stakeholders in a program - participants, other researchers, program staff, other community members, and so on.
Then we put all data in single framework & apply various statistical tools to find out the dynamic on the market.
During the analysis stage, feedback from the stakeholder groups would be compared to determine areas of agreement as well as areas of divergence