

Key Insights
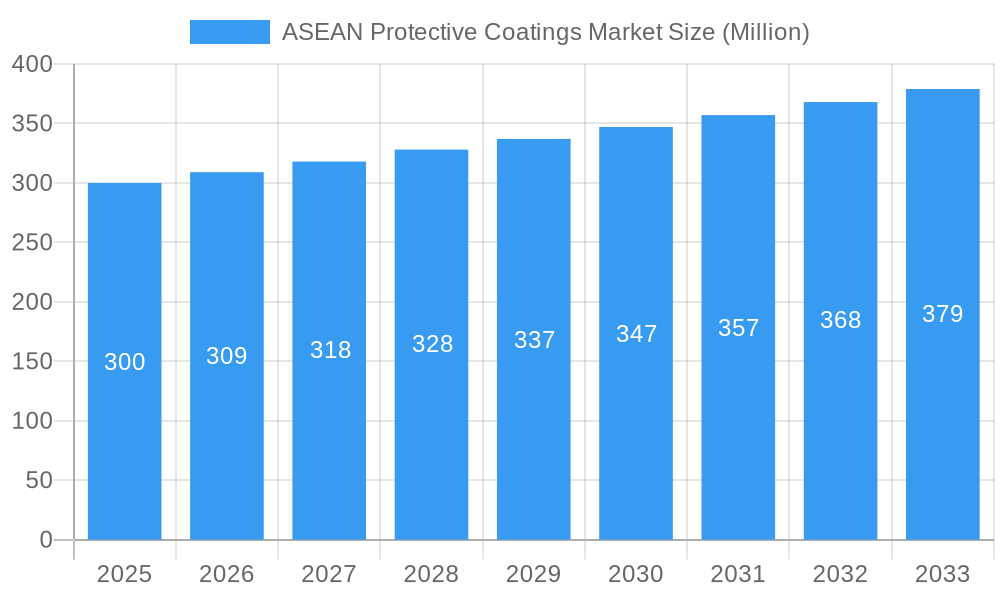
The ASEAN protective coatings market, valued at approximately $300 million in 2025, is projected to experience robust growth, driven by a Compound Annual Growth Rate (CAGR) exceeding 3.00% from 2025 to 2033. This expansion is fueled by several key factors. Firstly, the region's burgeoning infrastructure development, particularly in countries like Indonesia, Singapore, and Thailand, necessitates significant investment in protective coatings for various structures, including bridges, buildings, and pipelines. Secondly, the increasing emphasis on corrosion prevention in the oil and gas, and mining sectors within ASEAN is a considerable driver. This is further amplified by rising awareness regarding the long-term cost-effectiveness of protective coatings compared to frequent repairs and replacements. Finally, the growing adoption of advanced coating technologies, such as water-borne and UV-cured coatings, which offer improved environmental performance and enhanced durability, is contributing to market growth. The dominance of certain resin types, such as epoxy and polyurethane, due to their superior protective properties, also shapes the market landscape.
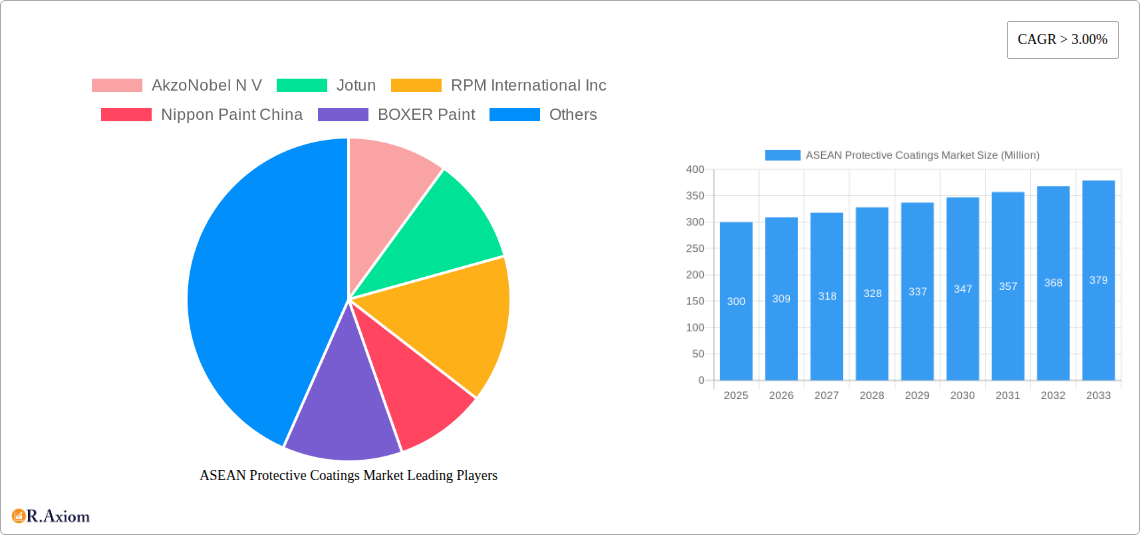
ASEAN Protective Coatings Market Market Size (In Million)
However, challenges remain. The fluctuating prices of raw materials, including resins and solvents, pose a significant constraint. Furthermore, stringent environmental regulations concerning Volatile Organic Compound (VOC) emissions are influencing the adoption of more eco-friendly coating solutions, requiring manufacturers to adapt and invest in newer technologies. The competitive landscape is characterized by a mix of both multinational corporations like AkzoNobel, Jotun, and PPG Industries, and regional players, leading to dynamic pricing strategies and diverse product offerings. This competitive environment, coupled with factors such as economic volatility and varying levels of infrastructure development across different ASEAN countries, will continue to shape the trajectory of market growth over the forecast period. Future growth will depend on sustained infrastructure investment, increased awareness of the benefits of preventative coatings, and the continued adoption of environmentally friendly and higher-performing technologies.
ASEAN Protective Coatings Market Company Market Share
ASEAN Protective Coatings Market: A Comprehensive Report (2019-2033)
This in-depth report provides a comprehensive analysis of the ASEAN Protective Coatings market, offering actionable insights for industry stakeholders. Covering the period from 2019 to 2033, with 2025 as the base year, this study meticulously examines market dynamics, growth drivers, challenges, and emerging opportunities. The report segments the market by resin type, technology, and end-user industry, providing detailed forecasts and competitive landscape analysis. The total market size in 2025 is estimated at xx Million, poised for significant growth over the forecast period (2025-2033).
ASEAN Protective Coatings Market Concentration & Innovation
This section analyzes the competitive landscape of the ASEAN protective coatings market, examining market concentration, innovation drivers, regulatory influences, and market dynamics. The market is characterized by a mix of multinational corporations and regional players. Key players such as AkzoNobel N V, Jotun, and PPG Industries Inc., hold significant market share, while several regional players contribute to the competitive dynamics. The market share of the top five players is estimated at xx% in 2025. Innovation is driven by the need for high-performance, sustainable, and environmentally friendly coatings. Several factors contribute to the market's innovative nature including:
- Stringent Environmental Regulations: Driving the development of low-VOC and water-borne coatings.
- Technological Advancements: In areas like UV-cured coatings and powder coatings, improving durability and efficiency.
- Rising Demand for Specialized Coatings: For specific applications in oil & gas, infrastructure, and other demanding sectors.
Mergers and acquisitions (M&A) have played a significant role in shaping the market landscape. While precise M&A deal values for the ASEAN region are not publicly available for all transactions, a noticeable trend is the acquisition of smaller, specialized companies by larger players to expand their product portfolio and geographic reach. The total value of M&A deals in the ASEAN protective coatings market between 2019 and 2024 is estimated at xx Million. Future M&A activity is expected to focus on strengthening regional presence and integrating sustainable technologies.
ASEAN Protective Coatings Market Industry Trends & Insights
The ASEAN protective coatings market is experiencing robust growth, driven by several key factors. The region's expanding infrastructure projects, particularly in transportation and energy, are significant drivers. The increasing demand for corrosion protection in industrial settings, coupled with rising awareness of environmental concerns, fuels the demand for eco-friendly coatings. Technological advancements, such as the development of high-performance water-borne and powder coatings, are further boosting market growth. The market is projected to witness a Compound Annual Growth Rate (CAGR) of xx% during the forecast period (2025-2033). Market penetration of water-borne coatings is expected to increase significantly, driven by stricter environmental regulations and growing consumer preference for sustainable products. The competitive landscape is dynamic, with both established players and new entrants vying for market share. Pricing strategies, product innovation, and distribution networks are key competitive differentiators. Consumer preferences are shifting towards high-performance, durable, and eco-friendly coatings that meet specific industrial needs and regulatory requirements.
Dominant Markets & Segments in ASEAN Protective Coatings Market
The ASEAN protective coatings market is characterized by diverse growth patterns across various countries and segments. While precise market share data at the country level is proprietary, Indonesia, Vietnam, and Thailand are expected to be the leading markets due to their robust infrastructure development and industrial growth. The Epoxy resin type is currently dominant, driven by its exceptional durability and performance in harsh environments, particularly in the oil and gas sector. However, the Water Borne Coatings technology segment is showing significant growth potential due to its environmental benefits and increasing regulatory pressures.
- Key Drivers for Indonesia, Vietnam, and Thailand:
- Rapid industrialization and urbanization.
- Significant investments in infrastructure projects (roads, bridges, buildings).
- Expanding oil and gas sectors.
- Growing awareness of corrosion protection.
- Government support for infrastructure development and industrial growth.
Within the end-user industry segment, the Oil and Gas sector is expected to maintain its dominance due to the stringent protection needs of pipelines, offshore structures and other assets. The infrastructure sector shows promising growth driven by continuous government investments in road, railway, and building projects.
ASEAN Protective Coatings Market Product Developments
Recent product innovations focus on enhancing durability, sustainability, and application efficiency. The industry is witnessing a shift towards low-VOC and water-borne coatings to comply with stringent environmental regulations. Manufacturers are also developing advanced coatings with enhanced corrosion resistance, UV protection, and anti-fouling properties to meet the specific needs of various end-user industries. These advancements are improving the performance and lifespan of protective coatings, leading to cost savings and enhanced customer satisfaction. The adoption of innovative application technologies like robotic spraying is also improving productivity and reducing material waste.
Report Scope & Segmentation Analysis
This report segments the ASEAN protective coatings market in multiple ways:
By Resin Type: Epoxy, Acrylic, Alkyd, Polyurethane, Polyester, Other Resin Type. The Epoxy segment holds the largest share in 2025 due to its superior performance characteristics. However, the growth of Acrylic and Polyurethane segments is expected to be faster due to cost-effectiveness and versatility.
By Technology: Water Borne Coatings, Solvent Borne Coatings, Powder Coatings, UV Cured Coatings. Water-borne coatings are gaining traction due to their environmental benefits, while powder coatings are witnessing growth in specific applications owing to their high efficiency and durability.
By End User Industry: Oil and Gas, Mining, Power, Infrastructure, Other End User Industry. The Oil and Gas sector remains the largest end-user segment. The Infrastructure sector is expected to witness significant growth due to ongoing development projects across the ASEAN region. Each segment's growth projection is detailed within the full report, including market size estimations and competitive analysis.
Key Drivers of ASEAN Protective Coatings Market Growth
The ASEAN protective coatings market growth is fueled by several factors:
- Rapid Infrastructure Development: Across the region, driving demand for corrosion-resistant coatings.
- Expanding Industrialization: Leading to increased demand for protective coatings in various sectors.
- Stringent Environmental Regulations: Promoting the adoption of eco-friendly coatings.
- Rising Awareness of Corrosion Protection: Among industries, leading to higher adoption rates.
Challenges in the ASEAN Protective Coatings Market Sector
The market faces several challenges:
- Fluctuations in Raw Material Prices: Impacting profitability and pricing strategies.
- Intense Competition: From both local and international players.
- Supply Chain Disruptions: Potentially affecting production and availability.
- Stringent Environmental Regulations: Increasing compliance costs. These challenges are analyzed in detail within the full report, along with their quantifiable impacts on market growth.
Emerging Opportunities in ASEAN Protective Coatings Market
Several opportunities exist for growth:
- Expansion into Emerging Markets: Within ASEAN, offering significant potential.
- Development of Specialized Coatings: For specific applications in niche industries.
- Adoption of Sustainable Technologies: Meeting growing environmental concerns.
- Increased focus on digitalization: improving efficiency and enhancing customer experience.
Leading Players in the ASEAN Protective Coatings Market Market
- AkzoNobel N V
- Jotun
- RPM International Inc
- Nippon Paint China
- BOXER Paint
- PPG Industries Inc
- Dover Paints Manufacturing
- Axalta Coating Systems
- Hempel A/S
- PUTRAMATARAM
- The Sherwin Williams Company
- Helios Coatings
- IST Paint SDN BHD
- Kossan Paint
- Sino Polymer
- Noroo Paint
- Asian Paints
- Welda Paint
- Aplus Paints
Key Developments in ASEAN Protective Coatings Market Industry
- 2024 Q4: AkzoNobel launched a new range of sustainable water-borne coatings.
- 2023 Q3: Jotun acquired a smaller regional player to expand its market presence in Vietnam.
- 2022 Q1: New environmental regulations were introduced in Indonesia, impacting the protective coatings industry. (Further developments are detailed within the full report)
Strategic Outlook for ASEAN Protective Coatings Market Market
The ASEAN protective coatings market is poised for continued growth driven by robust infrastructure development, industrial expansion, and rising awareness of environmental considerations. The adoption of sustainable and high-performance coatings will be key to future success. Opportunities exist for innovation, market expansion, and strategic partnerships to capitalize on the region's dynamic growth trajectory. The market is expected to attract further investment and consolidation, with major players continuing to invest in R&D and expand their geographic reach.
ASEAN Protective Coatings Market Segmentation
-
1. Resin Type
- 1.1. Epoxy
- 1.2. Acrylic
- 1.3. Alkyd
- 1.4. Polyurethane
- 1.5. Polyester
- 1.6. Other Resin Type
-
2. Technology
- 2.1. Water Borne Coatings
- 2.2. Solvent Borne Coatings
- 2.3. Powder Coatings
- 2.4. UV Cured Coatings
-
3. End User Industry
- 3.1. Oil and Gas
- 3.2. Mining
- 3.3. Power
- 3.4. Infrastructure
- 3.5. Other End User Industry
-
4. Geography
- 4.1. Indonesia
- 4.2. Malaysia
- 4.3. Thailand
- 4.4. Philippines
- 4.5. Singapore
- 4.6. Vietnam
- 4.7. Rest of ASEAN
ASEAN Protective Coatings Market Segmentation By Geography
- 1. Indonesia
- 2. Malaysia
- 3. Thailand
- 4. Philippines
- 5. Singapore
- 6. Vietnam
- 7. Rest of ASEAN
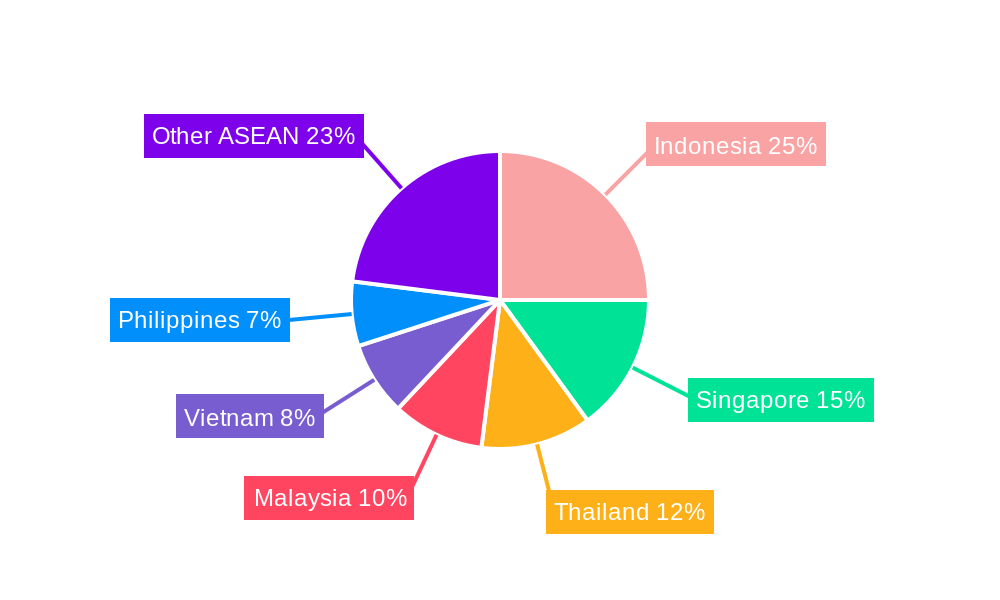
ASEAN Protective Coatings Market Regional Market Share
Geographic Coverage of ASEAN Protective Coatings Market
ASEAN Protective Coatings Market REPORT HIGHLIGHTS
| Aspects | Details |
|---|---|
| Study Period | 2020-2034 |
| Base Year | 2025 |
| Estimated Year | 2026 |
| Forecast Period | 2026-2034 |
| Historical Period | 2020-2025 |
| Growth Rate | CAGR of > 3.00% from 2020-2034 |
| Segmentation |
|
Table of Contents
- 1. Introduction
- 1.1. Research Scope
- 1.2. Market Segmentation
- 1.3. Research Objective
- 1.4. Definitions and Assumptions
- 2. Executive Summary
- 2.1. Market Snapshot
- 3. Market Dynamics
- 3.1. Market Drivers
- 3.2. Market Restrains
- 3.3. Market Trends
- 3.4. Market Opportunities
- 4. Market Factor Analysis
- 4.1. Porters Five Forces
- 4.1.1. Bargaining Power of Suppliers
- 4.1.2. Bargaining Power of Buyers
- 4.1.3. Threat of New Entrants
- 4.1.4. Threat of Substitutes
- 4.1.5. Competitive Rivalry
- 4.2. PESTEL analysis
- 4.3. BCG Analysis
- 4.3.1. Stars (High Growth, High Market Share)
- 4.3.2. Cash Cows (Low Growth, High Market Share)
- 4.3.3. Question Mark (High Growth, Low Market Share)
- 4.3.4. Dogs (Low Growth, Low Market Share)
- 4.4. Ansoff Matrix Analysis
- 4.5. Supply Chain Analysis
- 4.6. Regulatory Landscape
- 4.7. Current Market Potential and Opportunity Assessment (TAM–SAM–SOM Framework)
- 4.8. RAX Analyst Note
- 4.1. Porters Five Forces
- 5. Market Analysis, Insights and Forecast 2021-2033
- 5.1. Market Analysis, Insights and Forecast - by Resin Type
- 5.1.1. Epoxy
- 5.1.2. Acrylic
- 5.1.3. Alkyd
- 5.1.4. Polyurethane
- 5.1.5. Polyester
- 5.1.6. Other Resin Type
- 5.2. Market Analysis, Insights and Forecast - by Technology
- 5.2.1. Water Borne Coatings
- 5.2.2. Solvent Borne Coatings
- 5.2.3. Powder Coatings
- 5.2.4. UV Cured Coatings
- 5.3. Market Analysis, Insights and Forecast - by End User Industry
- 5.3.1. Oil and Gas
- 5.3.2. Mining
- 5.3.3. Power
- 5.3.4. Infrastructure
- 5.3.5. Other End User Industry
- 5.4. Market Analysis, Insights and Forecast - by Geography
- 5.4.1. Indonesia
- 5.4.2. Malaysia
- 5.4.3. Thailand
- 5.4.4. Philippines
- 5.4.5. Singapore
- 5.4.6. Vietnam
- 5.4.7. Rest of ASEAN
- 5.5. Market Analysis, Insights and Forecast - by Region
- 5.5.1. Indonesia
- 5.5.2. Malaysia
- 5.5.3. Thailand
- 5.5.4. Philippines
- 5.5.5. Singapore
- 5.5.6. Vietnam
- 5.5.7. Rest of ASEAN
- 5.1. Market Analysis, Insights and Forecast - by Resin Type
- 6. Global ASEAN Protective Coatings Market Analysis, Insights and Forecast, 2021-2033
- 6.1. Market Analysis, Insights and Forecast - by Resin Type
- 6.1.1. Epoxy
- 6.1.2. Acrylic
- 6.1.3. Alkyd
- 6.1.4. Polyurethane
- 6.1.5. Polyester
- 6.1.6. Other Resin Type
- 6.2. Market Analysis, Insights and Forecast - by Technology
- 6.2.1. Water Borne Coatings
- 6.2.2. Solvent Borne Coatings
- 6.2.3. Powder Coatings
- 6.2.4. UV Cured Coatings
- 6.3. Market Analysis, Insights and Forecast - by End User Industry
- 6.3.1. Oil and Gas
- 6.3.2. Mining
- 6.3.3. Power
- 6.3.4. Infrastructure
- 6.3.5. Other End User Industry
- 6.4. Market Analysis, Insights and Forecast - by Geography
- 6.4.1. Indonesia
- 6.4.2. Malaysia
- 6.4.3. Thailand
- 6.4.4. Philippines
- 6.4.5. Singapore
- 6.4.6. Vietnam
- 6.4.7. Rest of ASEAN
- 6.1. Market Analysis, Insights and Forecast - by Resin Type
- 7. Indonesia ASEAN Protective Coatings Market Analysis, Insights and Forecast, 2020-2032
- 7.1. Market Analysis, Insights and Forecast - by Resin Type
- 7.1.1. Epoxy
- 7.1.2. Acrylic
- 7.1.3. Alkyd
- 7.1.4. Polyurethane
- 7.1.5. Polyester
- 7.1.6. Other Resin Type
- 7.2. Market Analysis, Insights and Forecast - by Technology
- 7.2.1. Water Borne Coatings
- 7.2.2. Solvent Borne Coatings
- 7.2.3. Powder Coatings
- 7.2.4. UV Cured Coatings
- 7.3. Market Analysis, Insights and Forecast - by End User Industry
- 7.3.1. Oil and Gas
- 7.3.2. Mining
- 7.3.3. Power
- 7.3.4. Infrastructure
- 7.3.5. Other End User Industry
- 7.4. Market Analysis, Insights and Forecast - by Geography
- 7.4.1. Indonesia
- 7.4.2. Malaysia
- 7.4.3. Thailand
- 7.4.4. Philippines
- 7.4.5. Singapore
- 7.4.6. Vietnam
- 7.4.7. Rest of ASEAN
- 7.1. Market Analysis, Insights and Forecast - by Resin Type
- 8. Malaysia ASEAN Protective Coatings Market Analysis, Insights and Forecast, 2020-2032
- 8.1. Market Analysis, Insights and Forecast - by Resin Type
- 8.1.1. Epoxy
- 8.1.2. Acrylic
- 8.1.3. Alkyd
- 8.1.4. Polyurethane
- 8.1.5. Polyester
- 8.1.6. Other Resin Type
- 8.2. Market Analysis, Insights and Forecast - by Technology
- 8.2.1. Water Borne Coatings
- 8.2.2. Solvent Borne Coatings
- 8.2.3. Powder Coatings
- 8.2.4. UV Cured Coatings
- 8.3. Market Analysis, Insights and Forecast - by End User Industry
- 8.3.1. Oil and Gas
- 8.3.2. Mining
- 8.3.3. Power
- 8.3.4. Infrastructure
- 8.3.5. Other End User Industry
- 8.4. Market Analysis, Insights and Forecast - by Geography
- 8.4.1. Indonesia
- 8.4.2. Malaysia
- 8.4.3. Thailand
- 8.4.4. Philippines
- 8.4.5. Singapore
- 8.4.6. Vietnam
- 8.4.7. Rest of ASEAN
- 8.1. Market Analysis, Insights and Forecast - by Resin Type
- 9. Thailand ASEAN Protective Coatings Market Analysis, Insights and Forecast, 2020-2032
- 9.1. Market Analysis, Insights and Forecast - by Resin Type
- 9.1.1. Epoxy
- 9.1.2. Acrylic
- 9.1.3. Alkyd
- 9.1.4. Polyurethane
- 9.1.5. Polyester
- 9.1.6. Other Resin Type
- 9.2. Market Analysis, Insights and Forecast - by Technology
- 9.2.1. Water Borne Coatings
- 9.2.2. Solvent Borne Coatings
- 9.2.3. Powder Coatings
- 9.2.4. UV Cured Coatings
- 9.3. Market Analysis, Insights and Forecast - by End User Industry
- 9.3.1. Oil and Gas
- 9.3.2. Mining
- 9.3.3. Power
- 9.3.4. Infrastructure
- 9.3.5. Other End User Industry
- 9.4. Market Analysis, Insights and Forecast - by Geography
- 9.4.1. Indonesia
- 9.4.2. Malaysia
- 9.4.3. Thailand
- 9.4.4. Philippines
- 9.4.5. Singapore
- 9.4.6. Vietnam
- 9.4.7. Rest of ASEAN
- 9.1. Market Analysis, Insights and Forecast - by Resin Type
- 10. Philippines ASEAN Protective Coatings Market Analysis, Insights and Forecast, 2020-2032
- 10.1. Market Analysis, Insights and Forecast - by Resin Type
- 10.1.1. Epoxy
- 10.1.2. Acrylic
- 10.1.3. Alkyd
- 10.1.4. Polyurethane
- 10.1.5. Polyester
- 10.1.6. Other Resin Type
- 10.2. Market Analysis, Insights and Forecast - by Technology
- 10.2.1. Water Borne Coatings
- 10.2.2. Solvent Borne Coatings
- 10.2.3. Powder Coatings
- 10.2.4. UV Cured Coatings
- 10.3. Market Analysis, Insights and Forecast - by End User Industry
- 10.3.1. Oil and Gas
- 10.3.2. Mining
- 10.3.3. Power
- 10.3.4. Infrastructure
- 10.3.5. Other End User Industry
- 10.4. Market Analysis, Insights and Forecast - by Geography
- 10.4.1. Indonesia
- 10.4.2. Malaysia
- 10.4.3. Thailand
- 10.4.4. Philippines
- 10.4.5. Singapore
- 10.4.6. Vietnam
- 10.4.7. Rest of ASEAN
- 10.1. Market Analysis, Insights and Forecast - by Resin Type
- 11. Singapore ASEAN Protective Coatings Market Analysis, Insights and Forecast, 2020-2032
- 11.1. Market Analysis, Insights and Forecast - by Resin Type
- 11.1.1. Epoxy
- 11.1.2. Acrylic
- 11.1.3. Alkyd
- 11.1.4. Polyurethane
- 11.1.5. Polyester
- 11.1.6. Other Resin Type
- 11.2. Market Analysis, Insights and Forecast - by Technology
- 11.2.1. Water Borne Coatings
- 11.2.2. Solvent Borne Coatings
- 11.2.3. Powder Coatings
- 11.2.4. UV Cured Coatings
- 11.3. Market Analysis, Insights and Forecast - by End User Industry
- 11.3.1. Oil and Gas
- 11.3.2. Mining
- 11.3.3. Power
- 11.3.4. Infrastructure
- 11.3.5. Other End User Industry
- 11.4. Market Analysis, Insights and Forecast - by Geography
- 11.4.1. Indonesia
- 11.4.2. Malaysia
- 11.4.3. Thailand
- 11.4.4. Philippines
- 11.4.5. Singapore
- 11.4.6. Vietnam
- 11.4.7. Rest of ASEAN
- 11.1. Market Analysis, Insights and Forecast - by Resin Type
- 12. Vietnam ASEAN Protective Coatings Market Analysis, Insights and Forecast, 2020-2032
- 12.1. Market Analysis, Insights and Forecast - by Resin Type
- 12.1.1. Epoxy
- 12.1.2. Acrylic
- 12.1.3. Alkyd
- 12.1.4. Polyurethane
- 12.1.5. Polyester
- 12.1.6. Other Resin Type
- 12.2. Market Analysis, Insights and Forecast - by Technology
- 12.2.1. Water Borne Coatings
- 12.2.2. Solvent Borne Coatings
- 12.2.3. Powder Coatings
- 12.2.4. UV Cured Coatings
- 12.3. Market Analysis, Insights and Forecast - by End User Industry
- 12.3.1. Oil and Gas
- 12.3.2. Mining
- 12.3.3. Power
- 12.3.4. Infrastructure
- 12.3.5. Other End User Industry
- 12.4. Market Analysis, Insights and Forecast - by Geography
- 12.4.1. Indonesia
- 12.4.2. Malaysia
- 12.4.3. Thailand
- 12.4.4. Philippines
- 12.4.5. Singapore
- 12.4.6. Vietnam
- 12.4.7. Rest of ASEAN
- 12.1. Market Analysis, Insights and Forecast - by Resin Type
- 13. Rest of ASEAN ASEAN Protective Coatings Market Analysis, Insights and Forecast, 2020-2032
- 13.1. Market Analysis, Insights and Forecast - by Resin Type
- 13.1.1. Epoxy
- 13.1.2. Acrylic
- 13.1.3. Alkyd
- 13.1.4. Polyurethane
- 13.1.5. Polyester
- 13.1.6. Other Resin Type
- 13.2. Market Analysis, Insights and Forecast - by Technology
- 13.2.1. Water Borne Coatings
- 13.2.2. Solvent Borne Coatings
- 13.2.3. Powder Coatings
- 13.2.4. UV Cured Coatings
- 13.3. Market Analysis, Insights and Forecast - by End User Industry
- 13.3.1. Oil and Gas
- 13.3.2. Mining
- 13.3.3. Power
- 13.3.4. Infrastructure
- 13.3.5. Other End User Industry
- 13.4. Market Analysis, Insights and Forecast - by Geography
- 13.4.1. Indonesia
- 13.4.2. Malaysia
- 13.4.3. Thailand
- 13.4.4. Philippines
- 13.4.5. Singapore
- 13.4.6. Vietnam
- 13.4.7. Rest of ASEAN
- 13.1. Market Analysis, Insights and Forecast - by Resin Type
- 14. Competitive Analysis
- 14.1. Company Profiles
- 14.1.1 AkzoNobel N V
- 14.1.1.1. Company Overview
- 14.1.1.2. Products
- 14.1.1.3. Company Financials
- 14.1.1.4. SWOT Analysis
- 14.1.2 Jotun
- 14.1.2.1. Company Overview
- 14.1.2.2. Products
- 14.1.2.3. Company Financials
- 14.1.2.4. SWOT Analysis
- 14.1.3 RPM International Inc
- 14.1.3.1. Company Overview
- 14.1.3.2. Products
- 14.1.3.3. Company Financials
- 14.1.3.4. SWOT Analysis
- 14.1.4 Nippon Paint China
- 14.1.4.1. Company Overview
- 14.1.4.2. Products
- 14.1.4.3. Company Financials
- 14.1.4.4. SWOT Analysis
- 14.1.5 BOXER Paint
- 14.1.5.1. Company Overview
- 14.1.5.2. Products
- 14.1.5.3. Company Financials
- 14.1.5.4. SWOT Analysis
- 14.1.6 PPG Industries Inc
- 14.1.6.1. Company Overview
- 14.1.6.2. Products
- 14.1.6.3. Company Financials
- 14.1.6.4. SWOT Analysis
- 14.1.7 Dover Paints Manufacturing
- 14.1.7.1. Company Overview
- 14.1.7.2. Products
- 14.1.7.3. Company Financials
- 14.1.7.4. SWOT Analysis
- 14.1.8 Axalta Coating Systems
- 14.1.8.1. Company Overview
- 14.1.8.2. Products
- 14.1.8.3. Company Financials
- 14.1.8.4. SWOT Analysis
- 14.1.9 Hempel A/S
- 14.1.9.1. Company Overview
- 14.1.9.2. Products
- 14.1.9.3. Company Financials
- 14.1.9.4. SWOT Analysis
- 14.1.10 PUTRAMATARAM
- 14.1.10.1. Company Overview
- 14.1.10.2. Products
- 14.1.10.3. Company Financials
- 14.1.10.4. SWOT Analysis
- 14.1.11 The Sherwin Williams Company
- 14.1.11.1. Company Overview
- 14.1.11.2. Products
- 14.1.11.3. Company Financials
- 14.1.11.4. SWOT Analysis
- 14.1.12 Helios Coatings
- 14.1.12.1. Company Overview
- 14.1.12.2. Products
- 14.1.12.3. Company Financials
- 14.1.12.4. SWOT Analysis
- 14.1.13 IST Paint SDN BHD
- 14.1.13.1. Company Overview
- 14.1.13.2. Products
- 14.1.13.3. Company Financials
- 14.1.13.4. SWOT Analysis
- 14.1.14 Kossan Paint
- 14.1.14.1. Company Overview
- 14.1.14.2. Products
- 14.1.14.3. Company Financials
- 14.1.14.4. SWOT Analysis
- 14.1.15 Sino Polymer
- 14.1.15.1. Company Overview
- 14.1.15.2. Products
- 14.1.15.3. Company Financials
- 14.1.15.4. SWOT Analysis
- 14.1.16 Noroo Paint
- 14.1.16.1. Company Overview
- 14.1.16.2. Products
- 14.1.16.3. Company Financials
- 14.1.16.4. SWOT Analysis
- 14.1.17 Asian Paints
- 14.1.17.1. Company Overview
- 14.1.17.2. Products
- 14.1.17.3. Company Financials
- 14.1.17.4. SWOT Analysis
- 14.1.18 Welda Paint*List Not Exhaustive
- 14.1.18.1. Company Overview
- 14.1.18.2. Products
- 14.1.18.3. Company Financials
- 14.1.18.4. SWOT Analysis
- 14.1.19 Aplus Paints
- 14.1.19.1. Company Overview
- 14.1.19.2. Products
- 14.1.19.3. Company Financials
- 14.1.19.4. SWOT Analysis
- 14.1.1 AkzoNobel N V
- 14.2. Market Entropy
- 14.2.1 Company's Key Areas Served
- 14.2.2 Recent Developments
- 14.3. Company Market Share Analysis 2025
- 14.3.1 Top 5 Companies Market Share Analysis
- 14.3.2 Top 3 Companies Market Share Analysis
- 14.4. List of Potential Customers
- 15. Research Methodology
List of Figures
- Figure 1: Global ASEAN Protective Coatings Market Revenue Breakdown (Million, %) by Region 2025 & 2033
- Figure 2: Global ASEAN Protective Coatings Market Volume Breakdown (liter , %) by Region 2025 & 2033
- Figure 3: Indonesia ASEAN Protective Coatings Market Revenue (Million), by Resin Type 2025 & 2033
- Figure 4: Indonesia ASEAN Protective Coatings Market Volume (liter ), by Resin Type 2025 & 2033
- Figure 5: Indonesia ASEAN Protective Coatings Market Revenue Share (%), by Resin Type 2025 & 2033
- Figure 6: Indonesia ASEAN Protective Coatings Market Volume Share (%), by Resin Type 2025 & 2033
- Figure 7: Indonesia ASEAN Protective Coatings Market Revenue (Million), by Technology 2025 & 2033
- Figure 8: Indonesia ASEAN Protective Coatings Market Volume (liter ), by Technology 2025 & 2033
- Figure 9: Indonesia ASEAN Protective Coatings Market Revenue Share (%), by Technology 2025 & 2033
- Figure 10: Indonesia ASEAN Protective Coatings Market Volume Share (%), by Technology 2025 & 2033
- Figure 11: Indonesia ASEAN Protective Coatings Market Revenue (Million), by End User Industry 2025 & 2033
- Figure 12: Indonesia ASEAN Protective Coatings Market Volume (liter ), by End User Industry 2025 & 2033
- Figure 13: Indonesia ASEAN Protective Coatings Market Revenue Share (%), by End User Industry 2025 & 2033
- Figure 14: Indonesia ASEAN Protective Coatings Market Volume Share (%), by End User Industry 2025 & 2033
- Figure 15: Indonesia ASEAN Protective Coatings Market Revenue (Million), by Geography 2025 & 2033
- Figure 16: Indonesia ASEAN Protective Coatings Market Volume (liter ), by Geography 2025 & 2033
- Figure 17: Indonesia ASEAN Protective Coatings Market Revenue Share (%), by Geography 2025 & 2033
- Figure 18: Indonesia ASEAN Protective Coatings Market Volume Share (%), by Geography 2025 & 2033
- Figure 19: Indonesia ASEAN Protective Coatings Market Revenue (Million), by Country 2025 & 2033
- Figure 20: Indonesia ASEAN Protective Coatings Market Volume (liter ), by Country 2025 & 2033
- Figure 21: Indonesia ASEAN Protective Coatings Market Revenue Share (%), by Country 2025 & 2033
- Figure 22: Indonesia ASEAN Protective Coatings Market Volume Share (%), by Country 2025 & 2033
- Figure 23: Malaysia ASEAN Protective Coatings Market Revenue (Million), by Resin Type 2025 & 2033
- Figure 24: Malaysia ASEAN Protective Coatings Market Volume (liter ), by Resin Type 2025 & 2033
- Figure 25: Malaysia ASEAN Protective Coatings Market Revenue Share (%), by Resin Type 2025 & 2033
- Figure 26: Malaysia ASEAN Protective Coatings Market Volume Share (%), by Resin Type 2025 & 2033
- Figure 27: Malaysia ASEAN Protective Coatings Market Revenue (Million), by Technology 2025 & 2033
- Figure 28: Malaysia ASEAN Protective Coatings Market Volume (liter ), by Technology 2025 & 2033
- Figure 29: Malaysia ASEAN Protective Coatings Market Revenue Share (%), by Technology 2025 & 2033
- Figure 30: Malaysia ASEAN Protective Coatings Market Volume Share (%), by Technology 2025 & 2033
- Figure 31: Malaysia ASEAN Protective Coatings Market Revenue (Million), by End User Industry 2025 & 2033
- Figure 32: Malaysia ASEAN Protective Coatings Market Volume (liter ), by End User Industry 2025 & 2033
- Figure 33: Malaysia ASEAN Protective Coatings Market Revenue Share (%), by End User Industry 2025 & 2033
- Figure 34: Malaysia ASEAN Protective Coatings Market Volume Share (%), by End User Industry 2025 & 2033
- Figure 35: Malaysia ASEAN Protective Coatings Market Revenue (Million), by Geography 2025 & 2033
- Figure 36: Malaysia ASEAN Protective Coatings Market Volume (liter ), by Geography 2025 & 2033
- Figure 37: Malaysia ASEAN Protective Coatings Market Revenue Share (%), by Geography 2025 & 2033
- Figure 38: Malaysia ASEAN Protective Coatings Market Volume Share (%), by Geography 2025 & 2033
- Figure 39: Malaysia ASEAN Protective Coatings Market Revenue (Million), by Country 2025 & 2033
- Figure 40: Malaysia ASEAN Protective Coatings Market Volume (liter ), by Country 2025 & 2033
- Figure 41: Malaysia ASEAN Protective Coatings Market Revenue Share (%), by Country 2025 & 2033
- Figure 42: Malaysia ASEAN Protective Coatings Market Volume Share (%), by Country 2025 & 2033
- Figure 43: Thailand ASEAN Protective Coatings Market Revenue (Million), by Resin Type 2025 & 2033
- Figure 44: Thailand ASEAN Protective Coatings Market Volume (liter ), by Resin Type 2025 & 2033
- Figure 45: Thailand ASEAN Protective Coatings Market Revenue Share (%), by Resin Type 2025 & 2033
- Figure 46: Thailand ASEAN Protective Coatings Market Volume Share (%), by Resin Type 2025 & 2033
- Figure 47: Thailand ASEAN Protective Coatings Market Revenue (Million), by Technology 2025 & 2033
- Figure 48: Thailand ASEAN Protective Coatings Market Volume (liter ), by Technology 2025 & 2033
- Figure 49: Thailand ASEAN Protective Coatings Market Revenue Share (%), by Technology 2025 & 2033
- Figure 50: Thailand ASEAN Protective Coatings Market Volume Share (%), by Technology 2025 & 2033
- Figure 51: Thailand ASEAN Protective Coatings Market Revenue (Million), by End User Industry 2025 & 2033
- Figure 52: Thailand ASEAN Protective Coatings Market Volume (liter ), by End User Industry 2025 & 2033
- Figure 53: Thailand ASEAN Protective Coatings Market Revenue Share (%), by End User Industry 2025 & 2033
- Figure 54: Thailand ASEAN Protective Coatings Market Volume Share (%), by End User Industry 2025 & 2033
- Figure 55: Thailand ASEAN Protective Coatings Market Revenue (Million), by Geography 2025 & 2033
- Figure 56: Thailand ASEAN Protective Coatings Market Volume (liter ), by Geography 2025 & 2033
- Figure 57: Thailand ASEAN Protective Coatings Market Revenue Share (%), by Geography 2025 & 2033
- Figure 58: Thailand ASEAN Protective Coatings Market Volume Share (%), by Geography 2025 & 2033
- Figure 59: Thailand ASEAN Protective Coatings Market Revenue (Million), by Country 2025 & 2033
- Figure 60: Thailand ASEAN Protective Coatings Market Volume (liter ), by Country 2025 & 2033
- Figure 61: Thailand ASEAN Protective Coatings Market Revenue Share (%), by Country 2025 & 2033
- Figure 62: Thailand ASEAN Protective Coatings Market Volume Share (%), by Country 2025 & 2033
- Figure 63: Philippines ASEAN Protective Coatings Market Revenue (Million), by Resin Type 2025 & 2033
- Figure 64: Philippines ASEAN Protective Coatings Market Volume (liter ), by Resin Type 2025 & 2033
- Figure 65: Philippines ASEAN Protective Coatings Market Revenue Share (%), by Resin Type 2025 & 2033
- Figure 66: Philippines ASEAN Protective Coatings Market Volume Share (%), by Resin Type 2025 & 2033
- Figure 67: Philippines ASEAN Protective Coatings Market Revenue (Million), by Technology 2025 & 2033
- Figure 68: Philippines ASEAN Protective Coatings Market Volume (liter ), by Technology 2025 & 2033
- Figure 69: Philippines ASEAN Protective Coatings Market Revenue Share (%), by Technology 2025 & 2033
- Figure 70: Philippines ASEAN Protective Coatings Market Volume Share (%), by Technology 2025 & 2033
- Figure 71: Philippines ASEAN Protective Coatings Market Revenue (Million), by End User Industry 2025 & 2033
- Figure 72: Philippines ASEAN Protective Coatings Market Volume (liter ), by End User Industry 2025 & 2033
- Figure 73: Philippines ASEAN Protective Coatings Market Revenue Share (%), by End User Industry 2025 & 2033
- Figure 74: Philippines ASEAN Protective Coatings Market Volume Share (%), by End User Industry 2025 & 2033
- Figure 75: Philippines ASEAN Protective Coatings Market Revenue (Million), by Geography 2025 & 2033
- Figure 76: Philippines ASEAN Protective Coatings Market Volume (liter ), by Geography 2025 & 2033
- Figure 77: Philippines ASEAN Protective Coatings Market Revenue Share (%), by Geography 2025 & 2033
- Figure 78: Philippines ASEAN Protective Coatings Market Volume Share (%), by Geography 2025 & 2033
- Figure 79: Philippines ASEAN Protective Coatings Market Revenue (Million), by Country 2025 & 2033
- Figure 80: Philippines ASEAN Protective Coatings Market Volume (liter ), by Country 2025 & 2033
- Figure 81: Philippines ASEAN Protective Coatings Market Revenue Share (%), by Country 2025 & 2033
- Figure 82: Philippines ASEAN Protective Coatings Market Volume Share (%), by Country 2025 & 2033
- Figure 83: Singapore ASEAN Protective Coatings Market Revenue (Million), by Resin Type 2025 & 2033
- Figure 84: Singapore ASEAN Protective Coatings Market Volume (liter ), by Resin Type 2025 & 2033
- Figure 85: Singapore ASEAN Protective Coatings Market Revenue Share (%), by Resin Type 2025 & 2033
- Figure 86: Singapore ASEAN Protective Coatings Market Volume Share (%), by Resin Type 2025 & 2033
- Figure 87: Singapore ASEAN Protective Coatings Market Revenue (Million), by Technology 2025 & 2033
- Figure 88: Singapore ASEAN Protective Coatings Market Volume (liter ), by Technology 2025 & 2033
- Figure 89: Singapore ASEAN Protective Coatings Market Revenue Share (%), by Technology 2025 & 2033
- Figure 90: Singapore ASEAN Protective Coatings Market Volume Share (%), by Technology 2025 & 2033
- Figure 91: Singapore ASEAN Protective Coatings Market Revenue (Million), by End User Industry 2025 & 2033
- Figure 92: Singapore ASEAN Protective Coatings Market Volume (liter ), by End User Industry 2025 & 2033
- Figure 93: Singapore ASEAN Protective Coatings Market Revenue Share (%), by End User Industry 2025 & 2033
- Figure 94: Singapore ASEAN Protective Coatings Market Volume Share (%), by End User Industry 2025 & 2033
- Figure 95: Singapore ASEAN Protective Coatings Market Revenue (Million), by Geography 2025 & 2033
- Figure 96: Singapore ASEAN Protective Coatings Market Volume (liter ), by Geography 2025 & 2033
- Figure 97: Singapore ASEAN Protective Coatings Market Revenue Share (%), by Geography 2025 & 2033
- Figure 98: Singapore ASEAN Protective Coatings Market Volume Share (%), by Geography 2025 & 2033
- Figure 99: Singapore ASEAN Protective Coatings Market Revenue (Million), by Country 2025 & 2033
- Figure 100: Singapore ASEAN Protective Coatings Market Volume (liter ), by Country 2025 & 2033
- Figure 101: Singapore ASEAN Protective Coatings Market Revenue Share (%), by Country 2025 & 2033
- Figure 102: Singapore ASEAN Protective Coatings Market Volume Share (%), by Country 2025 & 2033
- Figure 103: Vietnam ASEAN Protective Coatings Market Revenue (Million), by Resin Type 2025 & 2033
- Figure 104: Vietnam ASEAN Protective Coatings Market Volume (liter ), by Resin Type 2025 & 2033
- Figure 105: Vietnam ASEAN Protective Coatings Market Revenue Share (%), by Resin Type 2025 & 2033
- Figure 106: Vietnam ASEAN Protective Coatings Market Volume Share (%), by Resin Type 2025 & 2033
- Figure 107: Vietnam ASEAN Protective Coatings Market Revenue (Million), by Technology 2025 & 2033
- Figure 108: Vietnam ASEAN Protective Coatings Market Volume (liter ), by Technology 2025 & 2033
- Figure 109: Vietnam ASEAN Protective Coatings Market Revenue Share (%), by Technology 2025 & 2033
- Figure 110: Vietnam ASEAN Protective Coatings Market Volume Share (%), by Technology 2025 & 2033
- Figure 111: Vietnam ASEAN Protective Coatings Market Revenue (Million), by End User Industry 2025 & 2033
- Figure 112: Vietnam ASEAN Protective Coatings Market Volume (liter ), by End User Industry 2025 & 2033
- Figure 113: Vietnam ASEAN Protective Coatings Market Revenue Share (%), by End User Industry 2025 & 2033
- Figure 114: Vietnam ASEAN Protective Coatings Market Volume Share (%), by End User Industry 2025 & 2033
- Figure 115: Vietnam ASEAN Protective Coatings Market Revenue (Million), by Geography 2025 & 2033
- Figure 116: Vietnam ASEAN Protective Coatings Market Volume (liter ), by Geography 2025 & 2033
- Figure 117: Vietnam ASEAN Protective Coatings Market Revenue Share (%), by Geography 2025 & 2033
- Figure 118: Vietnam ASEAN Protective Coatings Market Volume Share (%), by Geography 2025 & 2033
- Figure 119: Vietnam ASEAN Protective Coatings Market Revenue (Million), by Country 2025 & 2033
- Figure 120: Vietnam ASEAN Protective Coatings Market Volume (liter ), by Country 2025 & 2033
- Figure 121: Vietnam ASEAN Protective Coatings Market Revenue Share (%), by Country 2025 & 2033
- Figure 122: Vietnam ASEAN Protective Coatings Market Volume Share (%), by Country 2025 & 2033
- Figure 123: Rest of ASEAN ASEAN Protective Coatings Market Revenue (Million), by Resin Type 2025 & 2033
- Figure 124: Rest of ASEAN ASEAN Protective Coatings Market Volume (liter ), by Resin Type 2025 & 2033
- Figure 125: Rest of ASEAN ASEAN Protective Coatings Market Revenue Share (%), by Resin Type 2025 & 2033
- Figure 126: Rest of ASEAN ASEAN Protective Coatings Market Volume Share (%), by Resin Type 2025 & 2033
- Figure 127: Rest of ASEAN ASEAN Protective Coatings Market Revenue (Million), by Technology 2025 & 2033
- Figure 128: Rest of ASEAN ASEAN Protective Coatings Market Volume (liter ), by Technology 2025 & 2033
- Figure 129: Rest of ASEAN ASEAN Protective Coatings Market Revenue Share (%), by Technology 2025 & 2033
- Figure 130: Rest of ASEAN ASEAN Protective Coatings Market Volume Share (%), by Technology 2025 & 2033
- Figure 131: Rest of ASEAN ASEAN Protective Coatings Market Revenue (Million), by End User Industry 2025 & 2033
- Figure 132: Rest of ASEAN ASEAN Protective Coatings Market Volume (liter ), by End User Industry 2025 & 2033
- Figure 133: Rest of ASEAN ASEAN Protective Coatings Market Revenue Share (%), by End User Industry 2025 & 2033
- Figure 134: Rest of ASEAN ASEAN Protective Coatings Market Volume Share (%), by End User Industry 2025 & 2033
- Figure 135: Rest of ASEAN ASEAN Protective Coatings Market Revenue (Million), by Geography 2025 & 2033
- Figure 136: Rest of ASEAN ASEAN Protective Coatings Market Volume (liter ), by Geography 2025 & 2033
- Figure 137: Rest of ASEAN ASEAN Protective Coatings Market Revenue Share (%), by Geography 2025 & 2033
- Figure 138: Rest of ASEAN ASEAN Protective Coatings Market Volume Share (%), by Geography 2025 & 2033
- Figure 139: Rest of ASEAN ASEAN Protective Coatings Market Revenue (Million), by Country 2025 & 2033
- Figure 140: Rest of ASEAN ASEAN Protective Coatings Market Volume (liter ), by Country 2025 & 2033
- Figure 141: Rest of ASEAN ASEAN Protective Coatings Market Revenue Share (%), by Country 2025 & 2033
- Figure 142: Rest of ASEAN ASEAN Protective Coatings Market Volume Share (%), by Country 2025 & 2033
List of Tables
- Table 1: Global ASEAN Protective Coatings Market Revenue Million Forecast, by Resin Type 2020 & 2033
- Table 2: Global ASEAN Protective Coatings Market Volume liter Forecast, by Resin Type 2020 & 2033
- Table 3: Global ASEAN Protective Coatings Market Revenue Million Forecast, by Technology 2020 & 2033
- Table 4: Global ASEAN Protective Coatings Market Volume liter Forecast, by Technology 2020 & 2033
- Table 5: Global ASEAN Protective Coatings Market Revenue Million Forecast, by End User Industry 2020 & 2033
- Table 6: Global ASEAN Protective Coatings Market Volume liter Forecast, by End User Industry 2020 & 2033
- Table 7: Global ASEAN Protective Coatings Market Revenue Million Forecast, by Geography 2020 & 2033
- Table 8: Global ASEAN Protective Coatings Market Volume liter Forecast, by Geography 2020 & 2033
- Table 9: Global ASEAN Protective Coatings Market Revenue Million Forecast, by Region 2020 & 2033
- Table 10: Global ASEAN Protective Coatings Market Volume liter Forecast, by Region 2020 & 2033
- Table 11: Global ASEAN Protective Coatings Market Revenue Million Forecast, by Resin Type 2020 & 2033
- Table 12: Global ASEAN Protective Coatings Market Volume liter Forecast, by Resin Type 2020 & 2033
- Table 13: Global ASEAN Protective Coatings Market Revenue Million Forecast, by Technology 2020 & 2033
- Table 14: Global ASEAN Protective Coatings Market Volume liter Forecast, by Technology 2020 & 2033
- Table 15: Global ASEAN Protective Coatings Market Revenue Million Forecast, by End User Industry 2020 & 2033
- Table 16: Global ASEAN Protective Coatings Market Volume liter Forecast, by End User Industry 2020 & 2033
- Table 17: Global ASEAN Protective Coatings Market Revenue Million Forecast, by Geography 2020 & 2033
- Table 18: Global ASEAN Protective Coatings Market Volume liter Forecast, by Geography 2020 & 2033
- Table 19: Global ASEAN Protective Coatings Market Revenue Million Forecast, by Country 2020 & 2033
- Table 20: Global ASEAN Protective Coatings Market Volume liter Forecast, by Country 2020 & 2033
- Table 21: Global ASEAN Protective Coatings Market Revenue Million Forecast, by Resin Type 2020 & 2033
- Table 22: Global ASEAN Protective Coatings Market Volume liter Forecast, by Resin Type 2020 & 2033
- Table 23: Global ASEAN Protective Coatings Market Revenue Million Forecast, by Technology 2020 & 2033
- Table 24: Global ASEAN Protective Coatings Market Volume liter Forecast, by Technology 2020 & 2033
- Table 25: Global ASEAN Protective Coatings Market Revenue Million Forecast, by End User Industry 2020 & 2033
- Table 26: Global ASEAN Protective Coatings Market Volume liter Forecast, by End User Industry 2020 & 2033
- Table 27: Global ASEAN Protective Coatings Market Revenue Million Forecast, by Geography 2020 & 2033
- Table 28: Global ASEAN Protective Coatings Market Volume liter Forecast, by Geography 2020 & 2033
- Table 29: Global ASEAN Protective Coatings Market Revenue Million Forecast, by Country 2020 & 2033
- Table 30: Global ASEAN Protective Coatings Market Volume liter Forecast, by Country 2020 & 2033
- Table 31: Global ASEAN Protective Coatings Market Revenue Million Forecast, by Resin Type 2020 & 2033
- Table 32: Global ASEAN Protective Coatings Market Volume liter Forecast, by Resin Type 2020 & 2033
- Table 33: Global ASEAN Protective Coatings Market Revenue Million Forecast, by Technology 2020 & 2033
- Table 34: Global ASEAN Protective Coatings Market Volume liter Forecast, by Technology 2020 & 2033
- Table 35: Global ASEAN Protective Coatings Market Revenue Million Forecast, by End User Industry 2020 & 2033
- Table 36: Global ASEAN Protective Coatings Market Volume liter Forecast, by End User Industry 2020 & 2033
- Table 37: Global ASEAN Protective Coatings Market Revenue Million Forecast, by Geography 2020 & 2033
- Table 38: Global ASEAN Protective Coatings Market Volume liter Forecast, by Geography 2020 & 2033
- Table 39: Global ASEAN Protective Coatings Market Revenue Million Forecast, by Country 2020 & 2033
- Table 40: Global ASEAN Protective Coatings Market Volume liter Forecast, by Country 2020 & 2033
- Table 41: Global ASEAN Protective Coatings Market Revenue Million Forecast, by Resin Type 2020 & 2033
- Table 42: Global ASEAN Protective Coatings Market Volume liter Forecast, by Resin Type 2020 & 2033
- Table 43: Global ASEAN Protective Coatings Market Revenue Million Forecast, by Technology 2020 & 2033
- Table 44: Global ASEAN Protective Coatings Market Volume liter Forecast, by Technology 2020 & 2033
- Table 45: Global ASEAN Protective Coatings Market Revenue Million Forecast, by End User Industry 2020 & 2033
- Table 46: Global ASEAN Protective Coatings Market Volume liter Forecast, by End User Industry 2020 & 2033
- Table 47: Global ASEAN Protective Coatings Market Revenue Million Forecast, by Geography 2020 & 2033
- Table 48: Global ASEAN Protective Coatings Market Volume liter Forecast, by Geography 2020 & 2033
- Table 49: Global ASEAN Protective Coatings Market Revenue Million Forecast, by Country 2020 & 2033
- Table 50: Global ASEAN Protective Coatings Market Volume liter Forecast, by Country 2020 & 2033
- Table 51: Global ASEAN Protective Coatings Market Revenue Million Forecast, by Resin Type 2020 & 2033
- Table 52: Global ASEAN Protective Coatings Market Volume liter Forecast, by Resin Type 2020 & 2033
- Table 53: Global ASEAN Protective Coatings Market Revenue Million Forecast, by Technology 2020 & 2033
- Table 54: Global ASEAN Protective Coatings Market Volume liter Forecast, by Technology 2020 & 2033
- Table 55: Global ASEAN Protective Coatings Market Revenue Million Forecast, by End User Industry 2020 & 2033
- Table 56: Global ASEAN Protective Coatings Market Volume liter Forecast, by End User Industry 2020 & 2033
- Table 57: Global ASEAN Protective Coatings Market Revenue Million Forecast, by Geography 2020 & 2033
- Table 58: Global ASEAN Protective Coatings Market Volume liter Forecast, by Geography 2020 & 2033
- Table 59: Global ASEAN Protective Coatings Market Revenue Million Forecast, by Country 2020 & 2033
- Table 60: Global ASEAN Protective Coatings Market Volume liter Forecast, by Country 2020 & 2033
- Table 61: Global ASEAN Protective Coatings Market Revenue Million Forecast, by Resin Type 2020 & 2033
- Table 62: Global ASEAN Protective Coatings Market Volume liter Forecast, by Resin Type 2020 & 2033
- Table 63: Global ASEAN Protective Coatings Market Revenue Million Forecast, by Technology 2020 & 2033
- Table 64: Global ASEAN Protective Coatings Market Volume liter Forecast, by Technology 2020 & 2033
- Table 65: Global ASEAN Protective Coatings Market Revenue Million Forecast, by End User Industry 2020 & 2033
- Table 66: Global ASEAN Protective Coatings Market Volume liter Forecast, by End User Industry 2020 & 2033
- Table 67: Global ASEAN Protective Coatings Market Revenue Million Forecast, by Geography 2020 & 2033
- Table 68: Global ASEAN Protective Coatings Market Volume liter Forecast, by Geography 2020 & 2033
- Table 69: Global ASEAN Protective Coatings Market Revenue Million Forecast, by Country 2020 & 2033
- Table 70: Global ASEAN Protective Coatings Market Volume liter Forecast, by Country 2020 & 2033
- Table 71: Global ASEAN Protective Coatings Market Revenue Million Forecast, by Resin Type 2020 & 2033
- Table 72: Global ASEAN Protective Coatings Market Volume liter Forecast, by Resin Type 2020 & 2033
- Table 73: Global ASEAN Protective Coatings Market Revenue Million Forecast, by Technology 2020 & 2033
- Table 74: Global ASEAN Protective Coatings Market Volume liter Forecast, by Technology 2020 & 2033
- Table 75: Global ASEAN Protective Coatings Market Revenue Million Forecast, by End User Industry 2020 & 2033
- Table 76: Global ASEAN Protective Coatings Market Volume liter Forecast, by End User Industry 2020 & 2033
- Table 77: Global ASEAN Protective Coatings Market Revenue Million Forecast, by Geography 2020 & 2033
- Table 78: Global ASEAN Protective Coatings Market Volume liter Forecast, by Geography 2020 & 2033
- Table 79: Global ASEAN Protective Coatings Market Revenue Million Forecast, by Country 2020 & 2033
- Table 80: Global ASEAN Protective Coatings Market Volume liter Forecast, by Country 2020 & 2033
Frequently Asked Questions
1. What is the projected Compound Annual Growth Rate (CAGR) of the ASEAN Protective Coatings Market?
The projected CAGR is approximately > 3.00%.
2. Which companies are prominent players in the ASEAN Protective Coatings Market?
Key companies in the market include AkzoNobel N V, Jotun, RPM International Inc, Nippon Paint China, BOXER Paint, PPG Industries Inc, Dover Paints Manufacturing, Axalta Coating Systems, Hempel A/S, PUTRAMATARAM, The Sherwin Williams Company, Helios Coatings, IST Paint SDN BHD, Kossan Paint, Sino Polymer, Noroo Paint, Asian Paints, Welda Paint*List Not Exhaustive, Aplus Paints.
3. What are the main segments of the ASEAN Protective Coatings Market?
The market segments include Resin Type, Technology, End User Industry, Geography.
4. Can you provide details about the market size?
The market size is estimated to be USD 300 Million as of 2022.
5. What are some drivers contributing to market growth?
Accelerating Demand from the Infrastructure sector; Increasing Demand for Protective Coatings in Malaysia.
6. What are the notable trends driving market growth?
Rising Demand from Infrastructure Sector.
7. Are there any restraints impacting market growth?
Price Hikes of Raw Materials; Other Restraints.
8. Can you provide examples of recent developments in the market?
N/A
9. What pricing options are available for accessing the report?
Pricing options include single-user, multi-user, and enterprise licenses priced at USD 4750, USD 5250, and USD 8750 respectively.
10. Is the market size provided in terms of value or volume?
The market size is provided in terms of value, measured in Million and volume, measured in liter .
11. Are there any specific market keywords associated with the report?
Yes, the market keyword associated with the report is "ASEAN Protective Coatings Market," which aids in identifying and referencing the specific market segment covered.
12. How do I determine which pricing option suits my needs best?
The pricing options vary based on user requirements and access needs. Individual users may opt for single-user licenses, while businesses requiring broader access may choose multi-user or enterprise licenses for cost-effective access to the report.
13. Are there any additional resources or data provided in the ASEAN Protective Coatings Market report?
While the report offers comprehensive insights, it's advisable to review the specific contents or supplementary materials provided to ascertain if additional resources or data are available.
14. How can I stay updated on further developments or reports in the ASEAN Protective Coatings Market?
To stay informed about further developments, trends, and reports in the ASEAN Protective Coatings Market, consider subscribing to industry newsletters, following relevant companies and organizations, or regularly checking reputable industry news sources and publications.
Methodology
Step 1 - Identification of Relevant Samples Size from Population Database


Step 2 - Approaches for Defining Global Market Size (Value, Volume* & Price*)

Note*: In applicable scenarios
Step 3 - Data Sources
Primary Research
- Web Analytics
- Survey Reports
- Research Institute
- Latest Research Reports
- Opinion Leaders
Secondary Research
- Annual Reports
- White Paper
- Latest Press Release
- Industry Association
- Paid Database
- Investor Presentations

Step 4 - Data Triangulation
Involves using different sources of information in order to increase the validity of a study
These sources are likely to be stakeholders in a program - participants, other researchers, program staff, other community members, and so on.
Then we put all data in single framework & apply various statistical tools to find out the dynamic on the market.
During the analysis stage, feedback from the stakeholder groups would be compared to determine areas of agreement as well as areas of divergence