

Key Insights
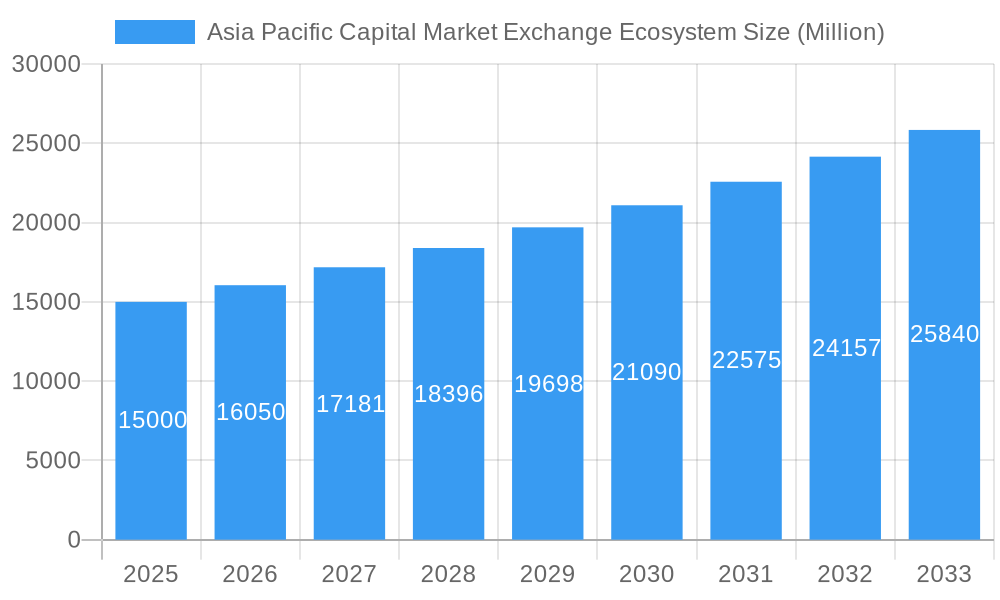
The Asia-Pacific capital market exchange ecosystem is experiencing significant expansion, propelled by increasing financialization, robust foreign direct investment (FDI), and the rapid adoption of digital financial services. The market, valued at $1120 billion in 2025, is forecast to grow at a Compound Annual Growth Rate (CAGR) of approximately 5.48% through 2033. Key growth drivers include a surge in Initial Public Offerings (IPOs) and secondary market activities from both established and emerging companies across technology, renewable energy, and consumer sectors. Supportive government initiatives focused on financial inclusion and market liberalization across the region further bolster this positive trend. Technological advancements, such as high-frequency trading and blockchain integration, are enhancing operational efficiency and attracting increased investment. However, geopolitical uncertainties and evolving regulatory landscapes present potential market challenges.
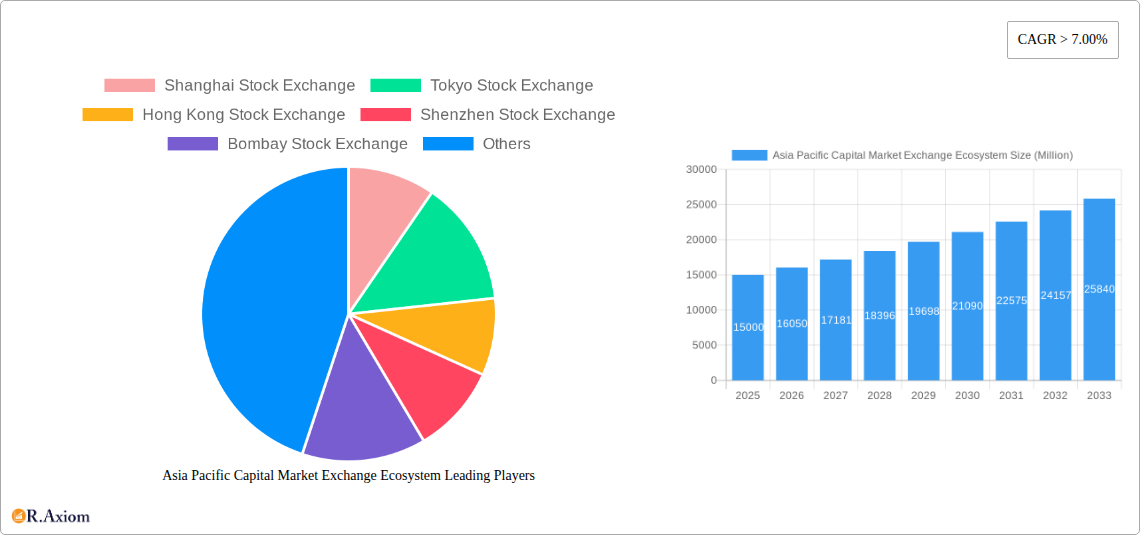
Asia Pacific Capital Market Exchange Ecosystem Market Size (In Million)
The ecosystem navigates several challenges, including fragmented regulatory frameworks across different nations, market volatility concerns, and the imperative for enhanced investor protection. Intense competition among established exchanges and the rise of innovative, technology-driven trading platforms contribute to a dynamic market. Despite these obstacles, the long-term outlook for the Asia-Pacific capital market exchange ecosystem remains strong, underpinned by the region's consistent economic growth and increasing global financial integration. Prominent exchanges like Shanghai, Tokyo, and Hong Kong highlight a highly competitive and adaptive landscape. Strategic collaborations, mergers, and acquisitions are anticipated to reshape competitive dynamics, with ongoing enhancements in market infrastructure and regulatory clarity crucial for realizing the market's full potential.
Asia Pacific Capital Market Exchange Ecosystem Company Market Share
This comprehensive market research report provides an in-depth analysis of the Asia-Pacific capital market exchange ecosystem. It covers market dynamics, leading players, growth catalysts, and future trends from 2019 to 2033. The study examines market concentration, innovation, industry trends, dominant markets, and emerging opportunities. With a base year of 2025 and a forecast period extending to 2033, this report is an essential resource for investors, industry stakeholders, and strategic decision-makers aiming to understand and leverage the significant growth opportunities within this dynamic region. The analysis incorporates historical data (2019-2024) and projected figures for 2025.
Asia Pacific Capital Market Exchange Ecosystem Market Concentration & Innovation
This section analyzes the level of market concentration within the Asia Pacific capital market exchange ecosystem, exploring the influence of major players like the Shanghai Stock Exchange, Tokyo Stock Exchange, and Hong Kong Stock Exchange. We examine the drivers of innovation, including technological advancements, regulatory changes, and competitive pressures. The analysis also delves into the regulatory frameworks governing these exchanges, considering their impact on market structure and competitiveness. Furthermore, the report investigates the presence of product substitutes and the evolving preferences of end-users, alongside a detailed overview of mergers and acquisitions (M&A) activity within the sector. Key metrics, including market share and M&A deal values (in Millions), will be presented to illustrate market dynamics. For example, the xx Million merger between X and Y illustrates a trend toward consolidation. The market share of the top three exchanges is estimated to be xx% in 2025, indicating a moderately concentrated market.
- Market Share Analysis: Detailed breakdown of market share held by key players across various segments.
- M&A Activity: Analysis of significant M&A deals, including deal values and strategic implications.
- Innovation Drivers: Examination of technological advancements, regulatory changes, and competitive pressures driving innovation.
- Regulatory Frameworks: Assessment of regulatory frameworks and their impact on market competition and growth.
Asia Pacific Capital Market Exchange Ecosystem Industry Trends & Insights
This section provides a comprehensive overview of the industry trends shaping the Asia Pacific capital market exchange ecosystem. It explores market growth drivers, including economic expansion, increasing investor participation, and supportive government policies. The report analyzes the impact of technological disruptions, such as the rise of fintech and digital trading platforms, on market structure and efficiency. Furthermore, it examines evolving consumer preferences, such as the growing demand for ESG (Environmental, Social, and Governance) investing and the increasing adoption of digital investment tools. The competitive dynamics within the sector, including strategies employed by key players, will also be analyzed. Key metrics such as Compound Annual Growth Rate (CAGR) and market penetration rates will be provided to quantify market growth. For example, the market is projected to grow at a CAGR of xx% during the forecast period (2025-2033), driven primarily by increasing retail investor participation and government initiatives promoting market development.
Dominant Markets & Segments in Asia Pacific Capital Market Exchange Ecosystem
This section identifies the leading regions, countries, and segments within the Asia Pacific capital market exchange ecosystem. A detailed dominance analysis will be conducted, highlighting the key factors contributing to the leadership position of specific markets or segments. This analysis will draw on various data points such as trading volumes, market capitalization, and investor participation. The leading markets are analyzed using a combination of qualitative and quantitative data.
- Key Drivers of Dominance:
- Economic Policies: Government initiatives and regulations supporting market development.
- Infrastructure: Availability of robust technological infrastructure supporting efficient trading.
- Investor Base: Size and sophistication of the investor base in a particular market.
- Market Depth and Liquidity: Extent of trading activity and ease of buying and selling securities.
Asia Pacific Capital Market Exchange Ecosystem Product Developments
This section summarizes the latest product innovations within the Asia Pacific capital market exchange ecosystem, including the introduction of new trading platforms, derivatives products, and risk management tools. The report will assess the applications of these new products and their competitive advantages. Key technological trends shaping product development, and the market fit of these innovations, will be discussed. For example, the increasing adoption of blockchain technology for improving trade settlement efficiency is a key development.
Report Scope & Segmentation Analysis
This section details the market segmentation used in the report, encompassing various aspects such as asset class (equities, bonds, derivatives), investor type (institutional, retail), and geographic location. Growth projections, market sizes (in Millions), and competitive dynamics within each segment will be presented. For example, the equities segment is expected to dominate the market, with a projected market size of xx Million in 2025. The report provides detailed information on the segmentation of the Asia Pacific capital market exchange ecosystem. Each segment will have its growth projections, market size, and competitive landscape detailed.
Key Drivers of Asia Pacific Capital Market Exchange Ecosystem Growth
This section identifies and analyzes the key factors driving the growth of the Asia Pacific capital market exchange ecosystem. This includes technological advancements, such as the increasing adoption of electronic trading platforms and algorithmic trading, and favourable economic conditions, including robust economic growth in several Asian countries and the increasing affluence of the middle class. Government regulations promoting market development also play a vital role.
Challenges in the Asia Pacific Capital Market Exchange Ecosystem Sector
This section examines the challenges faced by the Asia Pacific capital market exchange ecosystem. These include regulatory hurdles, such as differing regulatory frameworks across countries and the ongoing need for regulatory clarity regarding new technologies, and supply chain issues, including potential disruptions to global financial markets and increased cybersecurity risks. Competitive pressures also exist, such as the increasing competition from international exchanges and the emergence of new trading platforms. The report quantifies these challenges where possible. For example, regulatory uncertainty could delay market development by xx years, while cybersecurity risks lead to an estimated xx Million in losses annually.
Emerging Opportunities in Asia Pacific Capital Market Exchange Ecosystem
This section highlights emerging trends and opportunities within the Asia Pacific capital market exchange ecosystem. These include the growth of ESG investing, increasing demand for digital financial services and the rise of new technologies, such as Artificial Intelligence (AI) and Machine Learning (ML). The expansion into new markets, such as those in Southeast Asia and South Asia, presents significant growth opportunities. The expansion into new and underdeveloped markets presents a significant opportunity for growth.
Leading Players in the Asia Pacific Capital Market Exchange Ecosystem Market
Key Developments in Asia Pacific Capital Market Exchange Ecosystem Industry
- July 2022: Eligible companies listed on the Beijing Stock Exchange were allowed to apply for transfer to the Star Market of the Shanghai Stock Exchange. This transfer system strengthens the bridge between China's multi-layered capital market.
- February 2022: The China Securities Regulatory Commission (CSRC) approved the merger of Shenzhen Stock Exchange's main board with the SME board. This merger optimizes the Shenzhen Stock Exchange's trading structure.
Strategic Outlook for Asia Pacific Capital Market Exchange Ecosystem Market
The Asia Pacific capital market exchange ecosystem is poised for continued growth, driven by factors such as increasing economic activity, rising investor participation, and technological advancements. The expansion into new markets and the development of innovative financial products will further fuel market expansion. While challenges remain, the overall outlook for the sector is positive, presenting significant opportunities for investors and stakeholders alike. The projected growth is fueled by continued economic expansion and the growing popularity of digital investing platforms across the region.
Asia Pacific Capital Market Exchange Ecosystem Segmentation
-
1. Type of Market
- 1.1. Primary Market
- 1.2. Secondary Market
-
2. Financial Product
- 2.1. Debt
- 2.2. Equity
-
3. Investors
- 3.1. Retail Investors
- 3.2. Institutional Investors
Asia Pacific Capital Market Exchange Ecosystem Segmentation By Geography
-
1. Asia Pacific
- 1.1. China
- 1.2. Japan
- 1.3. South Korea
- 1.4. India
- 1.5. Australia
- 1.6. New Zealand
- 1.7. Indonesia
- 1.8. Malaysia
- 1.9. Singapore
- 1.10. Thailand
- 1.11. Vietnam
- 1.12. Philippines
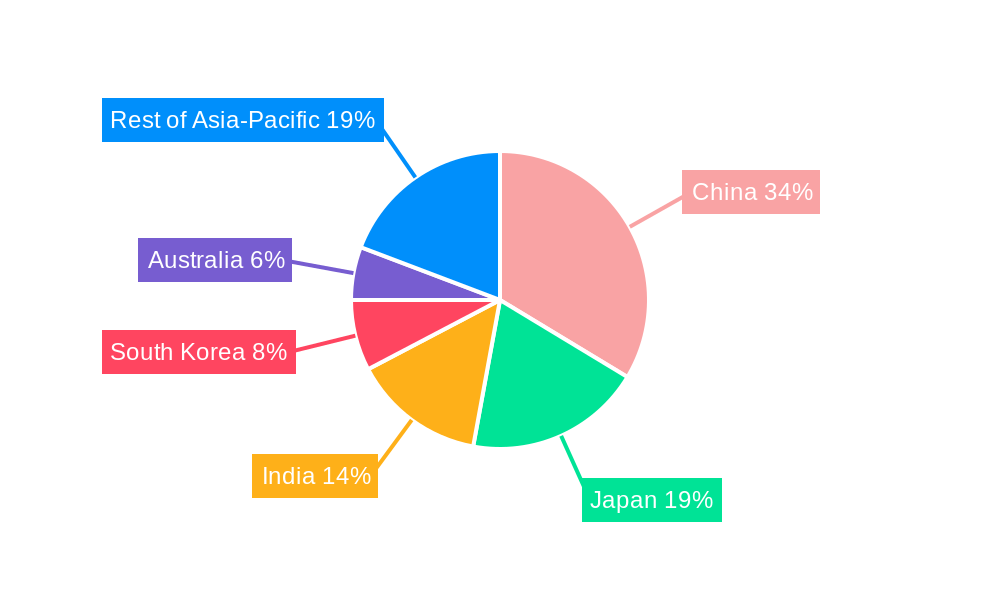
Asia Pacific Capital Market Exchange Ecosystem Regional Market Share
Geographic Coverage of Asia Pacific Capital Market Exchange Ecosystem
Asia Pacific Capital Market Exchange Ecosystem REPORT HIGHLIGHTS
| Aspects | Details |
|---|---|
| Study Period | 2020-2034 |
| Base Year | 2025 |
| Estimated Year | 2026 |
| Forecast Period | 2026-2034 |
| Historical Period | 2020-2025 |
| Growth Rate | CAGR of 5.48% from 2020-2034 |
| Segmentation |
|
Table of Contents
- 1. Introduction
- 1.1. Research Scope
- 1.2. Market Segmentation
- 1.3. Research Objective
- 1.4. Definitions and Assumptions
- 2. Executive Summary
- 2.1. Market Snapshot
- 3. Market Dynamics
- 3.1. Market Drivers
- 3.2. Market Restrains
- 3.3. Market Trends
- 3.4. Market Opportunities
- 4. Market Factor Analysis
- 4.1. Porters Five Forces
- 4.1.1. Bargaining Power of Suppliers
- 4.1.2. Bargaining Power of Buyers
- 4.1.3. Threat of New Entrants
- 4.1.4. Threat of Substitutes
- 4.1.5. Competitive Rivalry
- 4.2. PESTEL analysis
- 4.3. BCG Analysis
- 4.3.1. Stars (High Growth, High Market Share)
- 4.3.2. Cash Cows (Low Growth, High Market Share)
- 4.3.3. Question Mark (High Growth, Low Market Share)
- 4.3.4. Dogs (Low Growth, Low Market Share)
- 4.4. Ansoff Matrix Analysis
- 4.5. Supply Chain Analysis
- 4.6. Regulatory Landscape
- 4.7. Current Market Potential and Opportunity Assessment (TAM–SAM–SOM Framework)
- 4.8. RAX Analyst Note
- 4.1. Porters Five Forces
- 5. Market Analysis, Insights and Forecast 2021-2033
- 5.1. Market Analysis, Insights and Forecast - by Type of Market
- 5.1.1. Primary Market
- 5.1.2. Secondary Market
- 5.2. Market Analysis, Insights and Forecast - by Financial Product
- 5.2.1. Debt
- 5.2.2. Equity
- 5.3. Market Analysis, Insights and Forecast - by Investors
- 5.3.1. Retail Investors
- 5.3.2. Institutional Investors
- 5.4. Market Analysis, Insights and Forecast - by Region
- 5.4.1. Asia Pacific
- 5.1. Market Analysis, Insights and Forecast - by Type of Market
- 6. Asia Pacific Capital Market Exchange Ecosystem Analysis, Insights and Forecast, 2021-2033
- 6.1. Market Analysis, Insights and Forecast - by Type of Market
- 6.1.1. Primary Market
- 6.1.2. Secondary Market
- 6.2. Market Analysis, Insights and Forecast - by Financial Product
- 6.2.1. Debt
- 6.2.2. Equity
- 6.3. Market Analysis, Insights and Forecast - by Investors
- 6.3.1. Retail Investors
- 6.3.2. Institutional Investors
- 6.1. Market Analysis, Insights and Forecast - by Type of Market
- 7. Competitive Analysis
- 7.1. Company Profiles
- 7.1.1 Shanghai Stock Exchange
- 7.1.1.1. Company Overview
- 7.1.1.2. Products
- 7.1.1.3. Company Financials
- 7.1.1.4. SWOT Analysis
- 7.1.2 Tokyo Stock Exchange
- 7.1.2.1. Company Overview
- 7.1.2.2. Products
- 7.1.2.3. Company Financials
- 7.1.2.4. SWOT Analysis
- 7.1.3 Hong Kong Stock Exchange
- 7.1.3.1. Company Overview
- 7.1.3.2. Products
- 7.1.3.3. Company Financials
- 7.1.3.4. SWOT Analysis
- 7.1.4 Shenzhen Stock Exchange
- 7.1.4.1. Company Overview
- 7.1.4.2. Products
- 7.1.4.3. Company Financials
- 7.1.4.4. SWOT Analysis
- 7.1.5 Bombay Stock Exchange
- 7.1.5.1. Company Overview
- 7.1.5.2. Products
- 7.1.5.3. Company Financials
- 7.1.5.4. SWOT Analysis
- 7.1.6 National Stock Exchange
- 7.1.6.1. Company Overview
- 7.1.6.2. Products
- 7.1.6.3. Company Financials
- 7.1.6.4. SWOT Analysis
- 7.1.7 Korea Exchange
- 7.1.7.1. Company Overview
- 7.1.7.2. Products
- 7.1.7.3. Company Financials
- 7.1.7.4. SWOT Analysis
- 7.1.8 Taiwan Stock Exchange
- 7.1.8.1. Company Overview
- 7.1.8.2. Products
- 7.1.8.3. Company Financials
- 7.1.8.4. SWOT Analysis
- 7.1.9 Singapore Exchange
- 7.1.9.1. Company Overview
- 7.1.9.2. Products
- 7.1.9.3. Company Financials
- 7.1.9.4. SWOT Analysis
- 7.1.10 The Stock Exchange of Thailand**List Not Exhaustive
- 7.1.10.1. Company Overview
- 7.1.10.2. Products
- 7.1.10.3. Company Financials
- 7.1.10.4. SWOT Analysis
- 7.1.1 Shanghai Stock Exchange
- 7.2. Market Entropy
- 7.2.1 Company's Key Areas Served
- 7.2.2 Recent Developments
- 7.3. Company Market Share Analysis 2025
- 7.3.1 Top 5 Companies Market Share Analysis
- 7.3.2 Top 3 Companies Market Share Analysis
- 7.4. List of Potential Customers
- 8. Research Methodology
List of Figures
- Figure 1: Asia Pacific Capital Market Exchange Ecosystem Revenue Breakdown (billion, %) by Product 2025 & 2033
- Figure 2: Asia Pacific Capital Market Exchange Ecosystem Share (%) by Company 2025
List of Tables
- Table 1: Asia Pacific Capital Market Exchange Ecosystem Revenue billion Forecast, by Type of Market 2020 & 2033
- Table 2: Asia Pacific Capital Market Exchange Ecosystem Revenue billion Forecast, by Financial Product 2020 & 2033
- Table 3: Asia Pacific Capital Market Exchange Ecosystem Revenue billion Forecast, by Investors 2020 & 2033
- Table 4: Asia Pacific Capital Market Exchange Ecosystem Revenue billion Forecast, by Region 2020 & 2033
- Table 5: Asia Pacific Capital Market Exchange Ecosystem Revenue billion Forecast, by Type of Market 2020 & 2033
- Table 6: Asia Pacific Capital Market Exchange Ecosystem Revenue billion Forecast, by Financial Product 2020 & 2033
- Table 7: Asia Pacific Capital Market Exchange Ecosystem Revenue billion Forecast, by Investors 2020 & 2033
- Table 8: Asia Pacific Capital Market Exchange Ecosystem Revenue billion Forecast, by Country 2020 & 2033
- Table 9: China Asia Pacific Capital Market Exchange Ecosystem Revenue (billion) Forecast, by Application 2020 & 2033
- Table 10: Japan Asia Pacific Capital Market Exchange Ecosystem Revenue (billion) Forecast, by Application 2020 & 2033
- Table 11: South Korea Asia Pacific Capital Market Exchange Ecosystem Revenue (billion) Forecast, by Application 2020 & 2033
- Table 12: India Asia Pacific Capital Market Exchange Ecosystem Revenue (billion) Forecast, by Application 2020 & 2033
- Table 13: Australia Asia Pacific Capital Market Exchange Ecosystem Revenue (billion) Forecast, by Application 2020 & 2033
- Table 14: New Zealand Asia Pacific Capital Market Exchange Ecosystem Revenue (billion) Forecast, by Application 2020 & 2033
- Table 15: Indonesia Asia Pacific Capital Market Exchange Ecosystem Revenue (billion) Forecast, by Application 2020 & 2033
- Table 16: Malaysia Asia Pacific Capital Market Exchange Ecosystem Revenue (billion) Forecast, by Application 2020 & 2033
- Table 17: Singapore Asia Pacific Capital Market Exchange Ecosystem Revenue (billion) Forecast, by Application 2020 & 2033
- Table 18: Thailand Asia Pacific Capital Market Exchange Ecosystem Revenue (billion) Forecast, by Application 2020 & 2033
- Table 19: Vietnam Asia Pacific Capital Market Exchange Ecosystem Revenue (billion) Forecast, by Application 2020 & 2033
- Table 20: Philippines Asia Pacific Capital Market Exchange Ecosystem Revenue (billion) Forecast, by Application 2020 & 2033
Frequently Asked Questions
1. What is the projected Compound Annual Growth Rate (CAGR) of the Asia Pacific Capital Market Exchange Ecosystem?
The projected CAGR is approximately 5.48%.
2. Which companies are prominent players in the Asia Pacific Capital Market Exchange Ecosystem?
Key companies in the market include Shanghai Stock Exchange, Tokyo Stock Exchange, Hong Kong Stock Exchange, Shenzhen Stock Exchange, Bombay Stock Exchange, National Stock Exchange, Korea Exchange, Taiwan Stock Exchange, Singapore Exchange, The Stock Exchange of Thailand**List Not Exhaustive.
3. What are the main segments of the Asia Pacific Capital Market Exchange Ecosystem?
The market segments include Type of Market, Financial Product, Investors.
4. Can you provide details about the market size?
The market size is estimated to be USD 1120 billion as of 2022.
5. What are some drivers contributing to market growth?
N/A
6. What are the notable trends driving market growth?
Increasing Foreign Direct Investment in Various Developing Economies in Asia-Pacific.
7. Are there any restraints impacting market growth?
N/A
8. Can you provide examples of recent developments in the market?
July 2022: The eligible companies listed on Beijing Stock Exchange were allowed to apply for transfer to the Star Market of the Shanghai Stock Exchange. A transfer system is a positive approach for bridge-building efforts between China's multiple layers of the capital market.
9. What pricing options are available for accessing the report?
Pricing options include single-user, multi-user, and enterprise licenses priced at USD 3800, USD 4500, and USD 5800 respectively.
10. Is the market size provided in terms of value or volume?
The market size is provided in terms of value, measured in billion.
11. Are there any specific market keywords associated with the report?
Yes, the market keyword associated with the report is "Asia Pacific Capital Market Exchange Ecosystem," which aids in identifying and referencing the specific market segment covered.
12. How do I determine which pricing option suits my needs best?
The pricing options vary based on user requirements and access needs. Individual users may opt for single-user licenses, while businesses requiring broader access may choose multi-user or enterprise licenses for cost-effective access to the report.
13. Are there any additional resources or data provided in the Asia Pacific Capital Market Exchange Ecosystem report?
While the report offers comprehensive insights, it's advisable to review the specific contents or supplementary materials provided to ascertain if additional resources or data are available.
14. How can I stay updated on further developments or reports in the Asia Pacific Capital Market Exchange Ecosystem?
To stay informed about further developments, trends, and reports in the Asia Pacific Capital Market Exchange Ecosystem, consider subscribing to industry newsletters, following relevant companies and organizations, or regularly checking reputable industry news sources and publications.
Methodology
Step 1 - Identification of Relevant Samples Size from Population Database


Step 2 - Approaches for Defining Global Market Size (Value, Volume* & Price*)

Note*: In applicable scenarios
Step 3 - Data Sources
Primary Research
- Web Analytics
- Survey Reports
- Research Institute
- Latest Research Reports
- Opinion Leaders
Secondary Research
- Annual Reports
- White Paper
- Latest Press Release
- Industry Association
- Paid Database
- Investor Presentations

Step 4 - Data Triangulation
Involves using different sources of information in order to increase the validity of a study
These sources are likely to be stakeholders in a program - participants, other researchers, program staff, other community members, and so on.
Then we put all data in single framework & apply various statistical tools to find out the dynamic on the market.
During the analysis stage, feedback from the stakeholder groups would be compared to determine areas of agreement as well as areas of divergence