Key Insights
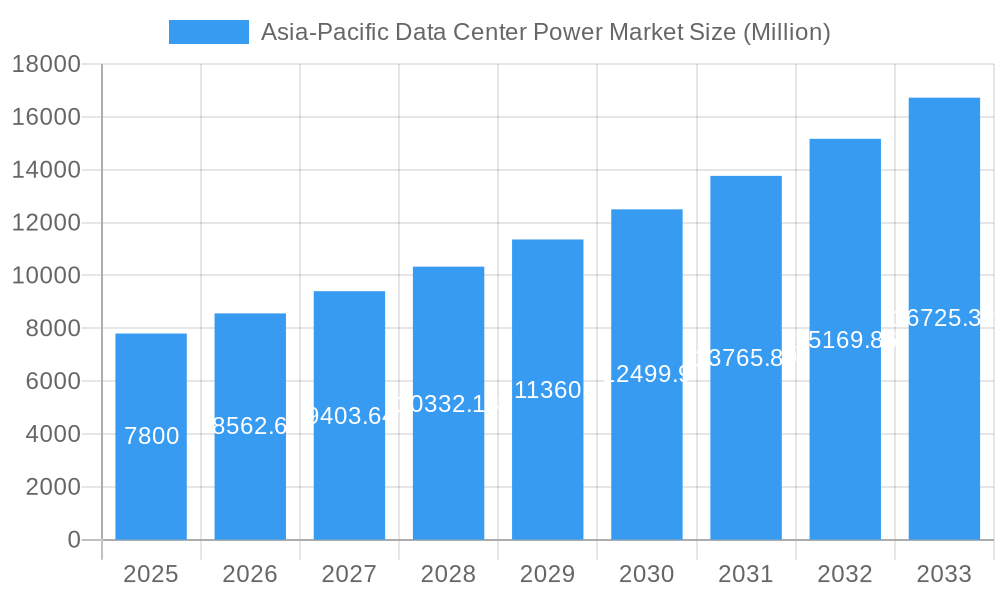
The Asia-Pacific data center power market is experiencing robust growth, projected to reach \$7.80 billion in 2025 and maintain a Compound Annual Growth Rate (CAGR) of 9.70% from 2025 to 2033. This expansion is fueled by several key drivers. Firstly, the region's burgeoning digital economy, driven by increasing internet penetration, e-commerce adoption, and the rise of cloud computing, necessitates substantial investments in data center infrastructure. Secondly, the growing adoption of high-performance computing (HPC) and artificial intelligence (AI) applications demands greater power capacity within data centers. Finally, government initiatives promoting digital transformation across various sectors further stimulate market growth. However, challenges such as high initial investment costs for power infrastructure and the need for reliable power supply in regions with fluctuating grid stability pose potential restraints. The market is segmented by power source (e.g., UPS, generators, renewable energy), data center size, and end-user industry. Leading players like ABB, Caterpillar, Cummins, Eaton, and Schneider Electric are shaping the market with innovative solutions, driving competition and technological advancements in power efficiency and reliability. The forecast period suggests continued expansion, with a significant increase in market value by 2033, driven by ongoing technological advancements, government support for data center development, and an ever-increasing demand for digital services in the Asia-Pacific region. This positive outlook emphasizes the strategic importance of investing in and optimizing power solutions for the region's rapidly evolving data center landscape.
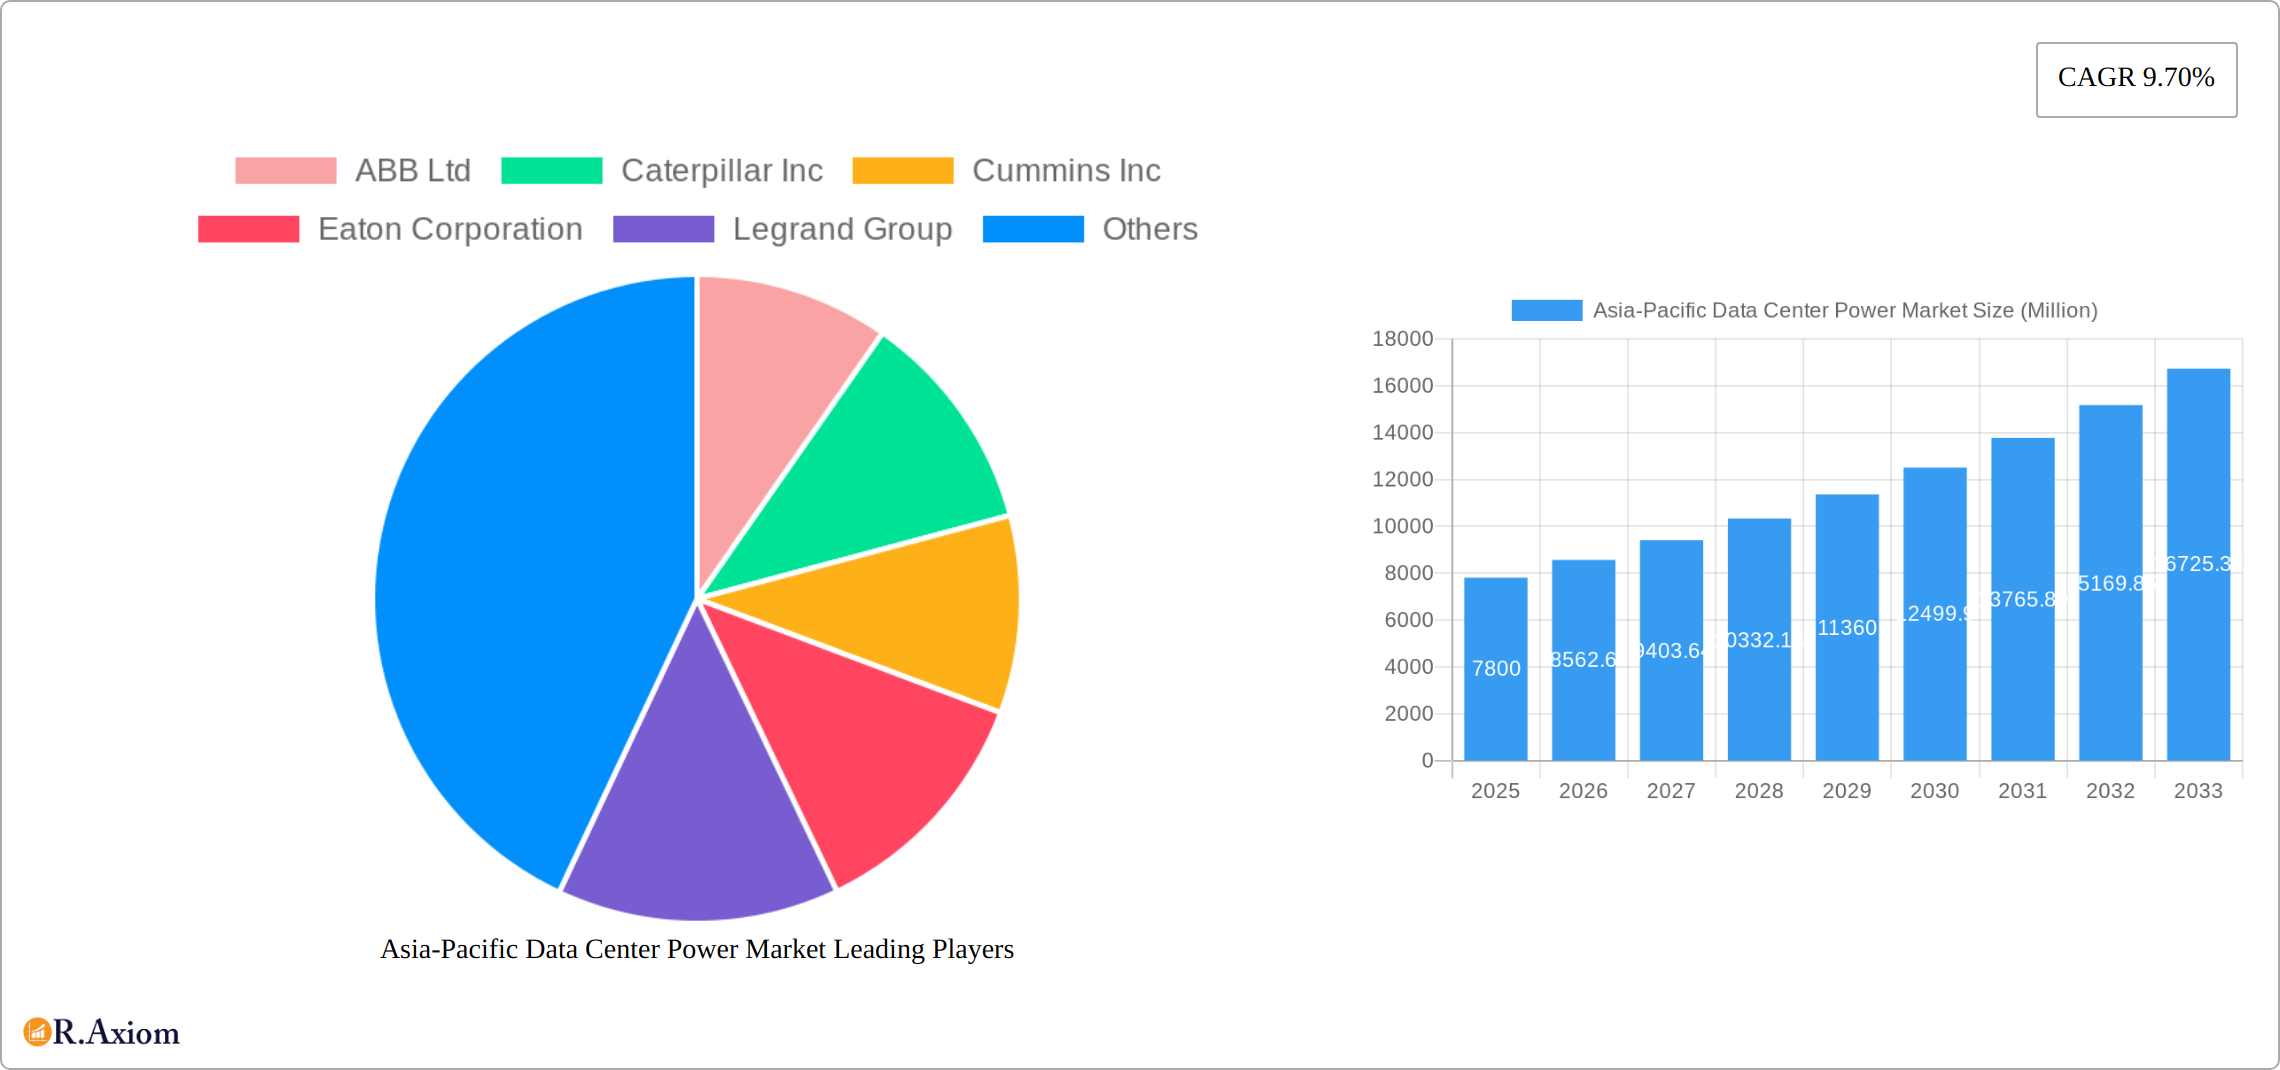
Asia-Pacific Data Center Power Market Market Size (In Billion)
The competitive landscape is highly dynamic, with both established players and emerging technology providers vying for market share. Key players are focused on delivering advanced solutions including intelligent power management systems, energy-efficient power distribution units (PDUs), and innovative cooling technologies. Furthermore, the rising demand for sustainable energy solutions is driving investment in renewable energy integration within data centers, creating new opportunities for market participants. The regional disparity within Asia-Pacific also contributes to market segmentation, with varying growth rates across countries based on economic development, infrastructure maturity, and regulatory environments. Strategic alliances, mergers, and acquisitions are expected to further shape the market landscape in the coming years. This continuous evolution necessitates proactive adaptation and innovation from businesses operating within this rapidly expanding sector.
Asia-Pacific Data Center Power Market Company Market Share
This in-depth report provides a comprehensive analysis of the Asia-Pacific data center power market, offering invaluable insights for industry stakeholders, investors, and strategists. The study covers the period 2019-2033, with a focus on the forecast period 2025-2033, and utilizes 2025 as the base year. The report leverages rigorous research methodologies to deliver actionable intelligence on market size, growth drivers, challenges, and opportunities.
Asia-Pacific Data Center Power Market Market Concentration & Innovation
This section analyzes the competitive landscape of the Asia-Pacific data center power market, focusing on market concentration, innovation drivers, regulatory frameworks, product substitutes, end-user trends, mergers and acquisitions (M&A) activities, and emerging technological disruptions. The market exhibits a moderately concentrated structure with a few dominant players commanding significant market share. However, the presence of numerous smaller, agile companies fosters a dynamic and intensely competitive environment. This competitive landscape is further shaped by rapid technological advancements and evolving regulatory landscapes.
- Market Share & Competitive Dynamics: While Schneider Electric, ABB Ltd, and Vertiv Group Corp maintain leading positions (estimated at xx%, xx%, and xx% respectively in 2025), the market share distribution is fluid. Strategic alliances, innovative product launches, and aggressive pricing strategies by both established players and emerging competitors constantly reshape the market dynamics.
- Innovation Drivers: The insatiable demand for higher power density, improved energy efficiency (driven by sustainability concerns and rising energy costs), and sophisticated power management solutions fuels continuous innovation. Key advancements include intelligent PDUs, AI-powered predictive maintenance, and the integration of renewable energy sources into data center power systems.
- Regulatory Frameworks & Sustainability: Stringent government regulations promoting energy efficiency and carbon emission reduction significantly influence market trajectory. These regulations drive the adoption of energy-efficient power solutions and incentivize the use of renewable energy sources, creating both opportunities and challenges for market participants. Compliance requirements vary across the region, leading to complexities in market entry and operations.
- Product Substitutes & Indirect Competition: Although few direct substitutes exist for core data center power infrastructure, indirect competition arises from renewable energy sources, innovative cooling technologies (e.g., liquid cooling), and alternative energy storage solutions. This underscores the importance of adaptability and diversification for market players.
- End-User Trends & Sectoral Demand: The burgeoning adoption of cloud computing, big data analytics, artificial intelligence, and the expanding digital economy across diverse sectors (including IT, finance, healthcare, and e-commerce) fuels the robust demand for data center power solutions. This diverse end-user base contributes to the market's resilience and growth prospects.
- M&A Activities & Strategic Consolidation: The data center power market has witnessed considerable M&A activity in recent years, with larger players strategically acquiring smaller companies to expand their product portfolios, enhance technological capabilities, and broaden their geographical reach. The total M&A deal value in the past 5 years is estimated at $xx Million, reflecting the strategic importance of this market.
Asia-Pacific Data Center Power Market Industry Trends & Insights
This section explores the key trends and insights shaping the Asia-Pacific data center power market, examining market growth drivers, technological disruptions, consumer preferences, and competitive dynamics. The market is experiencing robust growth, driven by several factors, including the proliferation of data centers, increasing energy consumption, and rising demand for advanced power management solutions.
The market is projected to register a Compound Annual Growth Rate (CAGR) of xx% during the forecast period (2025-2033). Market penetration is high in developed economies, with significant growth potential remaining in developing economies within the region. Technological disruptions, such as the adoption of AI-powered power management systems and the integration of renewable energy sources, are transforming the market landscape. Consumer preferences are increasingly shifting towards energy-efficient and sustainable solutions, which are becoming major differentiators in the marketplace. The competitive dynamics are characterized by intense rivalry, with leading players focusing on product innovation, strategic partnerships, and geographical expansion to maintain a competitive edge.
Dominant Markets & Segments in Asia-Pacific Data Center Power Market
This section identifies the leading regions, countries, and segments within the Asia-Pacific data center power market. China and Japan are currently the most dominant markets, driven by factors such as robust economic growth, expanding IT infrastructure, and increasing investments in data centers. Other key markets include South Korea, Singapore, and Australia.
- Key Drivers for China's Dominance:
- Rapid economic growth and substantial investments in IT infrastructure.
- Increasing adoption of cloud computing and big data analytics across various sectors.
- Government support for the development of the digital economy.
- Key Drivers for Japan's Dominance:
- High concentration of data centers serving major corporations.
- Advanced technological capabilities and innovation.
- Stringent energy efficiency standards and regulations.
Detailed dominance analysis is provided within the full report, covering diverse aspects including market size, growth rate, and competitive landscape. The report also identifies specific segments exhibiting substantial growth, like high-density power solutions, and explores the underlying drivers.
Asia-Pacific Data Center Power Market Product Developments
Recent years have witnessed significant advancements in data center power solutions, driven by the need for higher efficiency and improved power management capabilities. Intelligent PDUs, incorporating advanced monitoring and control features, have become increasingly prevalent. The adoption of modular and scalable power systems allows data centers to adapt more efficiently to changing power demands. Furthermore, the integration of renewable energy sources is gaining traction, reflecting a growing emphasis on environmental sustainability. This focus on efficiency, scalability, and sustainability is shaping the market's product landscape and competitive advantage.
Report Scope & Segmentation Analysis
This report segments the Asia-Pacific data center power market based on various parameters, including product type (e.g., UPS, PDUs, generators), power capacity, end-user (e.g., hyperscale data centers, colocation facilities), and geography. Each segment's market size, growth projections, and competitive dynamics are analyzed separately. Market sizes are provided for each segment for both historical (2019-2024) and forecast (2025-2033) periods, reflecting variations in growth rates based on product, application, and region. Detailed competitive dynamics are examined, including market share distribution and strategies of leading vendors.
Key Drivers of Asia-Pacific Data Center Power Market Growth
Several factors are driving the exponential growth of the Asia-Pacific data center power market. These include:
- Technological Advancements & Efficiency Gains: The continuous development of energy-efficient power solutions, including intelligent PDUs, high-density power systems, and advanced power conversion technologies, is a pivotal driver. These innovations not only improve performance but also reduce operational costs.
- Economic Growth & Infrastructure Development: The robust economic growth across many Asia-Pacific countries, coupled with increasing digitalization initiatives, fuels substantial investment in IT infrastructure, resulting in a surge in data center construction and expansion projects.
- Government Policies & Digital Transformation: Supportive government policies promoting digitalization, investment in renewable energy infrastructure, and the development of smart cities are significantly contributing to market growth. Many Asia-Pacific nations are actively implementing policies to foster energy efficiency within data centers and encourage the adoption of renewable energy sources.
- Data Center Hyperscale Growth: The expansion of hyperscale data centers by global cloud providers is a significant contributor to the market's growth trajectory, driving demand for high-capacity, reliable, and efficient power solutions.
Challenges in the Asia-Pacific Data Center Power Market Sector
The Asia-Pacific data center power market faces several notable challenges:
- Regulatory Hurdles & Market Fragmentation: Diverse and sometimes conflicting regulatory frameworks across different countries create complexities for market entry, operations, and compliance. This regulatory fragmentation requires careful navigation and strategic adaptation.
- Supply Chain Disruptions & Geopolitical Risks: Global supply chain issues and geopolitical uncertainties can significantly impact the availability, cost, and delivery timelines of critical components, potentially affecting production, pricing, and project timelines.
- Competitive Pressures & Price Volatility: The intensely competitive market necessitates continuous innovation, differentiation, and cost optimization to maintain market share. This competitive landscape can lead to price volatility and pressure on profit margins.
- Skills Gap & Talent Acquisition: The industry faces a growing skills gap, making it challenging to recruit and retain skilled professionals for installation, maintenance, and management of advanced power systems.
Emerging Opportunities in Asia-Pacific Data Center Power Market
Several promising opportunities exist within the Asia-Pacific data center power market:
- Expansion into Tier 2 and Tier 3 Cities: Significant growth potential lies beyond major metropolitan areas, as these secondary and tertiary cities experience increasing digital adoption and infrastructure development.
- Adoption of Renewable Energy Sources & Sustainability Initiatives: The integration of solar, wind, and other renewable energy sources presents compelling opportunities to offer sustainable and cost-effective power solutions, aligning with global sustainability goals.
- Development of AI-Powered Power Management Systems: The application of AI and machine learning for predictive maintenance, energy optimization, and advanced power management offers considerable potential for improving efficiency and reducing operational costs.
- Edge Computing Infrastructure: The rise of edge computing presents new opportunities for power solutions tailored to smaller, distributed data centers located closer to end-users.
Leading Players in the Asia-Pacific Data Center Power Market Market
Key Developments in Asia-Pacific Data Center Power Market Industry
- June 2023: Legrand introduced the next generation of intelligent rack power distribution units (PDUs), the server technology PRO4X and Raritan PX4 rack PDUs, enhancing power management visibility and security.
- May 2023: Eaton launched a G3 Universal Input Rack PDU with dynamic C39 outlets, improving adaptability to various plugs and voltage requirements.
Strategic Outlook for Asia-Pacific Data Center Power Market Market
The Asia-Pacific data center power market is poised for continued growth, driven by increasing demand for data center capacity, the adoption of advanced technologies, and supportive government policies. Opportunities exist for companies that can provide innovative, energy-efficient, and sustainable power solutions. Focusing on emerging markets, integrating renewable energy, and embracing AI-powered management systems are key strategic priorities for success in this dynamic market.
Asia-Pacific Data Center Power Market Segmentation
-
1. Power Infrastructure
-
1.1. Electrical Solution
- 1.1.1. UPS Systems
- 1.1.2. Generators
-
1.1.3. Power Distribution Solutions
- 1.1.3.1. PDU
- 1.1.3.2. Switchgear
- 1.1.3.3. Critical Power Distribution
- 1.1.3.4. Transfer Switches
- 1.1.3.5. Remote Power Panels
- 1.1.3.6. Others
- 1.2. Service
-
1.1. Electrical Solution
-
2. End User
- 2.1. IT and Telecommunication
- 2.2. BFSI
- 2.3. Government
- 2.4. Media and Entertainment
- 2.5. Other End Users
-
3. Geography
- 3.1. Australia
- 3.2. China
- 3.3. India
- 3.4. Indonesia
- 3.5. Philippines
- 3.6. Singapore
- 3.7. Malaysia
- 3.8. Japan
- 3.9. New Zealand
- 3.10. Thailand
- 3.11. Hong Kong
- 3.12. Taiwan
- 3.13. Vietnam
- 3.14. South Korea
Asia-Pacific Data Center Power Market Segmentation By Geography
- 1. Australia
- 2. China
- 3. India
- 4. Indonesia
- 5. Philippines
- 6. Singapore
- 7. Malaysia
- 8. Japan
- 9. New Zealand
- 10. Thailand
- 11. Hong Kong
- 12. Taiwan
- 13. Vietnam
- 14. South Korea
Asia-Pacific Data Center Power Market Regional Market Share
Geographic Coverage of Asia-Pacific Data Center Power Market
Asia-Pacific Data Center Power Market REPORT HIGHLIGHTS
| Aspects | Details |
|---|---|
| Study Period | 2020-2034 |
| Base Year | 2025 |
| Estimated Year | 2026 |
| Forecast Period | 2026-2034 |
| Historical Period | 2020-2025 |
| Growth Rate | CAGR of 9.70% from 2020-2034 |
| Segmentation |
|
Table of Contents
- 1. Introduction
- 1.1. Research Scope
- 1.2. Market Segmentation
- 1.3. Research Objective
- 1.4. Definitions and Assumptions
- 2. Executive Summary
- 2.1. Market Snapshot
- 3. Market Dynamics
- 3.1. Market Drivers
- 3.2. Market Restrains
- 3.3. Market Trends
- 3.4. Market Opportunities
- 4. Market Factor Analysis
- 4.1. Porters Five Forces
- 4.1.1. Bargaining Power of Suppliers
- 4.1.2. Bargaining Power of Buyers
- 4.1.3. Threat of New Entrants
- 4.1.4. Threat of Substitutes
- 4.1.5. Competitive Rivalry
- 4.2. PESTEL analysis
- 4.3. BCG Analysis
- 4.3.1. Stars (High Growth, High Market Share)
- 4.3.2. Cash Cows (Low Growth, High Market Share)
- 4.3.3. Question Mark (High Growth, Low Market Share)
- 4.3.4. Dogs (Low Growth, Low Market Share)
- 4.4. Ansoff Matrix Analysis
- 4.5. Supply Chain Analysis
- 4.6. Regulatory Landscape
- 4.7. Current Market Potential and Opportunity Assessment (TAM–SAM–SOM Framework)
- 4.8. RAX Analyst Note
- 4.1. Porters Five Forces
- 5. Market Analysis, Insights and Forecast 2021-2033
- 5.1. Market Analysis, Insights and Forecast - by Power Infrastructure
- 5.1.1. Electrical Solution
- 5.1.1.1. UPS Systems
- 5.1.1.2. Generators
- 5.1.1.3. Power Distribution Solutions
- 5.1.1.3.1. PDU
- 5.1.1.3.2. Switchgear
- 5.1.1.3.3. Critical Power Distribution
- 5.1.1.3.4. Transfer Switches
- 5.1.1.3.5. Remote Power Panels
- 5.1.1.3.6. Others
- 5.1.2. Service
- 5.1.1. Electrical Solution
- 5.2. Market Analysis, Insights and Forecast - by End User
- 5.2.1. IT and Telecommunication
- 5.2.2. BFSI
- 5.2.3. Government
- 5.2.4. Media and Entertainment
- 5.2.5. Other End Users
- 5.3. Market Analysis, Insights and Forecast - by Geography
- 5.3.1. Australia
- 5.3.2. China
- 5.3.3. India
- 5.3.4. Indonesia
- 5.3.5. Philippines
- 5.3.6. Singapore
- 5.3.7. Malaysia
- 5.3.8. Japan
- 5.3.9. New Zealand
- 5.3.10. Thailand
- 5.3.11. Hong Kong
- 5.3.12. Taiwan
- 5.3.13. Vietnam
- 5.3.14. South Korea
- 5.4. Market Analysis, Insights and Forecast - by Region
- 5.4.1. Australia
- 5.4.2. China
- 5.4.3. India
- 5.4.4. Indonesia
- 5.4.5. Philippines
- 5.4.6. Singapore
- 5.4.7. Malaysia
- 5.4.8. Japan
- 5.4.9. New Zealand
- 5.4.10. Thailand
- 5.4.11. Hong Kong
- 5.4.12. Taiwan
- 5.4.13. Vietnam
- 5.4.14. South Korea
- 5.1. Market Analysis, Insights and Forecast - by Power Infrastructure
- 6. Asia-Pacific Data Center Power Market Analysis, Insights and Forecast, 2021-2033
- 6.1. Market Analysis, Insights and Forecast - by Power Infrastructure
- 6.1.1. Electrical Solution
- 6.1.1.1. UPS Systems
- 6.1.1.2. Generators
- 6.1.1.3. Power Distribution Solutions
- 6.1.1.3.1. PDU
- 6.1.1.3.2. Switchgear
- 6.1.1.3.3. Critical Power Distribution
- 6.1.1.3.4. Transfer Switches
- 6.1.1.3.5. Remote Power Panels
- 6.1.1.3.6. Others
- 6.1.2. Service
- 6.1.1. Electrical Solution
- 6.2. Market Analysis, Insights and Forecast - by End User
- 6.2.1. IT and Telecommunication
- 6.2.2. BFSI
- 6.2.3. Government
- 6.2.4. Media and Entertainment
- 6.2.5. Other End Users
- 6.3. Market Analysis, Insights and Forecast - by Geography
- 6.3.1. Australia
- 6.3.2. China
- 6.3.3. India
- 6.3.4. Indonesia
- 6.3.5. Philippines
- 6.3.6. Singapore
- 6.3.7. Malaysia
- 6.3.8. Japan
- 6.3.9. New Zealand
- 6.3.10. Thailand
- 6.3.11. Hong Kong
- 6.3.12. Taiwan
- 6.3.13. Vietnam
- 6.3.14. South Korea
- 6.1. Market Analysis, Insights and Forecast - by Power Infrastructure
- 7. Australia Asia-Pacific Data Center Power Market Analysis, Insights and Forecast, 2020-2032
- 7.1. Market Analysis, Insights and Forecast - by Power Infrastructure
- 7.1.1. Electrical Solution
- 7.1.1.1. UPS Systems
- 7.1.1.2. Generators
- 7.1.1.3. Power Distribution Solutions
- 7.1.1.3.1. PDU
- 7.1.1.3.2. Switchgear
- 7.1.1.3.3. Critical Power Distribution
- 7.1.1.3.4. Transfer Switches
- 7.1.1.3.5. Remote Power Panels
- 7.1.1.3.6. Others
- 7.1.2. Service
- 7.1.1. Electrical Solution
- 7.2. Market Analysis, Insights and Forecast - by End User
- 7.2.1. IT and Telecommunication
- 7.2.2. BFSI
- 7.2.3. Government
- 7.2.4. Media and Entertainment
- 7.2.5. Other End Users
- 7.3. Market Analysis, Insights and Forecast - by Geography
- 7.3.1. Australia
- 7.3.2. China
- 7.3.3. India
- 7.3.4. Indonesia
- 7.3.5. Philippines
- 7.3.6. Singapore
- 7.3.7. Malaysia
- 7.3.8. Japan
- 7.3.9. New Zealand
- 7.3.10. Thailand
- 7.3.11. Hong Kong
- 7.3.12. Taiwan
- 7.3.13. Vietnam
- 7.3.14. South Korea
- 7.1. Market Analysis, Insights and Forecast - by Power Infrastructure
- 8. China Asia-Pacific Data Center Power Market Analysis, Insights and Forecast, 2020-2032
- 8.1. Market Analysis, Insights and Forecast - by Power Infrastructure
- 8.1.1. Electrical Solution
- 8.1.1.1. UPS Systems
- 8.1.1.2. Generators
- 8.1.1.3. Power Distribution Solutions
- 8.1.1.3.1. PDU
- 8.1.1.3.2. Switchgear
- 8.1.1.3.3. Critical Power Distribution
- 8.1.1.3.4. Transfer Switches
- 8.1.1.3.5. Remote Power Panels
- 8.1.1.3.6. Others
- 8.1.2. Service
- 8.1.1. Electrical Solution
- 8.2. Market Analysis, Insights and Forecast - by End User
- 8.2.1. IT and Telecommunication
- 8.2.2. BFSI
- 8.2.3. Government
- 8.2.4. Media and Entertainment
- 8.2.5. Other End Users
- 8.3. Market Analysis, Insights and Forecast - by Geography
- 8.3.1. Australia
- 8.3.2. China
- 8.3.3. India
- 8.3.4. Indonesia
- 8.3.5. Philippines
- 8.3.6. Singapore
- 8.3.7. Malaysia
- 8.3.8. Japan
- 8.3.9. New Zealand
- 8.3.10. Thailand
- 8.3.11. Hong Kong
- 8.3.12. Taiwan
- 8.3.13. Vietnam
- 8.3.14. South Korea
- 8.1. Market Analysis, Insights and Forecast - by Power Infrastructure
- 9. India Asia-Pacific Data Center Power Market Analysis, Insights and Forecast, 2020-2032
- 9.1. Market Analysis, Insights and Forecast - by Power Infrastructure
- 9.1.1. Electrical Solution
- 9.1.1.1. UPS Systems
- 9.1.1.2. Generators
- 9.1.1.3. Power Distribution Solutions
- 9.1.1.3.1. PDU
- 9.1.1.3.2. Switchgear
- 9.1.1.3.3. Critical Power Distribution
- 9.1.1.3.4. Transfer Switches
- 9.1.1.3.5. Remote Power Panels
- 9.1.1.3.6. Others
- 9.1.2. Service
- 9.1.1. Electrical Solution
- 9.2. Market Analysis, Insights and Forecast - by End User
- 9.2.1. IT and Telecommunication
- 9.2.2. BFSI
- 9.2.3. Government
- 9.2.4. Media and Entertainment
- 9.2.5. Other End Users
- 9.3. Market Analysis, Insights and Forecast - by Geography
- 9.3.1. Australia
- 9.3.2. China
- 9.3.3. India
- 9.3.4. Indonesia
- 9.3.5. Philippines
- 9.3.6. Singapore
- 9.3.7. Malaysia
- 9.3.8. Japan
- 9.3.9. New Zealand
- 9.3.10. Thailand
- 9.3.11. Hong Kong
- 9.3.12. Taiwan
- 9.3.13. Vietnam
- 9.3.14. South Korea
- 9.1. Market Analysis, Insights and Forecast - by Power Infrastructure
- 10. Indonesia Asia-Pacific Data Center Power Market Analysis, Insights and Forecast, 2020-2032
- 10.1. Market Analysis, Insights and Forecast - by Power Infrastructure
- 10.1.1. Electrical Solution
- 10.1.1.1. UPS Systems
- 10.1.1.2. Generators
- 10.1.1.3. Power Distribution Solutions
- 10.1.1.3.1. PDU
- 10.1.1.3.2. Switchgear
- 10.1.1.3.3. Critical Power Distribution
- 10.1.1.3.4. Transfer Switches
- 10.1.1.3.5. Remote Power Panels
- 10.1.1.3.6. Others
- 10.1.2. Service
- 10.1.1. Electrical Solution
- 10.2. Market Analysis, Insights and Forecast - by End User
- 10.2.1. IT and Telecommunication
- 10.2.2. BFSI
- 10.2.3. Government
- 10.2.4. Media and Entertainment
- 10.2.5. Other End Users
- 10.3. Market Analysis, Insights and Forecast - by Geography
- 10.3.1. Australia
- 10.3.2. China
- 10.3.3. India
- 10.3.4. Indonesia
- 10.3.5. Philippines
- 10.3.6. Singapore
- 10.3.7. Malaysia
- 10.3.8. Japan
- 10.3.9. New Zealand
- 10.3.10. Thailand
- 10.3.11. Hong Kong
- 10.3.12. Taiwan
- 10.3.13. Vietnam
- 10.3.14. South Korea
- 10.1. Market Analysis, Insights and Forecast - by Power Infrastructure
- 11. Philippines Asia-Pacific Data Center Power Market Analysis, Insights and Forecast, 2020-2032
- 11.1. Market Analysis, Insights and Forecast - by Power Infrastructure
- 11.1.1. Electrical Solution
- 11.1.1.1. UPS Systems
- 11.1.1.2. Generators
- 11.1.1.3. Power Distribution Solutions
- 11.1.1.3.1. PDU
- 11.1.1.3.2. Switchgear
- 11.1.1.3.3. Critical Power Distribution
- 11.1.1.3.4. Transfer Switches
- 11.1.1.3.5. Remote Power Panels
- 11.1.1.3.6. Others
- 11.1.2. Service
- 11.1.1. Electrical Solution
- 11.2. Market Analysis, Insights and Forecast - by End User
- 11.2.1. IT and Telecommunication
- 11.2.2. BFSI
- 11.2.3. Government
- 11.2.4. Media and Entertainment
- 11.2.5. Other End Users
- 11.3. Market Analysis, Insights and Forecast - by Geography
- 11.3.1. Australia
- 11.3.2. China
- 11.3.3. India
- 11.3.4. Indonesia
- 11.3.5. Philippines
- 11.3.6. Singapore
- 11.3.7. Malaysia
- 11.3.8. Japan
- 11.3.9. New Zealand
- 11.3.10. Thailand
- 11.3.11. Hong Kong
- 11.3.12. Taiwan
- 11.3.13. Vietnam
- 11.3.14. South Korea
- 11.1. Market Analysis, Insights and Forecast - by Power Infrastructure
- 12. Singapore Asia-Pacific Data Center Power Market Analysis, Insights and Forecast, 2020-2032
- 12.1. Market Analysis, Insights and Forecast - by Power Infrastructure
- 12.1.1. Electrical Solution
- 12.1.1.1. UPS Systems
- 12.1.1.2. Generators
- 12.1.1.3. Power Distribution Solutions
- 12.1.1.3.1. PDU
- 12.1.1.3.2. Switchgear
- 12.1.1.3.3. Critical Power Distribution
- 12.1.1.3.4. Transfer Switches
- 12.1.1.3.5. Remote Power Panels
- 12.1.1.3.6. Others
- 12.1.2. Service
- 12.1.1. Electrical Solution
- 12.2. Market Analysis, Insights and Forecast - by End User
- 12.2.1. IT and Telecommunication
- 12.2.2. BFSI
- 12.2.3. Government
- 12.2.4. Media and Entertainment
- 12.2.5. Other End Users
- 12.3. Market Analysis, Insights and Forecast - by Geography
- 12.3.1. Australia
- 12.3.2. China
- 12.3.3. India
- 12.3.4. Indonesia
- 12.3.5. Philippines
- 12.3.6. Singapore
- 12.3.7. Malaysia
- 12.3.8. Japan
- 12.3.9. New Zealand
- 12.3.10. Thailand
- 12.3.11. Hong Kong
- 12.3.12. Taiwan
- 12.3.13. Vietnam
- 12.3.14. South Korea
- 12.1. Market Analysis, Insights and Forecast - by Power Infrastructure
- 13. Malaysia Asia-Pacific Data Center Power Market Analysis, Insights and Forecast, 2020-2032
- 13.1. Market Analysis, Insights and Forecast - by Power Infrastructure
- 13.1.1. Electrical Solution
- 13.1.1.1. UPS Systems
- 13.1.1.2. Generators
- 13.1.1.3. Power Distribution Solutions
- 13.1.1.3.1. PDU
- 13.1.1.3.2. Switchgear
- 13.1.1.3.3. Critical Power Distribution
- 13.1.1.3.4. Transfer Switches
- 13.1.1.3.5. Remote Power Panels
- 13.1.1.3.6. Others
- 13.1.2. Service
- 13.1.1. Electrical Solution
- 13.2. Market Analysis, Insights and Forecast - by End User
- 13.2.1. IT and Telecommunication
- 13.2.2. BFSI
- 13.2.3. Government
- 13.2.4. Media and Entertainment
- 13.2.5. Other End Users
- 13.3. Market Analysis, Insights and Forecast - by Geography
- 13.3.1. Australia
- 13.3.2. China
- 13.3.3. India
- 13.3.4. Indonesia
- 13.3.5. Philippines
- 13.3.6. Singapore
- 13.3.7. Malaysia
- 13.3.8. Japan
- 13.3.9. New Zealand
- 13.3.10. Thailand
- 13.3.11. Hong Kong
- 13.3.12. Taiwan
- 13.3.13. Vietnam
- 13.3.14. South Korea
- 13.1. Market Analysis, Insights and Forecast - by Power Infrastructure
- 14. Japan Asia-Pacific Data Center Power Market Analysis, Insights and Forecast, 2020-2032
- 14.1. Market Analysis, Insights and Forecast - by Power Infrastructure
- 14.1.1. Electrical Solution
- 14.1.1.1. UPS Systems
- 14.1.1.2. Generators
- 14.1.1.3. Power Distribution Solutions
- 14.1.1.3.1. PDU
- 14.1.1.3.2. Switchgear
- 14.1.1.3.3. Critical Power Distribution
- 14.1.1.3.4. Transfer Switches
- 14.1.1.3.5. Remote Power Panels
- 14.1.1.3.6. Others
- 14.1.2. Service
- 14.1.1. Electrical Solution
- 14.2. Market Analysis, Insights and Forecast - by End User
- 14.2.1. IT and Telecommunication
- 14.2.2. BFSI
- 14.2.3. Government
- 14.2.4. Media and Entertainment
- 14.2.5. Other End Users
- 14.3. Market Analysis, Insights and Forecast - by Geography
- 14.3.1. Australia
- 14.3.2. China
- 14.3.3. India
- 14.3.4. Indonesia
- 14.3.5. Philippines
- 14.3.6. Singapore
- 14.3.7. Malaysia
- 14.3.8. Japan
- 14.3.9. New Zealand
- 14.3.10. Thailand
- 14.3.11. Hong Kong
- 14.3.12. Taiwan
- 14.3.13. Vietnam
- 14.3.14. South Korea
- 14.1. Market Analysis, Insights and Forecast - by Power Infrastructure
- 15. New Zealand Asia-Pacific Data Center Power Market Analysis, Insights and Forecast, 2020-2032
- 15.1. Market Analysis, Insights and Forecast - by Power Infrastructure
- 15.1.1. Electrical Solution
- 15.1.1.1. UPS Systems
- 15.1.1.2. Generators
- 15.1.1.3. Power Distribution Solutions
- 15.1.1.3.1. PDU
- 15.1.1.3.2. Switchgear
- 15.1.1.3.3. Critical Power Distribution
- 15.1.1.3.4. Transfer Switches
- 15.1.1.3.5. Remote Power Panels
- 15.1.1.3.6. Others
- 15.1.2. Service
- 15.1.1. Electrical Solution
- 15.2. Market Analysis, Insights and Forecast - by End User
- 15.2.1. IT and Telecommunication
- 15.2.2. BFSI
- 15.2.3. Government
- 15.2.4. Media and Entertainment
- 15.2.5. Other End Users
- 15.3. Market Analysis, Insights and Forecast - by Geography
- 15.3.1. Australia
- 15.3.2. China
- 15.3.3. India
- 15.3.4. Indonesia
- 15.3.5. Philippines
- 15.3.6. Singapore
- 15.3.7. Malaysia
- 15.3.8. Japan
- 15.3.9. New Zealand
- 15.3.10. Thailand
- 15.3.11. Hong Kong
- 15.3.12. Taiwan
- 15.3.13. Vietnam
- 15.3.14. South Korea
- 15.1. Market Analysis, Insights and Forecast - by Power Infrastructure
- 16. Thailand Asia-Pacific Data Center Power Market Analysis, Insights and Forecast, 2020-2032
- 16.1. Market Analysis, Insights and Forecast - by Power Infrastructure
- 16.1.1. Electrical Solution
- 16.1.1.1. UPS Systems
- 16.1.1.2. Generators
- 16.1.1.3. Power Distribution Solutions
- 16.1.1.3.1. PDU
- 16.1.1.3.2. Switchgear
- 16.1.1.3.3. Critical Power Distribution
- 16.1.1.3.4. Transfer Switches
- 16.1.1.3.5. Remote Power Panels
- 16.1.1.3.6. Others
- 16.1.2. Service
- 16.1.1. Electrical Solution
- 16.2. Market Analysis, Insights and Forecast - by End User
- 16.2.1. IT and Telecommunication
- 16.2.2. BFSI
- 16.2.3. Government
- 16.2.4. Media and Entertainment
- 16.2.5. Other End Users
- 16.3. Market Analysis, Insights and Forecast - by Geography
- 16.3.1. Australia
- 16.3.2. China
- 16.3.3. India
- 16.3.4. Indonesia
- 16.3.5. Philippines
- 16.3.6. Singapore
- 16.3.7. Malaysia
- 16.3.8. Japan
- 16.3.9. New Zealand
- 16.3.10. Thailand
- 16.3.11. Hong Kong
- 16.3.12. Taiwan
- 16.3.13. Vietnam
- 16.3.14. South Korea
- 16.1. Market Analysis, Insights and Forecast - by Power Infrastructure
- 17. Hong Kong Asia-Pacific Data Center Power Market Analysis, Insights and Forecast, 2020-2032
- 17.1. Market Analysis, Insights and Forecast - by Power Infrastructure
- 17.1.1. Electrical Solution
- 17.1.1.1. UPS Systems
- 17.1.1.2. Generators
- 17.1.1.3. Power Distribution Solutions
- 17.1.1.3.1. PDU
- 17.1.1.3.2. Switchgear
- 17.1.1.3.3. Critical Power Distribution
- 17.1.1.3.4. Transfer Switches
- 17.1.1.3.5. Remote Power Panels
- 17.1.1.3.6. Others
- 17.1.2. Service
- 17.1.1. Electrical Solution
- 17.2. Market Analysis, Insights and Forecast - by End User
- 17.2.1. IT and Telecommunication
- 17.2.2. BFSI
- 17.2.3. Government
- 17.2.4. Media and Entertainment
- 17.2.5. Other End Users
- 17.3. Market Analysis, Insights and Forecast - by Geography
- 17.3.1. Australia
- 17.3.2. China
- 17.3.3. India
- 17.3.4. Indonesia
- 17.3.5. Philippines
- 17.3.6. Singapore
- 17.3.7. Malaysia
- 17.3.8. Japan
- 17.3.9. New Zealand
- 17.3.10. Thailand
- 17.3.11. Hong Kong
- 17.3.12. Taiwan
- 17.3.13. Vietnam
- 17.3.14. South Korea
- 17.1. Market Analysis, Insights and Forecast - by Power Infrastructure
- 18. Taiwan Asia-Pacific Data Center Power Market Analysis, Insights and Forecast, 2020-2032
- 18.1. Market Analysis, Insights and Forecast - by Power Infrastructure
- 18.1.1. Electrical Solution
- 18.1.1.1. UPS Systems
- 18.1.1.2. Generators
- 18.1.1.3. Power Distribution Solutions
- 18.1.1.3.1. PDU
- 18.1.1.3.2. Switchgear
- 18.1.1.3.3. Critical Power Distribution
- 18.1.1.3.4. Transfer Switches
- 18.1.1.3.5. Remote Power Panels
- 18.1.1.3.6. Others
- 18.1.2. Service
- 18.1.1. Electrical Solution
- 18.2. Market Analysis, Insights and Forecast - by End User
- 18.2.1. IT and Telecommunication
- 18.2.2. BFSI
- 18.2.3. Government
- 18.2.4. Media and Entertainment
- 18.2.5. Other End Users
- 18.3. Market Analysis, Insights and Forecast - by Geography
- 18.3.1. Australia
- 18.3.2. China
- 18.3.3. India
- 18.3.4. Indonesia
- 18.3.5. Philippines
- 18.3.6. Singapore
- 18.3.7. Malaysia
- 18.3.8. Japan
- 18.3.9. New Zealand
- 18.3.10. Thailand
- 18.3.11. Hong Kong
- 18.3.12. Taiwan
- 18.3.13. Vietnam
- 18.3.14. South Korea
- 18.1. Market Analysis, Insights and Forecast - by Power Infrastructure
- 19. Vietnam Asia-Pacific Data Center Power Market Analysis, Insights and Forecast, 2020-2032
- 19.1. Market Analysis, Insights and Forecast - by Power Infrastructure
- 19.1.1. Electrical Solution
- 19.1.1.1. UPS Systems
- 19.1.1.2. Generators
- 19.1.1.3. Power Distribution Solutions
- 19.1.1.3.1. PDU
- 19.1.1.3.2. Switchgear
- 19.1.1.3.3. Critical Power Distribution
- 19.1.1.3.4. Transfer Switches
- 19.1.1.3.5. Remote Power Panels
- 19.1.1.3.6. Others
- 19.1.2. Service
- 19.1.1. Electrical Solution
- 19.2. Market Analysis, Insights and Forecast - by End User
- 19.2.1. IT and Telecommunication
- 19.2.2. BFSI
- 19.2.3. Government
- 19.2.4. Media and Entertainment
- 19.2.5. Other End Users
- 19.3. Market Analysis, Insights and Forecast - by Geography
- 19.3.1. Australia
- 19.3.2. China
- 19.3.3. India
- 19.3.4. Indonesia
- 19.3.5. Philippines
- 19.3.6. Singapore
- 19.3.7. Malaysia
- 19.3.8. Japan
- 19.3.9. New Zealand
- 19.3.10. Thailand
- 19.3.11. Hong Kong
- 19.3.12. Taiwan
- 19.3.13. Vietnam
- 19.3.14. South Korea
- 19.1. Market Analysis, Insights and Forecast - by Power Infrastructure
- 20. South Korea Asia-Pacific Data Center Power Market Analysis, Insights and Forecast, 2020-2032
- 20.1. Market Analysis, Insights and Forecast - by Power Infrastructure
- 20.1.1. Electrical Solution
- 20.1.1.1. UPS Systems
- 20.1.1.2. Generators
- 20.1.1.3. Power Distribution Solutions
- 20.1.1.3.1. PDU
- 20.1.1.3.2. Switchgear
- 20.1.1.3.3. Critical Power Distribution
- 20.1.1.3.4. Transfer Switches
- 20.1.1.3.5. Remote Power Panels
- 20.1.1.3.6. Others
- 20.1.2. Service
- 20.1.1. Electrical Solution
- 20.2. Market Analysis, Insights and Forecast - by End User
- 20.2.1. IT and Telecommunication
- 20.2.2. BFSI
- 20.2.3. Government
- 20.2.4. Media and Entertainment
- 20.2.5. Other End Users
- 20.3. Market Analysis, Insights and Forecast - by Geography
- 20.3.1. Australia
- 20.3.2. China
- 20.3.3. India
- 20.3.4. Indonesia
- 20.3.5. Philippines
- 20.3.6. Singapore
- 20.3.7. Malaysia
- 20.3.8. Japan
- 20.3.9. New Zealand
- 20.3.10. Thailand
- 20.3.11. Hong Kong
- 20.3.12. Taiwan
- 20.3.13. Vietnam
- 20.3.14. South Korea
- 20.1. Market Analysis, Insights and Forecast - by Power Infrastructure
- 21. Competitive Analysis
- 21.1. Company Profiles
- 21.1.1 ABB Ltd
- 21.1.1.1. Company Overview
- 21.1.1.2. Products
- 21.1.1.3. Company Financials
- 21.1.1.4. SWOT Analysis
- 21.1.2 Caterpillar Inc
- 21.1.2.1. Company Overview
- 21.1.2.2. Products
- 21.1.2.3. Company Financials
- 21.1.2.4. SWOT Analysis
- 21.1.3 Cummins Inc
- 21.1.3.1. Company Overview
- 21.1.3.2. Products
- 21.1.3.3. Company Financials
- 21.1.3.4. SWOT Analysis
- 21.1.4 Eaton Corporation
- 21.1.4.1. Company Overview
- 21.1.4.2. Products
- 21.1.4.3. Company Financials
- 21.1.4.4. SWOT Analysis
- 21.1.5 Legrand Group
- 21.1.5.1. Company Overview
- 21.1.5.2. Products
- 21.1.5.3. Company Financials
- 21.1.5.4. SWOT Analysis
- 21.1.6 Rolls-Royce PLC
- 21.1.6.1. Company Overview
- 21.1.6.2. Products
- 21.1.6.3. Company Financials
- 21.1.6.4. SWOT Analysis
- 21.1.7 Vertiv Group Corp
- 21.1.7.1. Company Overview
- 21.1.7.2. Products
- 21.1.7.3. Company Financials
- 21.1.7.4. SWOT Analysis
- 21.1.8 Schneider Electric SE
- 21.1.8.1. Company Overview
- 21.1.8.2. Products
- 21.1.8.3. Company Financials
- 21.1.8.4. SWOT Analysis
- 21.1.9 Rittal GmbH & Co KG
- 21.1.9.1. Company Overview
- 21.1.9.2. Products
- 21.1.9.3. Company Financials
- 21.1.9.4. SWOT Analysis
- 21.1.10 Fujitsu Limited
- 21.1.10.1. Company Overview
- 21.1.10.2. Products
- 21.1.10.3. Company Financials
- 21.1.10.4. SWOT Analysis
- 21.1.11 Cisco Systems Inc *List Not Exhaustive
- 21.1.11.1. Company Overview
- 21.1.11.2. Products
- 21.1.11.3. Company Financials
- 21.1.11.4. SWOT Analysis
- 21.1.1 ABB Ltd
- 21.2. Market Entropy
- 21.2.1 Company's Key Areas Served
- 21.2.2 Recent Developments
- 21.3. Company Market Share Analysis 2025
- 21.3.1 Top 5 Companies Market Share Analysis
- 21.3.2 Top 3 Companies Market Share Analysis
- 21.4. List of Potential Customers
- 22. Research Methodology
List of Figures
- Figure 1: Asia-Pacific Data Center Power Market Revenue Breakdown (Million, %) by Product 2025 & 2033
- Figure 2: Asia-Pacific Data Center Power Market Share (%) by Company 2025
List of Tables
- Table 1: Asia-Pacific Data Center Power Market Revenue Million Forecast, by Power Infrastructure 2020 & 2033
- Table 2: Asia-Pacific Data Center Power Market Volume Billion Forecast, by Power Infrastructure 2020 & 2033
- Table 3: Asia-Pacific Data Center Power Market Revenue Million Forecast, by End User 2020 & 2033
- Table 4: Asia-Pacific Data Center Power Market Volume Billion Forecast, by End User 2020 & 2033
- Table 5: Asia-Pacific Data Center Power Market Revenue Million Forecast, by Geography 2020 & 2033
- Table 6: Asia-Pacific Data Center Power Market Volume Billion Forecast, by Geography 2020 & 2033
- Table 7: Asia-Pacific Data Center Power Market Revenue Million Forecast, by Region 2020 & 2033
- Table 8: Asia-Pacific Data Center Power Market Volume Billion Forecast, by Region 2020 & 2033
- Table 9: Asia-Pacific Data Center Power Market Revenue Million Forecast, by Power Infrastructure 2020 & 2033
- Table 10: Asia-Pacific Data Center Power Market Volume Billion Forecast, by Power Infrastructure 2020 & 2033
- Table 11: Asia-Pacific Data Center Power Market Revenue Million Forecast, by End User 2020 & 2033
- Table 12: Asia-Pacific Data Center Power Market Volume Billion Forecast, by End User 2020 & 2033
- Table 13: Asia-Pacific Data Center Power Market Revenue Million Forecast, by Geography 2020 & 2033
- Table 14: Asia-Pacific Data Center Power Market Volume Billion Forecast, by Geography 2020 & 2033
- Table 15: Asia-Pacific Data Center Power Market Revenue Million Forecast, by Country 2020 & 2033
- Table 16: Asia-Pacific Data Center Power Market Volume Billion Forecast, by Country 2020 & 2033
- Table 17: Asia-Pacific Data Center Power Market Revenue Million Forecast, by Power Infrastructure 2020 & 2033
- Table 18: Asia-Pacific Data Center Power Market Volume Billion Forecast, by Power Infrastructure 2020 & 2033
- Table 19: Asia-Pacific Data Center Power Market Revenue Million Forecast, by End User 2020 & 2033
- Table 20: Asia-Pacific Data Center Power Market Volume Billion Forecast, by End User 2020 & 2033
- Table 21: Asia-Pacific Data Center Power Market Revenue Million Forecast, by Geography 2020 & 2033
- Table 22: Asia-Pacific Data Center Power Market Volume Billion Forecast, by Geography 2020 & 2033
- Table 23: Asia-Pacific Data Center Power Market Revenue Million Forecast, by Country 2020 & 2033
- Table 24: Asia-Pacific Data Center Power Market Volume Billion Forecast, by Country 2020 & 2033
- Table 25: Asia-Pacific Data Center Power Market Revenue Million Forecast, by Power Infrastructure 2020 & 2033
- Table 26: Asia-Pacific Data Center Power Market Volume Billion Forecast, by Power Infrastructure 2020 & 2033
- Table 27: Asia-Pacific Data Center Power Market Revenue Million Forecast, by End User 2020 & 2033
- Table 28: Asia-Pacific Data Center Power Market Volume Billion Forecast, by End User 2020 & 2033
- Table 29: Asia-Pacific Data Center Power Market Revenue Million Forecast, by Geography 2020 & 2033
- Table 30: Asia-Pacific Data Center Power Market Volume Billion Forecast, by Geography 2020 & 2033
- Table 31: Asia-Pacific Data Center Power Market Revenue Million Forecast, by Country 2020 & 2033
- Table 32: Asia-Pacific Data Center Power Market Volume Billion Forecast, by Country 2020 & 2033
- Table 33: Asia-Pacific Data Center Power Market Revenue Million Forecast, by Power Infrastructure 2020 & 2033
- Table 34: Asia-Pacific Data Center Power Market Volume Billion Forecast, by Power Infrastructure 2020 & 2033
- Table 35: Asia-Pacific Data Center Power Market Revenue Million Forecast, by End User 2020 & 2033
- Table 36: Asia-Pacific Data Center Power Market Volume Billion Forecast, by End User 2020 & 2033
- Table 37: Asia-Pacific Data Center Power Market Revenue Million Forecast, by Geography 2020 & 2033
- Table 38: Asia-Pacific Data Center Power Market Volume Billion Forecast, by Geography 2020 & 2033
- Table 39: Asia-Pacific Data Center Power Market Revenue Million Forecast, by Country 2020 & 2033
- Table 40: Asia-Pacific Data Center Power Market Volume Billion Forecast, by Country 2020 & 2033
- Table 41: Asia-Pacific Data Center Power Market Revenue Million Forecast, by Power Infrastructure 2020 & 2033
- Table 42: Asia-Pacific Data Center Power Market Volume Billion Forecast, by Power Infrastructure 2020 & 2033
- Table 43: Asia-Pacific Data Center Power Market Revenue Million Forecast, by End User 2020 & 2033
- Table 44: Asia-Pacific Data Center Power Market Volume Billion Forecast, by End User 2020 & 2033
- Table 45: Asia-Pacific Data Center Power Market Revenue Million Forecast, by Geography 2020 & 2033
- Table 46: Asia-Pacific Data Center Power Market Volume Billion Forecast, by Geography 2020 & 2033
- Table 47: Asia-Pacific Data Center Power Market Revenue Million Forecast, by Country 2020 & 2033
- Table 48: Asia-Pacific Data Center Power Market Volume Billion Forecast, by Country 2020 & 2033
- Table 49: Asia-Pacific Data Center Power Market Revenue Million Forecast, by Power Infrastructure 2020 & 2033
- Table 50: Asia-Pacific Data Center Power Market Volume Billion Forecast, by Power Infrastructure 2020 & 2033
- Table 51: Asia-Pacific Data Center Power Market Revenue Million Forecast, by End User 2020 & 2033
- Table 52: Asia-Pacific Data Center Power Market Volume Billion Forecast, by End User 2020 & 2033
- Table 53: Asia-Pacific Data Center Power Market Revenue Million Forecast, by Geography 2020 & 2033
- Table 54: Asia-Pacific Data Center Power Market Volume Billion Forecast, by Geography 2020 & 2033
- Table 55: Asia-Pacific Data Center Power Market Revenue Million Forecast, by Country 2020 & 2033
- Table 56: Asia-Pacific Data Center Power Market Volume Billion Forecast, by Country 2020 & 2033
- Table 57: Asia-Pacific Data Center Power Market Revenue Million Forecast, by Power Infrastructure 2020 & 2033
- Table 58: Asia-Pacific Data Center Power Market Volume Billion Forecast, by Power Infrastructure 2020 & 2033
- Table 59: Asia-Pacific Data Center Power Market Revenue Million Forecast, by End User 2020 & 2033
- Table 60: Asia-Pacific Data Center Power Market Volume Billion Forecast, by End User 2020 & 2033
- Table 61: Asia-Pacific Data Center Power Market Revenue Million Forecast, by Geography 2020 & 2033
- Table 62: Asia-Pacific Data Center Power Market Volume Billion Forecast, by Geography 2020 & 2033
- Table 63: Asia-Pacific Data Center Power Market Revenue Million Forecast, by Country 2020 & 2033
- Table 64: Asia-Pacific Data Center Power Market Volume Billion Forecast, by Country 2020 & 2033
- Table 65: Asia-Pacific Data Center Power Market Revenue Million Forecast, by Power Infrastructure 2020 & 2033
- Table 66: Asia-Pacific Data Center Power Market Volume Billion Forecast, by Power Infrastructure 2020 & 2033
- Table 67: Asia-Pacific Data Center Power Market Revenue Million Forecast, by End User 2020 & 2033
- Table 68: Asia-Pacific Data Center Power Market Volume Billion Forecast, by End User 2020 & 2033
- Table 69: Asia-Pacific Data Center Power Market Revenue Million Forecast, by Geography 2020 & 2033
- Table 70: Asia-Pacific Data Center Power Market Volume Billion Forecast, by Geography 2020 & 2033
- Table 71: Asia-Pacific Data Center Power Market Revenue Million Forecast, by Country 2020 & 2033
- Table 72: Asia-Pacific Data Center Power Market Volume Billion Forecast, by Country 2020 & 2033
- Table 73: Asia-Pacific Data Center Power Market Revenue Million Forecast, by Power Infrastructure 2020 & 2033
- Table 74: Asia-Pacific Data Center Power Market Volume Billion Forecast, by Power Infrastructure 2020 & 2033
- Table 75: Asia-Pacific Data Center Power Market Revenue Million Forecast, by End User 2020 & 2033
- Table 76: Asia-Pacific Data Center Power Market Volume Billion Forecast, by End User 2020 & 2033
- Table 77: Asia-Pacific Data Center Power Market Revenue Million Forecast, by Geography 2020 & 2033
- Table 78: Asia-Pacific Data Center Power Market Volume Billion Forecast, by Geography 2020 & 2033
- Table 79: Asia-Pacific Data Center Power Market Revenue Million Forecast, by Country 2020 & 2033
- Table 80: Asia-Pacific Data Center Power Market Volume Billion Forecast, by Country 2020 & 2033
- Table 81: Asia-Pacific Data Center Power Market Revenue Million Forecast, by Power Infrastructure 2020 & 2033
- Table 82: Asia-Pacific Data Center Power Market Volume Billion Forecast, by Power Infrastructure 2020 & 2033
- Table 83: Asia-Pacific Data Center Power Market Revenue Million Forecast, by End User 2020 & 2033
- Table 84: Asia-Pacific Data Center Power Market Volume Billion Forecast, by End User 2020 & 2033
- Table 85: Asia-Pacific Data Center Power Market Revenue Million Forecast, by Geography 2020 & 2033
- Table 86: Asia-Pacific Data Center Power Market Volume Billion Forecast, by Geography 2020 & 2033
- Table 87: Asia-Pacific Data Center Power Market Revenue Million Forecast, by Country 2020 & 2033
- Table 88: Asia-Pacific Data Center Power Market Volume Billion Forecast, by Country 2020 & 2033
- Table 89: Asia-Pacific Data Center Power Market Revenue Million Forecast, by Power Infrastructure 2020 & 2033
- Table 90: Asia-Pacific Data Center Power Market Volume Billion Forecast, by Power Infrastructure 2020 & 2033
- Table 91: Asia-Pacific Data Center Power Market Revenue Million Forecast, by End User 2020 & 2033
- Table 92: Asia-Pacific Data Center Power Market Volume Billion Forecast, by End User 2020 & 2033
- Table 93: Asia-Pacific Data Center Power Market Revenue Million Forecast, by Geography 2020 & 2033
- Table 94: Asia-Pacific Data Center Power Market Volume Billion Forecast, by Geography 2020 & 2033
- Table 95: Asia-Pacific Data Center Power Market Revenue Million Forecast, by Country 2020 & 2033
- Table 96: Asia-Pacific Data Center Power Market Volume Billion Forecast, by Country 2020 & 2033
- Table 97: Asia-Pacific Data Center Power Market Revenue Million Forecast, by Power Infrastructure 2020 & 2033
- Table 98: Asia-Pacific Data Center Power Market Volume Billion Forecast, by Power Infrastructure 2020 & 2033
- Table 99: Asia-Pacific Data Center Power Market Revenue Million Forecast, by End User 2020 & 2033
- Table 100: Asia-Pacific Data Center Power Market Volume Billion Forecast, by End User 2020 & 2033
- Table 101: Asia-Pacific Data Center Power Market Revenue Million Forecast, by Geography 2020 & 2033
- Table 102: Asia-Pacific Data Center Power Market Volume Billion Forecast, by Geography 2020 & 2033
- Table 103: Asia-Pacific Data Center Power Market Revenue Million Forecast, by Country 2020 & 2033
- Table 104: Asia-Pacific Data Center Power Market Volume Billion Forecast, by Country 2020 & 2033
- Table 105: Asia-Pacific Data Center Power Market Revenue Million Forecast, by Power Infrastructure 2020 & 2033
- Table 106: Asia-Pacific Data Center Power Market Volume Billion Forecast, by Power Infrastructure 2020 & 2033
- Table 107: Asia-Pacific Data Center Power Market Revenue Million Forecast, by End User 2020 & 2033
- Table 108: Asia-Pacific Data Center Power Market Volume Billion Forecast, by End User 2020 & 2033
- Table 109: Asia-Pacific Data Center Power Market Revenue Million Forecast, by Geography 2020 & 2033
- Table 110: Asia-Pacific Data Center Power Market Volume Billion Forecast, by Geography 2020 & 2033
- Table 111: Asia-Pacific Data Center Power Market Revenue Million Forecast, by Country 2020 & 2033
- Table 112: Asia-Pacific Data Center Power Market Volume Billion Forecast, by Country 2020 & 2033
- Table 113: Asia-Pacific Data Center Power Market Revenue Million Forecast, by Power Infrastructure 2020 & 2033
- Table 114: Asia-Pacific Data Center Power Market Volume Billion Forecast, by Power Infrastructure 2020 & 2033
- Table 115: Asia-Pacific Data Center Power Market Revenue Million Forecast, by End User 2020 & 2033
- Table 116: Asia-Pacific Data Center Power Market Volume Billion Forecast, by End User 2020 & 2033
- Table 117: Asia-Pacific Data Center Power Market Revenue Million Forecast, by Geography 2020 & 2033
- Table 118: Asia-Pacific Data Center Power Market Volume Billion Forecast, by Geography 2020 & 2033
- Table 119: Asia-Pacific Data Center Power Market Revenue Million Forecast, by Country 2020 & 2033
- Table 120: Asia-Pacific Data Center Power Market Volume Billion Forecast, by Country 2020 & 2033
Frequently Asked Questions
1. What is the projected Compound Annual Growth Rate (CAGR) of the Asia-Pacific Data Center Power Market?
The projected CAGR is approximately 9.70%.
2. Which companies are prominent players in the Asia-Pacific Data Center Power Market?
Key companies in the market include ABB Ltd, Caterpillar Inc, Cummins Inc, Eaton Corporation, Legrand Group, Rolls-Royce PLC, Vertiv Group Corp, Schneider Electric SE, Rittal GmbH & Co KG, Fujitsu Limited, Cisco Systems Inc *List Not Exhaustive.
3. What are the main segments of the Asia-Pacific Data Center Power Market?
The market segments include Power Infrastructure, End User, Geography.
4. Can you provide details about the market size?
The market size is estimated to be USD 7.80 Million as of 2022.
5. What are some drivers contributing to market growth?
Rising Adoption of Mega Data Centers and Cloud Computing; Increasing Demand to Reduce Operational Costs.
6. What are the notable trends driving market growth?
IT and Telecom to Hold Significant Share.
7. Are there any restraints impacting market growth?
Rising Adoption of Mega Data Centers and Cloud Computing; Increasing Demand to Reduce Operational Costs.
8. Can you provide examples of recent developments in the market?
June 2023 - Legrand introduced the industry’s next generation of intelligent rack power distribution units (PDUs). The server technology PRO4X and Raritan PX4 rack PDUs are poised to redefine power management in data centers with exceptional visibility, cutting-edge hardware, and enhanced security.
9. What pricing options are available for accessing the report?
Pricing options include single-user, multi-user, and enterprise licenses priced at USD 4750, USD 4950, and USD 6800 respectively.
10. Is the market size provided in terms of value or volume?
The market size is provided in terms of value, measured in Million and volume, measured in Billion.
11. Are there any specific market keywords associated with the report?
Yes, the market keyword associated with the report is "Asia-Pacific Data Center Power Market," which aids in identifying and referencing the specific market segment covered.
12. How do I determine which pricing option suits my needs best?
The pricing options vary based on user requirements and access needs. Individual users may opt for single-user licenses, while businesses requiring broader access may choose multi-user or enterprise licenses for cost-effective access to the report.
13. Are there any additional resources or data provided in the Asia-Pacific Data Center Power Market report?
While the report offers comprehensive insights, it's advisable to review the specific contents or supplementary materials provided to ascertain if additional resources or data are available.
14. How can I stay updated on further developments or reports in the Asia-Pacific Data Center Power Market?
To stay informed about further developments, trends, and reports in the Asia-Pacific Data Center Power Market, consider subscribing to industry newsletters, following relevant companies and organizations, or regularly checking reputable industry news sources and publications.
Methodology
Step 1 - Identification of Relevant Samples Size from Population Database


Step 2 - Approaches for Defining Global Market Size (Value, Volume* & Price*)

Note*: In applicable scenarios
Step 3 - Data Sources
Primary Research
- Web Analytics
- Survey Reports
- Research Institute
- Latest Research Reports
- Opinion Leaders
Secondary Research
- Annual Reports
- White Paper
- Latest Press Release
- Industry Association
- Paid Database
- Investor Presentations

Step 4 - Data Triangulation
Involves using different sources of information in order to increase the validity of a study
These sources are likely to be stakeholders in a program - participants, other researchers, program staff, other community members, and so on.
Then we put all data in single framework & apply various statistical tools to find out the dynamic on the market.
During the analysis stage, feedback from the stakeholder groups would be compared to determine areas of agreement as well as areas of divergence

