
Key Insights
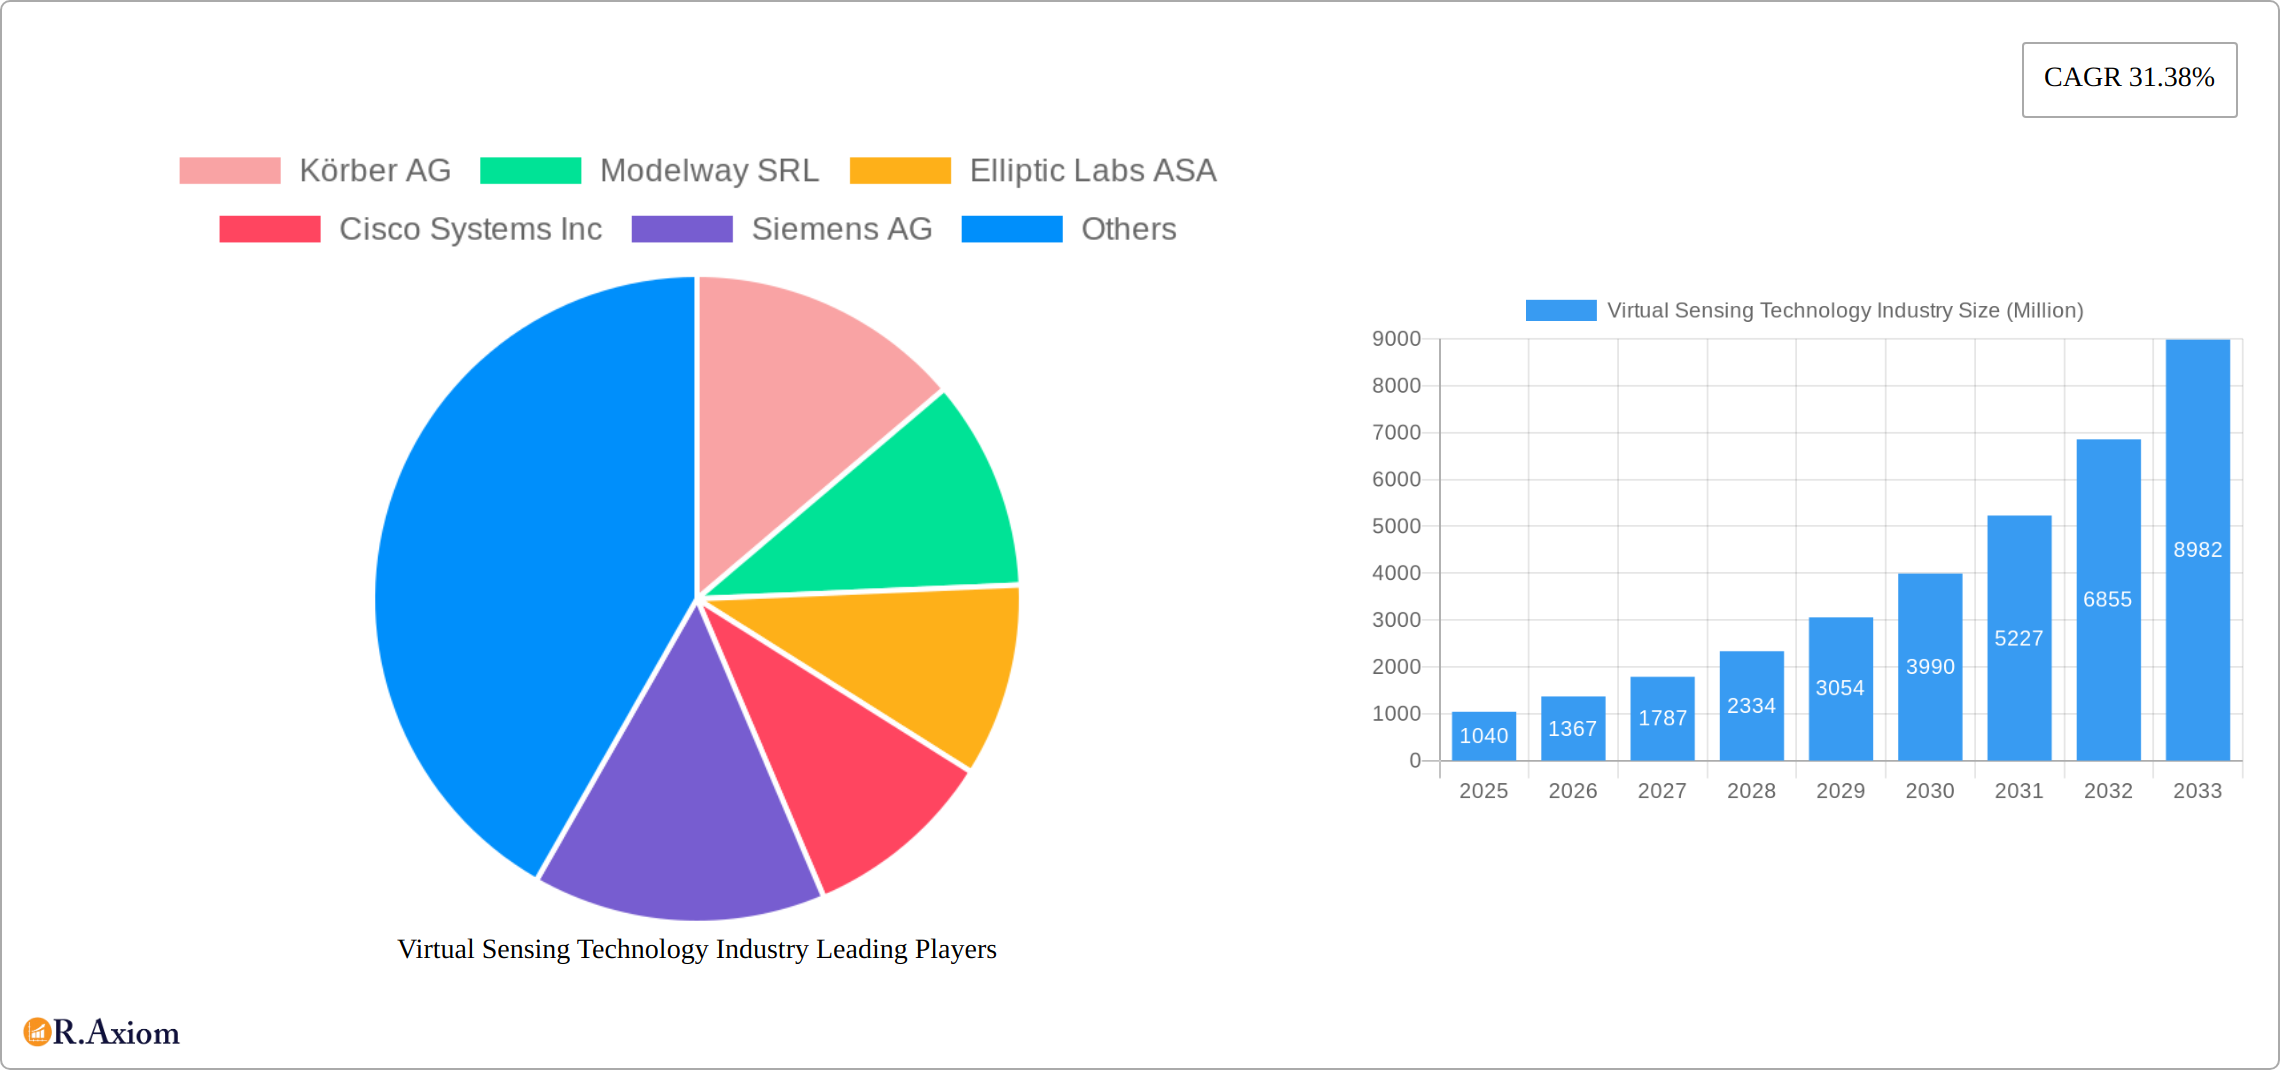
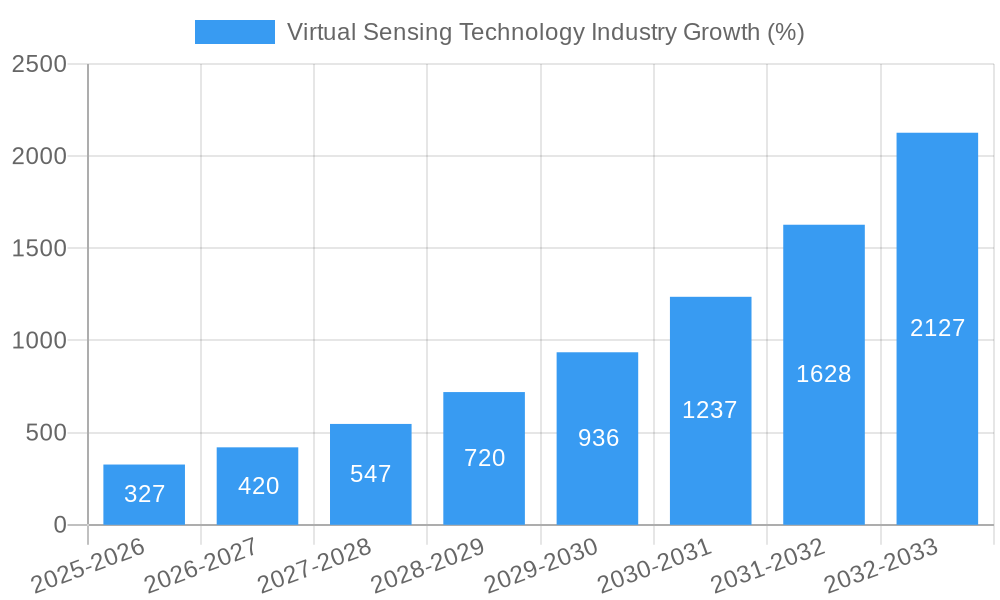
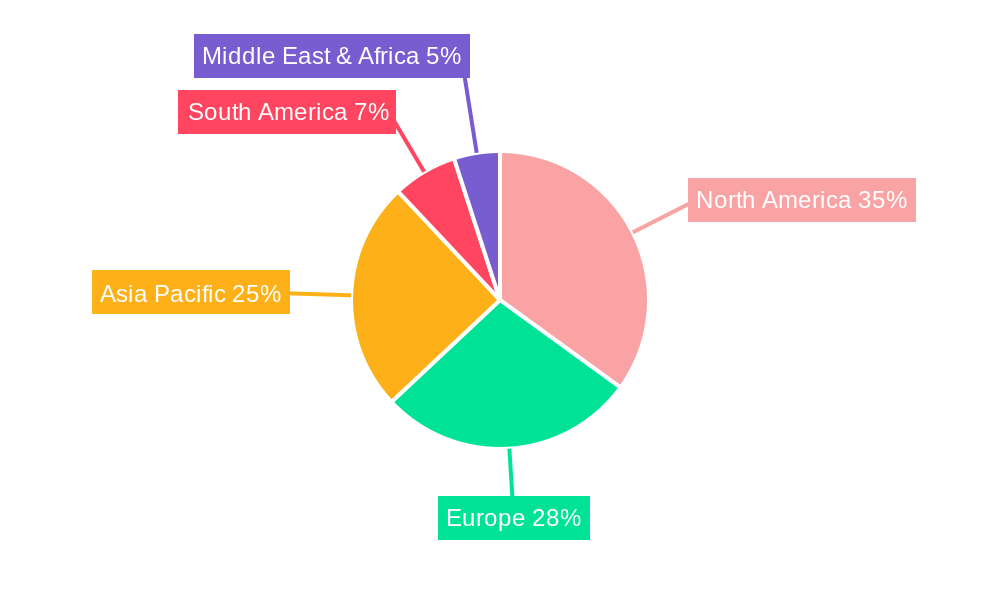
The Virtual Sensing Technology market is experiencing rapid growth, projected to reach $1.04 billion in 2025 and exhibiting a robust Compound Annual Growth Rate (CAGR) of 31.38% from 2025 to 2033. This expansion is fueled by several key drivers. The increasing adoption of IoT devices across various sectors, including healthcare, manufacturing, and smart buildings, is significantly boosting demand. Advancements in sensor technology, particularly in miniaturization and power efficiency, are enabling wider deployment in wearable devices and smaller form factors. Furthermore, the rising need for remote monitoring and predictive maintenance in industrial settings is further propelling market growth. While the market faces challenges such as high initial investment costs and concerns about data security and privacy, the long-term benefits of enhanced efficiency, improved safety, and reduced operational costs outweigh these limitations. The market is segmented by sensor type (wearable, vehicle, building), application (healthcare, manufacturing, smart buildings), and end-use industry (healthcare, manufacturing, transportation). North America and Asia-Pacific are currently leading the market due to significant technological advancements and substantial investments in infrastructure development. However, Europe and other regions are expected to witness substantial growth in the coming years as adoption accelerates. Companies like Körber AG, Elliptic Labs ASA, and Cisco Systems Inc are key players, constantly innovating and competing for market share through strategic partnerships and product development. The projected CAGR suggests substantial market expansion, indicating significant investment potential for companies operating within this dynamic space.
The forecast period of 2025-2033 anticipates continued strong growth. The market’s segmentation strategy reveals considerable opportunity for specialization. For example, the healthcare segment is driven by the increasing demand for remote patient monitoring and the rise of personalized medicine. Similarly, within the manufacturing sector, the implementation of virtual sensing technologies improves operational efficiency and reduces downtime. The transportation industry benefits from enhanced safety features and improved logistics. Technological advancements, such as AI-powered data analytics, will play a critical role in driving future growth by allowing for more insightful data extraction and improved decision-making. Competition is expected to remain intense, with companies focusing on developing cutting-edge sensor technologies and expanding their service offerings to cater to diverse industry needs. The continuous development and integration of virtual sensing technologies into existing infrastructure will play a crucial role in shaping market dynamics.
Virtual Sensing Technology Industry: A Comprehensive Market Report (2019-2033)
This comprehensive report provides an in-depth analysis of the Virtual Sensing Technology industry, covering market size, growth drivers, challenges, and opportunities from 2019 to 2033. The report leverages extensive data and insights to offer actionable intelligence for stakeholders, including manufacturers, investors, and technology providers. The study period spans 2019-2033, with 2025 as the base and estimated year. The forecast period is 2025-2033, and the historical period is 2019-2024. The market is segmented by sensor type (wearable, vehicle, building), application (healthcare, manufacturing, smart buildings), and end-use industry (healthcare, manufacturing, transportation).
Virtual Sensing Technology Industry Market Concentration & Innovation
The virtual sensing technology market exhibits a moderately concentrated landscape, with several major players holding significant market share. The market share of the top 5 players is estimated at xx%, indicating the presence of both established industry giants and emerging innovative companies. Key players like Körber AG, Siemens AG, and Schneider Electric SE leverage their existing infrastructure and expertise in related fields to gain a competitive edge. However, smaller, agile companies are driving innovation through advancements in AI, machine learning, and miniaturization.
Several factors drive innovation:
- Technological advancements: The convergence of AI, IoT, and sensor technologies is continuously enhancing the capabilities and applications of virtual sensing.
- Increasing demand for data-driven insights: Businesses across various sectors are adopting virtual sensing to gain real-time insights into operational processes and improve decision-making.
- Government regulations and initiatives: Regulations promoting energy efficiency and industrial automation are incentivizing the adoption of virtual sensing solutions.
The competitive landscape is further shaped by M&A activities, with deal values exceeding $xx Million in the last five years. These acquisitions often involve established players acquiring smaller innovative companies to expand their product portfolios and technological capabilities. Product substitution remains a minimal threat, with virtual sensors offering unique advantages over traditional methods in terms of cost, efficiency, and data accessibility. End-user trends are pushing the market towards more seamless integration with existing systems and improved user interfaces.
Virtual Sensing Technology Industry Industry Trends & Insights
The virtual sensing technology market is experiencing robust growth, with a projected CAGR of xx% during the forecast period (2025-2033). This growth is fueled by several key factors: the increasing adoption of IoT devices, the proliferation of smart buildings and factories, and the growing demand for remote monitoring and control systems across various industries. Technological advancements, particularly in AI and machine learning, are significantly enhancing the capabilities of virtual sensors, enabling more accurate data analysis and improved decision-making. The market penetration rate for virtual sensing technologies is steadily increasing across key sectors like healthcare, manufacturing, and transportation. Consumer preferences are shifting towards more user-friendly, integrated, and data-secure solutions.
Competitive dynamics are characterized by both intense competition and collaborative partnerships. Established players are investing heavily in R&D to maintain their market leadership, while smaller companies are focusing on niche applications and specialized solutions. The increasing availability of low-cost sensors and cloud computing services is further driving market expansion. However, factors like data security concerns and the need for skilled professionals to manage and interpret complex data sets can pose potential challenges to market growth.
Dominant Markets & Segments in Virtual Sensing Technology Industry
The North American region holds a dominant position in the global virtual sensing technology market, driven by the high adoption rate of smart technologies in various sectors, strong government support for technological innovation, and a large pool of skilled professionals.
Key Drivers for North American Dominance:
- Advanced technological infrastructure.
- High levels of investment in R&D.
- Favorable regulatory environment for technology adoption.
- Strong demand from healthcare and manufacturing sectors.
Within the various segments, the building automation segment shows significant growth potential, driven by the increasing construction of smart buildings and the rising need for efficient energy management systems. The healthcare application segment is another key driver, fueled by the growing demand for remote patient monitoring and diagnostic tools. The manufacturing end-use industry is also experiencing rapid adoption due to the demand for improved operational efficiency and predictive maintenance solutions. Europe and Asia-Pacific are also important regional markets, with growth rates expected to accelerate in the coming years.
Virtual Sensing Technology Industry Product Developments
Recent product innovations focus on enhancing the accuracy, reliability, and affordability of virtual sensing technologies. Miniaturization of sensors, improved data processing algorithms, and the integration of AI and machine learning are key technological trends. The market is witnessing the emergence of sophisticated virtual sensing solutions that integrate seamlessly with existing infrastructure, providing users with real-time insights and advanced analytics. These developments are improving market fit by addressing the need for accurate, reliable, and cost-effective data acquisition and processing in diverse applications.
Report Scope & Segmentation Analysis
This report provides a comprehensive segmentation analysis of the Virtual Sensing Technology market based on sensor type (wearable, vehicle, building), application (healthcare, manufacturing, smart buildings), and end-use industry (healthcare, manufacturing, transportation). Each segment offers unique growth opportunities and presents distinct competitive dynamics. For example, the wearable sensor segment is characterized by high growth potential due to the increasing popularity of smartwatches and fitness trackers. The healthcare application segment is expected to experience significant growth due to the rising demand for remote patient monitoring and telemedicine solutions. The manufacturing end-use industry segment is driven by increased automation and demand for real-time process optimization. Growth projections vary across segments, reflecting the specific dynamics and market trends within each. Market sizes are estimated based on revenue and unit shipments, with competitive landscapes analyzed for each segment.
Key Drivers of Virtual Sensing Technology Industry Growth
Several factors drive the growth of the virtual sensing technology market. Firstly, the increasing demand for automation and data-driven decision-making across various industries pushes the adoption of virtual sensing solutions. Secondly, technological advancements in sensor technology, AI, and IoT are enabling the development of more sophisticated and affordable virtual sensing systems. Thirdly, supportive government regulations and incentives promoting energy efficiency and industrial automation are accelerating market growth. Examples include grants and tax credits for smart building initiatives and regulations requiring advanced safety monitoring systems in manufacturing facilities.
Challenges in the Virtual Sensing Technology Industry Sector
The virtual sensing technology market faces several challenges. Data security and privacy concerns are a significant hurdle, particularly in applications involving sensitive personal or operational data. High initial investment costs for implementing virtual sensing systems and the need for specialized expertise to manage and interpret the data can also hinder adoption. Furthermore, the complex integration of virtual sensing systems with existing infrastructure can present technical challenges and increased implementation costs. These issues, if not effectively addressed, could impact market growth and adoption rate. The overall impact is estimated to be a reduction in market size by approximately xx Million annually.
Emerging Opportunities in Virtual Sensing Technology Industry
Several emerging opportunities exist for the virtual sensing technology market. The expansion of 5G networks is creating new possibilities for real-time data transmission and remote monitoring. The growing demand for personalized healthcare solutions and the adoption of AI-driven diagnostic tools are driving innovation in the healthcare sector. The increasing adoption of Industry 4.0 principles in manufacturing creates substantial demand for virtual sensing solutions for predictive maintenance and process optimization. The development of new materials and energy-efficient sensor technologies are contributing to cost reduction and improving market penetration.
Leading Players in the Virtual Sensing Technology Industry Market
- Körber AG
- Modelway SRL
- Elliptic Labs ASA
- Cisco Systems Inc
- Siemens AG
- Schneider Electric SE
- Andata Lt
- Intelli Dynamics (Biocomp Systems Inc)
- General Electric Company
Key Developments in Virtual Sensing Technology Industry
March 2024: Elliptic Labs announced the deployment of over 500 Million devices and the shipping of its AI Virtual Proximity Sensor INNER BEAUTY on the Lava Blaze Curve smartphone. This significant milestone demonstrates the growing market adoption of virtual sensing technologies in consumer electronics.
February 2024: Capgemini and Unity's expanded strategic alliance will accelerate the development and deployment of real-time 3D visualization software for industrial digital twin applications. This collaboration signifies the increasing importance of virtual sensing in industrial digitalization efforts.
Strategic Outlook for Virtual Sensing Technology Industry Market
The virtual sensing technology market holds immense growth potential, driven by technological advancements, increasing demand for automation, and supportive government initiatives. The convergence of AI, IoT, and sensor technologies will create new opportunities for innovative applications and services. Companies that can effectively address data security concerns, offer user-friendly solutions, and build strong partnerships will be well-positioned to capitalize on this market growth. The future success of companies in this field will hinge on their ability to innovate, adapt to evolving market demands, and deliver reliable, secure, and cost-effective solutions.
Virtual Sensing Technology Industry Segmentation
-
1. Deployment Type
- 1.1. Cloud
- 1.2. On-premise
-
2. End-user Industry
- 2.1. Oil and Gas
- 2.2. Manufacturing
- 2.3. Transportation and Automotive
- 2.4. Metal and Mining
- 2.5. Aerospace and Defense
- 2.6. Electronics and Consumer Technologies
- 2.7. Other End User Industries
- 3. Market Segmentation and Target Audience
- 4. Value Proposition
- 5. Distribution Channel Strategies
- 6. Competitive Landscape
- 7. Addressing Market Challenges
- 8. Conclusion and Recommendations
Virtual Sensing Technology Industry Segmentation By Geography
-
1. North America
- 1.1. United States
- 1.2. Canada
-
2. Europe
- 2.1. United Kingdom
- 2.2. Germany
- 2.3. France
- 2.4. Italy
-
3. Asia
- 3.1. China
- 3.2. Japan
- 3.3. India
- 4. Australia and New Zealand
- 5. Latin America
- 6. Middle East and Africa
Virtual Sensing Technology Industry REPORT HIGHLIGHTS
| Aspects | Details |
|---|---|
| Study Period | 2019-2033 |
| Base Year | 2024 |
| Estimated Year | 2025 |
| Forecast Period | 2025-2033 |
| Historical Period | 2019-2024 |
| Growth Rate | CAGR of 31.38% from 2019-2033 |
| Segmentation |
|
Table of Contents
- 1. Introduction
- 1.1. Research Scope
- 1.2. Market Segmentation
- 1.3. Research Methodology
- 1.4. Definitions and Assumptions
- 2. Executive Summary
- 2.1. Introduction
- 3. Market Dynamics
- 3.1. Introduction
- 3.2. Market Drivers
- 3.2.1. Increasing Adoption of IoT and Cloud Platform Is Expected to Drive the Market; Growing Need For Enhanced Cost-effectiveness and Operational Efficiency in Manufacturing
- 3.3. Market Restrains
- 3.3.1. High Deployment and Maintenance Cost
- 3.4. Market Trends
- 3.4.1. Transportation and Automotive Industry to be the Fastest Growing End User
- 4. Market Factor Analysis
- 4.1. Porters Five Forces
- 4.2. Supply/Value Chain
- 4.3. PESTEL analysis
- 4.4. Market Entropy
- 4.5. Patent/Trademark Analysis
- 5. Global Virtual Sensing Technology Industry Analysis, Insights and Forecast, 2019-2031
- 5.1. Market Analysis, Insights and Forecast - by Deployment Type
- 5.1.1. Cloud
- 5.1.2. On-premise
- 5.2. Market Analysis, Insights and Forecast - by End-user Industry
- 5.2.1. Oil and Gas
- 5.2.2. Manufacturing
- 5.2.3. Transportation and Automotive
- 5.2.4. Metal and Mining
- 5.2.5. Aerospace and Defense
- 5.2.6. Electronics and Consumer Technologies
- 5.2.7. Other End User Industries
- 5.3. Market Analysis, Insights and Forecast - by Market Segmentation and Target Audience
- 5.4. Market Analysis, Insights and Forecast - by Value Proposition
- 5.5. Market Analysis, Insights and Forecast - by Distribution Channel Strategies
- 5.6. Market Analysis, Insights and Forecast - by Competitive Landscape
- 5.7. Market Analysis, Insights and Forecast - by Addressing Market Challenges
- 5.8. Market Analysis, Insights and Forecast - by Conclusion and Recommendations
- 5.9. Market Analysis, Insights and Forecast - by Region
- 5.9.1. North America
- 5.9.2. Europe
- 5.9.3. Asia
- 5.9.4. Australia and New Zealand
- 5.9.5. Latin America
- 5.9.6. Middle East and Africa
- 5.1. Market Analysis, Insights and Forecast - by Deployment Type
- 6. North America Virtual Sensing Technology Industry Analysis, Insights and Forecast, 2019-2031
- 6.1. Market Analysis, Insights and Forecast - by Deployment Type
- 6.1.1. Cloud
- 6.1.2. On-premise
- 6.2. Market Analysis, Insights and Forecast - by End-user Industry
- 6.2.1. Oil and Gas
- 6.2.2. Manufacturing
- 6.2.3. Transportation and Automotive
- 6.2.4. Metal and Mining
- 6.2.5. Aerospace and Defense
- 6.2.6. Electronics and Consumer Technologies
- 6.2.7. Other End User Industries
- 6.3. Market Analysis, Insights and Forecast - by Market Segmentation and Target Audience
- 6.4. Market Analysis, Insights and Forecast - by Value Proposition
- 6.5. Market Analysis, Insights and Forecast - by Distribution Channel Strategies
- 6.6. Market Analysis, Insights and Forecast - by Competitive Landscape
- 6.7. Market Analysis, Insights and Forecast - by Addressing Market Challenges
- 6.8. Market Analysis, Insights and Forecast - by Conclusion and Recommendations
- 6.1. Market Analysis, Insights and Forecast - by Deployment Type
- 7. Europe Virtual Sensing Technology Industry Analysis, Insights and Forecast, 2019-2031
- 7.1. Market Analysis, Insights and Forecast - by Deployment Type
- 7.1.1. Cloud
- 7.1.2. On-premise
- 7.2. Market Analysis, Insights and Forecast - by End-user Industry
- 7.2.1. Oil and Gas
- 7.2.2. Manufacturing
- 7.2.3. Transportation and Automotive
- 7.2.4. Metal and Mining
- 7.2.5. Aerospace and Defense
- 7.2.6. Electronics and Consumer Technologies
- 7.2.7. Other End User Industries
- 7.3. Market Analysis, Insights and Forecast - by Market Segmentation and Target Audience
- 7.4. Market Analysis, Insights and Forecast - by Value Proposition
- 7.5. Market Analysis, Insights and Forecast - by Distribution Channel Strategies
- 7.6. Market Analysis, Insights and Forecast - by Competitive Landscape
- 7.7. Market Analysis, Insights and Forecast - by Addressing Market Challenges
- 7.8. Market Analysis, Insights and Forecast - by Conclusion and Recommendations
- 7.1. Market Analysis, Insights and Forecast - by Deployment Type
- 8. Asia Virtual Sensing Technology Industry Analysis, Insights and Forecast, 2019-2031
- 8.1. Market Analysis, Insights and Forecast - by Deployment Type
- 8.1.1. Cloud
- 8.1.2. On-premise
- 8.2. Market Analysis, Insights and Forecast - by End-user Industry
- 8.2.1. Oil and Gas
- 8.2.2. Manufacturing
- 8.2.3. Transportation and Automotive
- 8.2.4. Metal and Mining
- 8.2.5. Aerospace and Defense
- 8.2.6. Electronics and Consumer Technologies
- 8.2.7. Other End User Industries
- 8.3. Market Analysis, Insights and Forecast - by Market Segmentation and Target Audience
- 8.4. Market Analysis, Insights and Forecast - by Value Proposition
- 8.5. Market Analysis, Insights and Forecast - by Distribution Channel Strategies
- 8.6. Market Analysis, Insights and Forecast - by Competitive Landscape
- 8.7. Market Analysis, Insights and Forecast - by Addressing Market Challenges
- 8.8. Market Analysis, Insights and Forecast - by Conclusion and Recommendations
- 8.1. Market Analysis, Insights and Forecast - by Deployment Type
- 9. Australia and New Zealand Virtual Sensing Technology Industry Analysis, Insights and Forecast, 2019-2031
- 9.1. Market Analysis, Insights and Forecast - by Deployment Type
- 9.1.1. Cloud
- 9.1.2. On-premise
- 9.2. Market Analysis, Insights and Forecast - by End-user Industry
- 9.2.1. Oil and Gas
- 9.2.2. Manufacturing
- 9.2.3. Transportation and Automotive
- 9.2.4. Metal and Mining
- 9.2.5. Aerospace and Defense
- 9.2.6. Electronics and Consumer Technologies
- 9.2.7. Other End User Industries
- 9.3. Market Analysis, Insights and Forecast - by Market Segmentation and Target Audience
- 9.4. Market Analysis, Insights and Forecast - by Value Proposition
- 9.5. Market Analysis, Insights and Forecast - by Distribution Channel Strategies
- 9.6. Market Analysis, Insights and Forecast - by Competitive Landscape
- 9.7. Market Analysis, Insights and Forecast - by Addressing Market Challenges
- 9.8. Market Analysis, Insights and Forecast - by Conclusion and Recommendations
- 9.1. Market Analysis, Insights and Forecast - by Deployment Type
- 10. Latin America Virtual Sensing Technology Industry Analysis, Insights and Forecast, 2019-2031
- 10.1. Market Analysis, Insights and Forecast - by Deployment Type
- 10.1.1. Cloud
- 10.1.2. On-premise
- 10.2. Market Analysis, Insights and Forecast - by End-user Industry
- 10.2.1. Oil and Gas
- 10.2.2. Manufacturing
- 10.2.3. Transportation and Automotive
- 10.2.4. Metal and Mining
- 10.2.5. Aerospace and Defense
- 10.2.6. Electronics and Consumer Technologies
- 10.2.7. Other End User Industries
- 10.3. Market Analysis, Insights and Forecast - by Market Segmentation and Target Audience
- 10.4. Market Analysis, Insights and Forecast - by Value Proposition
- 10.5. Market Analysis, Insights and Forecast - by Distribution Channel Strategies
- 10.6. Market Analysis, Insights and Forecast - by Competitive Landscape
- 10.7. Market Analysis, Insights and Forecast - by Addressing Market Challenges
- 10.8. Market Analysis, Insights and Forecast - by Conclusion and Recommendations
- 10.1. Market Analysis, Insights and Forecast - by Deployment Type
- 11. Middle East and Africa Virtual Sensing Technology Industry Analysis, Insights and Forecast, 2019-2031
- 11.1. Market Analysis, Insights and Forecast - by Deployment Type
- 11.1.1. Cloud
- 11.1.2. On-premise
- 11.2. Market Analysis, Insights and Forecast - by End-user Industry
- 11.2.1. Oil and Gas
- 11.2.2. Manufacturing
- 11.2.3. Transportation and Automotive
- 11.2.4. Metal and Mining
- 11.2.5. Aerospace and Defense
- 11.2.6. Electronics and Consumer Technologies
- 11.2.7. Other End User Industries
- 11.3. Market Analysis, Insights and Forecast - by Market Segmentation and Target Audience
- 11.4. Market Analysis, Insights and Forecast - by Value Proposition
- 11.5. Market Analysis, Insights and Forecast - by Distribution Channel Strategies
- 11.6. Market Analysis, Insights and Forecast - by Competitive Landscape
- 11.7. Market Analysis, Insights and Forecast - by Addressing Market Challenges
- 11.8. Market Analysis, Insights and Forecast - by Conclusion and Recommendations
- 11.1. Market Analysis, Insights and Forecast - by Deployment Type
- 12. North America Virtual Sensing Technology Industry Analysis, Insights and Forecast, 2019-2031
- 12.1. Market Analysis, Insights and Forecast - By Country/Sub-region
- 12.1.1 United States
- 12.1.2 Canada
- 13. Asia Pacific Virtual Sensing Technology Industry Analysis, Insights and Forecast, 2019-2031
- 13.1. Market Analysis, Insights and Forecast - By Country/Sub-region
- 13.1.1 China
- 13.1.2 Japan
- 13.1.3 India
- 13.1.4 South Korea
- 13.1.5 Taiwan
- 13.1.6 Australia
- 13.1.7 Rest of Asia-Pacific
- 14. Europe Virtual Sensing Technology Industry Analysis, Insights and Forecast, 2019-2031
- 14.1. Market Analysis, Insights and Forecast - By Country/Sub-region
- 14.1.1 Germany
- 14.1.2 France
- 14.1.3 Italy
- 14.1.4 United Kingdom
- 14.1.5 Netherlands
- 14.1.6 Sweden
- 14.1.7 Rest of Europe
- 15. South America Virtual Sensing Technology Industry Analysis, Insights and Forecast, 2019-2031
- 15.1. Market Analysis, Insights and Forecast - By Country/Sub-region
- 15.1.1 Brazil
- 15.1.2 Argentina
- 15.1.3 Rest of South America
- 16. Middle East & Africa Virtual Sensing Technology Industry Analysis, Insights and Forecast, 2019-2031
- 16.1. Market Analysis, Insights and Forecast - By Country/Sub-region
- 16.1.1 UAE
- 16.1.2 South Africa
- 16.1.3 Saudi Arabia
- 16.1.4 Rest of MEA
- 17. Competitive Analysis
- 17.1. Global Market Share Analysis 2024
- 17.2. Company Profiles
- 17.2.1 Körber AG
- 17.2.1.1. Overview
- 17.2.1.2. Products
- 17.2.1.3. SWOT Analysis
- 17.2.1.4. Recent Developments
- 17.2.1.5. Financials (Based on Availability)
- 17.2.2 Modelway SRL
- 17.2.2.1. Overview
- 17.2.2.2. Products
- 17.2.2.3. SWOT Analysis
- 17.2.2.4. Recent Developments
- 17.2.2.5. Financials (Based on Availability)
- 17.2.3 Elliptic Labs ASA
- 17.2.3.1. Overview
- 17.2.3.2. Products
- 17.2.3.3. SWOT Analysis
- 17.2.3.4. Recent Developments
- 17.2.3.5. Financials (Based on Availability)
- 17.2.4 Cisco Systems Inc
- 17.2.4.1. Overview
- 17.2.4.2. Products
- 17.2.4.3. SWOT Analysis
- 17.2.4.4. Recent Developments
- 17.2.4.5. Financials (Based on Availability)
- 17.2.5 Siemens AG
- 17.2.5.1. Overview
- 17.2.5.2. Products
- 17.2.5.3. SWOT Analysis
- 17.2.5.4. Recent Developments
- 17.2.5.5. Financials (Based on Availability)
- 17.2.6 Schneider Electric SE
- 17.2.6.1. Overview
- 17.2.6.2. Products
- 17.2.6.3. SWOT Analysis
- 17.2.6.4. Recent Developments
- 17.2.6.5. Financials (Based on Availability)
- 17.2.7 Andata Lt
- 17.2.7.1. Overview
- 17.2.7.2. Products
- 17.2.7.3. SWOT Analysis
- 17.2.7.4. Recent Developments
- 17.2.7.5. Financials (Based on Availability)
- 17.2.8 Intelli Dynamics (Biocomp Systems Inc )
- 17.2.8.1. Overview
- 17.2.8.2. Products
- 17.2.8.3. SWOT Analysis
- 17.2.8.4. Recent Developments
- 17.2.8.5. Financials (Based on Availability)
- 17.2.9 General Electric Company
- 17.2.9.1. Overview
- 17.2.9.2. Products
- 17.2.9.3. SWOT Analysis
- 17.2.9.4. Recent Developments
- 17.2.9.5. Financials (Based on Availability)
- 17.2.1 Körber AG
List of Figures
- Figure 1: Global Virtual Sensing Technology Industry Revenue Breakdown (Million, %) by Region 2024 & 2032
- Figure 2: North America Virtual Sensing Technology Industry Revenue (Million), by Country 2024 & 2032
- Figure 3: North America Virtual Sensing Technology Industry Revenue Share (%), by Country 2024 & 2032
- Figure 4: Asia Pacific Virtual Sensing Technology Industry Revenue (Million), by Country 2024 & 2032
- Figure 5: Asia Pacific Virtual Sensing Technology Industry Revenue Share (%), by Country 2024 & 2032
- Figure 6: Europe Virtual Sensing Technology Industry Revenue (Million), by Country 2024 & 2032
- Figure 7: Europe Virtual Sensing Technology Industry Revenue Share (%), by Country 2024 & 2032
- Figure 8: South America Virtual Sensing Technology Industry Revenue (Million), by Country 2024 & 2032
- Figure 9: South America Virtual Sensing Technology Industry Revenue Share (%), by Country 2024 & 2032
- Figure 10: Middle East & Africa Virtual Sensing Technology Industry Revenue (Million), by Country 2024 & 2032
- Figure 11: Middle East & Africa Virtual Sensing Technology Industry Revenue Share (%), by Country 2024 & 2032
- Figure 12: North America Virtual Sensing Technology Industry Revenue (Million), by Deployment Type 2024 & 2032
- Figure 13: North America Virtual Sensing Technology Industry Revenue Share (%), by Deployment Type 2024 & 2032
- Figure 14: North America Virtual Sensing Technology Industry Revenue (Million), by End-user Industry 2024 & 2032
- Figure 15: North America Virtual Sensing Technology Industry Revenue Share (%), by End-user Industry 2024 & 2032
- Figure 16: North America Virtual Sensing Technology Industry Revenue (Million), by Market Segmentation and Target Audience 2024 & 2032
- Figure 17: North America Virtual Sensing Technology Industry Revenue Share (%), by Market Segmentation and Target Audience 2024 & 2032
- Figure 18: North America Virtual Sensing Technology Industry Revenue (Million), by Value Proposition 2024 & 2032
- Figure 19: North America Virtual Sensing Technology Industry Revenue Share (%), by Value Proposition 2024 & 2032
- Figure 20: North America Virtual Sensing Technology Industry Revenue (Million), by Distribution Channel Strategies 2024 & 2032
- Figure 21: North America Virtual Sensing Technology Industry Revenue Share (%), by Distribution Channel Strategies 2024 & 2032
- Figure 22: North America Virtual Sensing Technology Industry Revenue (Million), by Competitive Landscape 2024 & 2032
- Figure 23: North America Virtual Sensing Technology Industry Revenue Share (%), by Competitive Landscape 2024 & 2032
- Figure 24: North America Virtual Sensing Technology Industry Revenue (Million), by Addressing Market Challenges 2024 & 2032
- Figure 25: North America Virtual Sensing Technology Industry Revenue Share (%), by Addressing Market Challenges 2024 & 2032
- Figure 26: North America Virtual Sensing Technology Industry Revenue (Million), by Conclusion and Recommendations 2024 & 2032
- Figure 27: North America Virtual Sensing Technology Industry Revenue Share (%), by Conclusion and Recommendations 2024 & 2032
- Figure 28: North America Virtual Sensing Technology Industry Revenue (Million), by Country 2024 & 2032
- Figure 29: North America Virtual Sensing Technology Industry Revenue Share (%), by Country 2024 & 2032
- Figure 30: Europe Virtual Sensing Technology Industry Revenue (Million), by Deployment Type 2024 & 2032
- Figure 31: Europe Virtual Sensing Technology Industry Revenue Share (%), by Deployment Type 2024 & 2032
- Figure 32: Europe Virtual Sensing Technology Industry Revenue (Million), by End-user Industry 2024 & 2032
- Figure 33: Europe Virtual Sensing Technology Industry Revenue Share (%), by End-user Industry 2024 & 2032
- Figure 34: Europe Virtual Sensing Technology Industry Revenue (Million), by Market Segmentation and Target Audience 2024 & 2032
- Figure 35: Europe Virtual Sensing Technology Industry Revenue Share (%), by Market Segmentation and Target Audience 2024 & 2032
- Figure 36: Europe Virtual Sensing Technology Industry Revenue (Million), by Value Proposition 2024 & 2032
- Figure 37: Europe Virtual Sensing Technology Industry Revenue Share (%), by Value Proposition 2024 & 2032
- Figure 38: Europe Virtual Sensing Technology Industry Revenue (Million), by Distribution Channel Strategies 2024 & 2032
- Figure 39: Europe Virtual Sensing Technology Industry Revenue Share (%), by Distribution Channel Strategies 2024 & 2032
- Figure 40: Europe Virtual Sensing Technology Industry Revenue (Million), by Competitive Landscape 2024 & 2032
- Figure 41: Europe Virtual Sensing Technology Industry Revenue Share (%), by Competitive Landscape 2024 & 2032
- Figure 42: Europe Virtual Sensing Technology Industry Revenue (Million), by Addressing Market Challenges 2024 & 2032
- Figure 43: Europe Virtual Sensing Technology Industry Revenue Share (%), by Addressing Market Challenges 2024 & 2032
- Figure 44: Europe Virtual Sensing Technology Industry Revenue (Million), by Conclusion and Recommendations 2024 & 2032
- Figure 45: Europe Virtual Sensing Technology Industry Revenue Share (%), by Conclusion and Recommendations 2024 & 2032
- Figure 46: Europe Virtual Sensing Technology Industry Revenue (Million), by Country 2024 & 2032
- Figure 47: Europe Virtual Sensing Technology Industry Revenue Share (%), by Country 2024 & 2032
- Figure 48: Asia Virtual Sensing Technology Industry Revenue (Million), by Deployment Type 2024 & 2032
- Figure 49: Asia Virtual Sensing Technology Industry Revenue Share (%), by Deployment Type 2024 & 2032
- Figure 50: Asia Virtual Sensing Technology Industry Revenue (Million), by End-user Industry 2024 & 2032
- Figure 51: Asia Virtual Sensing Technology Industry Revenue Share (%), by End-user Industry 2024 & 2032
- Figure 52: Asia Virtual Sensing Technology Industry Revenue (Million), by Market Segmentation and Target Audience 2024 & 2032
- Figure 53: Asia Virtual Sensing Technology Industry Revenue Share (%), by Market Segmentation and Target Audience 2024 & 2032
- Figure 54: Asia Virtual Sensing Technology Industry Revenue (Million), by Value Proposition 2024 & 2032
- Figure 55: Asia Virtual Sensing Technology Industry Revenue Share (%), by Value Proposition 2024 & 2032
- Figure 56: Asia Virtual Sensing Technology Industry Revenue (Million), by Distribution Channel Strategies 2024 & 2032
- Figure 57: Asia Virtual Sensing Technology Industry Revenue Share (%), by Distribution Channel Strategies 2024 & 2032
- Figure 58: Asia Virtual Sensing Technology Industry Revenue (Million), by Competitive Landscape 2024 & 2032
- Figure 59: Asia Virtual Sensing Technology Industry Revenue Share (%), by Competitive Landscape 2024 & 2032
- Figure 60: Asia Virtual Sensing Technology Industry Revenue (Million), by Addressing Market Challenges 2024 & 2032
- Figure 61: Asia Virtual Sensing Technology Industry Revenue Share (%), by Addressing Market Challenges 2024 & 2032
- Figure 62: Asia Virtual Sensing Technology Industry Revenue (Million), by Conclusion and Recommendations 2024 & 2032
- Figure 63: Asia Virtual Sensing Technology Industry Revenue Share (%), by Conclusion and Recommendations 2024 & 2032
- Figure 64: Asia Virtual Sensing Technology Industry Revenue (Million), by Country 2024 & 2032
- Figure 65: Asia Virtual Sensing Technology Industry Revenue Share (%), by Country 2024 & 2032
- Figure 66: Australia and New Zealand Virtual Sensing Technology Industry Revenue (Million), by Deployment Type 2024 & 2032
- Figure 67: Australia and New Zealand Virtual Sensing Technology Industry Revenue Share (%), by Deployment Type 2024 & 2032
- Figure 68: Australia and New Zealand Virtual Sensing Technology Industry Revenue (Million), by End-user Industry 2024 & 2032
- Figure 69: Australia and New Zealand Virtual Sensing Technology Industry Revenue Share (%), by End-user Industry 2024 & 2032
- Figure 70: Australia and New Zealand Virtual Sensing Technology Industry Revenue (Million), by Market Segmentation and Target Audience 2024 & 2032
- Figure 71: Australia and New Zealand Virtual Sensing Technology Industry Revenue Share (%), by Market Segmentation and Target Audience 2024 & 2032
- Figure 72: Australia and New Zealand Virtual Sensing Technology Industry Revenue (Million), by Value Proposition 2024 & 2032
- Figure 73: Australia and New Zealand Virtual Sensing Technology Industry Revenue Share (%), by Value Proposition 2024 & 2032
- Figure 74: Australia and New Zealand Virtual Sensing Technology Industry Revenue (Million), by Distribution Channel Strategies 2024 & 2032
- Figure 75: Australia and New Zealand Virtual Sensing Technology Industry Revenue Share (%), by Distribution Channel Strategies 2024 & 2032
- Figure 76: Australia and New Zealand Virtual Sensing Technology Industry Revenue (Million), by Competitive Landscape 2024 & 2032
- Figure 77: Australia and New Zealand Virtual Sensing Technology Industry Revenue Share (%), by Competitive Landscape 2024 & 2032
- Figure 78: Australia and New Zealand Virtual Sensing Technology Industry Revenue (Million), by Addressing Market Challenges 2024 & 2032
- Figure 79: Australia and New Zealand Virtual Sensing Technology Industry Revenue Share (%), by Addressing Market Challenges 2024 & 2032
- Figure 80: Australia and New Zealand Virtual Sensing Technology Industry Revenue (Million), by Conclusion and Recommendations 2024 & 2032
- Figure 81: Australia and New Zealand Virtual Sensing Technology Industry Revenue Share (%), by Conclusion and Recommendations 2024 & 2032
- Figure 82: Australia and New Zealand Virtual Sensing Technology Industry Revenue (Million), by Country 2024 & 2032
- Figure 83: Australia and New Zealand Virtual Sensing Technology Industry Revenue Share (%), by Country 2024 & 2032
- Figure 84: Latin America Virtual Sensing Technology Industry Revenue (Million), by Deployment Type 2024 & 2032
- Figure 85: Latin America Virtual Sensing Technology Industry Revenue Share (%), by Deployment Type 2024 & 2032
- Figure 86: Latin America Virtual Sensing Technology Industry Revenue (Million), by End-user Industry 2024 & 2032
- Figure 87: Latin America Virtual Sensing Technology Industry Revenue Share (%), by End-user Industry 2024 & 2032
- Figure 88: Latin America Virtual Sensing Technology Industry Revenue (Million), by Market Segmentation and Target Audience 2024 & 2032
- Figure 89: Latin America Virtual Sensing Technology Industry Revenue Share (%), by Market Segmentation and Target Audience 2024 & 2032
- Figure 90: Latin America Virtual Sensing Technology Industry Revenue (Million), by Value Proposition 2024 & 2032
- Figure 91: Latin America Virtual Sensing Technology Industry Revenue Share (%), by Value Proposition 2024 & 2032
- Figure 92: Latin America Virtual Sensing Technology Industry Revenue (Million), by Distribution Channel Strategies 2024 & 2032
- Figure 93: Latin America Virtual Sensing Technology Industry Revenue Share (%), by Distribution Channel Strategies 2024 & 2032
- Figure 94: Latin America Virtual Sensing Technology Industry Revenue (Million), by Competitive Landscape 2024 & 2032
- Figure 95: Latin America Virtual Sensing Technology Industry Revenue Share (%), by Competitive Landscape 2024 & 2032
- Figure 96: Latin America Virtual Sensing Technology Industry Revenue (Million), by Addressing Market Challenges 2024 & 2032
- Figure 97: Latin America Virtual Sensing Technology Industry Revenue Share (%), by Addressing Market Challenges 2024 & 2032
- Figure 98: Latin America Virtual Sensing Technology Industry Revenue (Million), by Conclusion and Recommendations 2024 & 2032
- Figure 99: Latin America Virtual Sensing Technology Industry Revenue Share (%), by Conclusion and Recommendations 2024 & 2032
- Figure 100: Latin America Virtual Sensing Technology Industry Revenue (Million), by Country 2024 & 2032
- Figure 101: Latin America Virtual Sensing Technology Industry Revenue Share (%), by Country 2024 & 2032
- Figure 102: Middle East and Africa Virtual Sensing Technology Industry Revenue (Million), by Deployment Type 2024 & 2032
- Figure 103: Middle East and Africa Virtual Sensing Technology Industry Revenue Share (%), by Deployment Type 2024 & 2032
- Figure 104: Middle East and Africa Virtual Sensing Technology Industry Revenue (Million), by End-user Industry 2024 & 2032
- Figure 105: Middle East and Africa Virtual Sensing Technology Industry Revenue Share (%), by End-user Industry 2024 & 2032
- Figure 106: Middle East and Africa Virtual Sensing Technology Industry Revenue (Million), by Market Segmentation and Target Audience 2024 & 2032
- Figure 107: Middle East and Africa Virtual Sensing Technology Industry Revenue Share (%), by Market Segmentation and Target Audience 2024 & 2032
- Figure 108: Middle East and Africa Virtual Sensing Technology Industry Revenue (Million), by Value Proposition 2024 & 2032
- Figure 109: Middle East and Africa Virtual Sensing Technology Industry Revenue Share (%), by Value Proposition 2024 & 2032
- Figure 110: Middle East and Africa Virtual Sensing Technology Industry Revenue (Million), by Distribution Channel Strategies 2024 & 2032
- Figure 111: Middle East and Africa Virtual Sensing Technology Industry Revenue Share (%), by Distribution Channel Strategies 2024 & 2032
- Figure 112: Middle East and Africa Virtual Sensing Technology Industry Revenue (Million), by Competitive Landscape 2024 & 2032
- Figure 113: Middle East and Africa Virtual Sensing Technology Industry Revenue Share (%), by Competitive Landscape 2024 & 2032
- Figure 114: Middle East and Africa Virtual Sensing Technology Industry Revenue (Million), by Addressing Market Challenges 2024 & 2032
- Figure 115: Middle East and Africa Virtual Sensing Technology Industry Revenue Share (%), by Addressing Market Challenges 2024 & 2032
- Figure 116: Middle East and Africa Virtual Sensing Technology Industry Revenue (Million), by Conclusion and Recommendations 2024 & 2032
- Figure 117: Middle East and Africa Virtual Sensing Technology Industry Revenue Share (%), by Conclusion and Recommendations 2024 & 2032
- Figure 118: Middle East and Africa Virtual Sensing Technology Industry Revenue (Million), by Country 2024 & 2032
- Figure 119: Middle East and Africa Virtual Sensing Technology Industry Revenue Share (%), by Country 2024 & 2032
List of Tables
- Table 1: Global Virtual Sensing Technology Industry Revenue Million Forecast, by Region 2019 & 2032
- Table 2: Global Virtual Sensing Technology Industry Revenue Million Forecast, by Deployment Type 2019 & 2032
- Table 3: Global Virtual Sensing Technology Industry Revenue Million Forecast, by End-user Industry 2019 & 2032
- Table 4: Global Virtual Sensing Technology Industry Revenue Million Forecast, by Market Segmentation and Target Audience 2019 & 2032
- Table 5: Global Virtual Sensing Technology Industry Revenue Million Forecast, by Value Proposition 2019 & 2032
- Table 6: Global Virtual Sensing Technology Industry Revenue Million Forecast, by Distribution Channel Strategies 2019 & 2032
- Table 7: Global Virtual Sensing Technology Industry Revenue Million Forecast, by Competitive Landscape 2019 & 2032
- Table 8: Global Virtual Sensing Technology Industry Revenue Million Forecast, by Addressing Market Challenges 2019 & 2032
- Table 9: Global Virtual Sensing Technology Industry Revenue Million Forecast, by Conclusion and Recommendations 2019 & 2032
- Table 10: Global Virtual Sensing Technology Industry Revenue Million Forecast, by Region 2019 & 2032
- Table 11: Global Virtual Sensing Technology Industry Revenue Million Forecast, by Country 2019 & 2032
- Table 12: United States Virtual Sensing Technology Industry Revenue (Million) Forecast, by Application 2019 & 2032
- Table 13: Canada Virtual Sensing Technology Industry Revenue (Million) Forecast, by Application 2019 & 2032
- Table 14: Global Virtual Sensing Technology Industry Revenue Million Forecast, by Country 2019 & 2032
- Table 15: China Virtual Sensing Technology Industry Revenue (Million) Forecast, by Application 2019 & 2032
- Table 16: Japan Virtual Sensing Technology Industry Revenue (Million) Forecast, by Application 2019 & 2032
- Table 17: India Virtual Sensing Technology Industry Revenue (Million) Forecast, by Application 2019 & 2032
- Table 18: South Korea Virtual Sensing Technology Industry Revenue (Million) Forecast, by Application 2019 & 2032
- Table 19: Taiwan Virtual Sensing Technology Industry Revenue (Million) Forecast, by Application 2019 & 2032
- Table 20: Australia Virtual Sensing Technology Industry Revenue (Million) Forecast, by Application 2019 & 2032
- Table 21: Rest of Asia-Pacific Virtual Sensing Technology Industry Revenue (Million) Forecast, by Application 2019 & 2032
- Table 22: Global Virtual Sensing Technology Industry Revenue Million Forecast, by Country 2019 & 2032
- Table 23: Germany Virtual Sensing Technology Industry Revenue (Million) Forecast, by Application 2019 & 2032
- Table 24: France Virtual Sensing Technology Industry Revenue (Million) Forecast, by Application 2019 & 2032
- Table 25: Italy Virtual Sensing Technology Industry Revenue (Million) Forecast, by Application 2019 & 2032
- Table 26: United Kingdom Virtual Sensing Technology Industry Revenue (Million) Forecast, by Application 2019 & 2032
- Table 27: Netherlands Virtual Sensing Technology Industry Revenue (Million) Forecast, by Application 2019 & 2032
- Table 28: Sweden Virtual Sensing Technology Industry Revenue (Million) Forecast, by Application 2019 & 2032
- Table 29: Rest of Europe Virtual Sensing Technology Industry Revenue (Million) Forecast, by Application 2019 & 2032
- Table 30: Global Virtual Sensing Technology Industry Revenue Million Forecast, by Country 2019 & 2032
- Table 31: Brazil Virtual Sensing Technology Industry Revenue (Million) Forecast, by Application 2019 & 2032
- Table 32: Argentina Virtual Sensing Technology Industry Revenue (Million) Forecast, by Application 2019 & 2032
- Table 33: Rest of South America Virtual Sensing Technology Industry Revenue (Million) Forecast, by Application 2019 & 2032
- Table 34: Global Virtual Sensing Technology Industry Revenue Million Forecast, by Country 2019 & 2032
- Table 35: UAE Virtual Sensing Technology Industry Revenue (Million) Forecast, by Application 2019 & 2032
- Table 36: South Africa Virtual Sensing Technology Industry Revenue (Million) Forecast, by Application 2019 & 2032
- Table 37: Saudi Arabia Virtual Sensing Technology Industry Revenue (Million) Forecast, by Application 2019 & 2032
- Table 38: Rest of MEA Virtual Sensing Technology Industry Revenue (Million) Forecast, by Application 2019 & 2032
- Table 39: Global Virtual Sensing Technology Industry Revenue Million Forecast, by Deployment Type 2019 & 2032
- Table 40: Global Virtual Sensing Technology Industry Revenue Million Forecast, by End-user Industry 2019 & 2032
- Table 41: Global Virtual Sensing Technology Industry Revenue Million Forecast, by Market Segmentation and Target Audience 2019 & 2032
- Table 42: Global Virtual Sensing Technology Industry Revenue Million Forecast, by Value Proposition 2019 & 2032
- Table 43: Global Virtual Sensing Technology Industry Revenue Million Forecast, by Distribution Channel Strategies 2019 & 2032
- Table 44: Global Virtual Sensing Technology Industry Revenue Million Forecast, by Competitive Landscape 2019 & 2032
- Table 45: Global Virtual Sensing Technology Industry Revenue Million Forecast, by Addressing Market Challenges 2019 & 2032
- Table 46: Global Virtual Sensing Technology Industry Revenue Million Forecast, by Conclusion and Recommendations 2019 & 2032
- Table 47: Global Virtual Sensing Technology Industry Revenue Million Forecast, by Country 2019 & 2032
- Table 48: United States Virtual Sensing Technology Industry Revenue (Million) Forecast, by Application 2019 & 2032
- Table 49: Canada Virtual Sensing Technology Industry Revenue (Million) Forecast, by Application 2019 & 2032
- Table 50: Global Virtual Sensing Technology Industry Revenue Million Forecast, by Deployment Type 2019 & 2032
- Table 51: Global Virtual Sensing Technology Industry Revenue Million Forecast, by End-user Industry 2019 & 2032
- Table 52: Global Virtual Sensing Technology Industry Revenue Million Forecast, by Market Segmentation and Target Audience 2019 & 2032
- Table 53: Global Virtual Sensing Technology Industry Revenue Million Forecast, by Value Proposition 2019 & 2032
- Table 54: Global Virtual Sensing Technology Industry Revenue Million Forecast, by Distribution Channel Strategies 2019 & 2032
- Table 55: Global Virtual Sensing Technology Industry Revenue Million Forecast, by Competitive Landscape 2019 & 2032
- Table 56: Global Virtual Sensing Technology Industry Revenue Million Forecast, by Addressing Market Challenges 2019 & 2032
- Table 57: Global Virtual Sensing Technology Industry Revenue Million Forecast, by Conclusion and Recommendations 2019 & 2032
- Table 58: Global Virtual Sensing Technology Industry Revenue Million Forecast, by Country 2019 & 2032
- Table 59: United Kingdom Virtual Sensing Technology Industry Revenue (Million) Forecast, by Application 2019 & 2032
- Table 60: Germany Virtual Sensing Technology Industry Revenue (Million) Forecast, by Application 2019 & 2032
- Table 61: France Virtual Sensing Technology Industry Revenue (Million) Forecast, by Application 2019 & 2032
- Table 62: Italy Virtual Sensing Technology Industry Revenue (Million) Forecast, by Application 2019 & 2032
- Table 63: Global Virtual Sensing Technology Industry Revenue Million Forecast, by Deployment Type 2019 & 2032
- Table 64: Global Virtual Sensing Technology Industry Revenue Million Forecast, by End-user Industry 2019 & 2032
- Table 65: Global Virtual Sensing Technology Industry Revenue Million Forecast, by Market Segmentation and Target Audience 2019 & 2032
- Table 66: Global Virtual Sensing Technology Industry Revenue Million Forecast, by Value Proposition 2019 & 2032
- Table 67: Global Virtual Sensing Technology Industry Revenue Million Forecast, by Distribution Channel Strategies 2019 & 2032
- Table 68: Global Virtual Sensing Technology Industry Revenue Million Forecast, by Competitive Landscape 2019 & 2032
- Table 69: Global Virtual Sensing Technology Industry Revenue Million Forecast, by Addressing Market Challenges 2019 & 2032
- Table 70: Global Virtual Sensing Technology Industry Revenue Million Forecast, by Conclusion and Recommendations 2019 & 2032
- Table 71: Global Virtual Sensing Technology Industry Revenue Million Forecast, by Country 2019 & 2032
- Table 72: China Virtual Sensing Technology Industry Revenue (Million) Forecast, by Application 2019 & 2032
- Table 73: Japan Virtual Sensing Technology Industry Revenue (Million) Forecast, by Application 2019 & 2032
- Table 74: India Virtual Sensing Technology Industry Revenue (Million) Forecast, by Application 2019 & 2032
- Table 75: Global Virtual Sensing Technology Industry Revenue Million Forecast, by Deployment Type 2019 & 2032
- Table 76: Global Virtual Sensing Technology Industry Revenue Million Forecast, by End-user Industry 2019 & 2032
- Table 77: Global Virtual Sensing Technology Industry Revenue Million Forecast, by Market Segmentation and Target Audience 2019 & 2032
- Table 78: Global Virtual Sensing Technology Industry Revenue Million Forecast, by Value Proposition 2019 & 2032
- Table 79: Global Virtual Sensing Technology Industry Revenue Million Forecast, by Distribution Channel Strategies 2019 & 2032
- Table 80: Global Virtual Sensing Technology Industry Revenue Million Forecast, by Competitive Landscape 2019 & 2032
- Table 81: Global Virtual Sensing Technology Industry Revenue Million Forecast, by Addressing Market Challenges 2019 & 2032
- Table 82: Global Virtual Sensing Technology Industry Revenue Million Forecast, by Conclusion and Recommendations 2019 & 2032
- Table 83: Global Virtual Sensing Technology Industry Revenue Million Forecast, by Country 2019 & 2032
- Table 84: Global Virtual Sensing Technology Industry Revenue Million Forecast, by Deployment Type 2019 & 2032
- Table 85: Global Virtual Sensing Technology Industry Revenue Million Forecast, by End-user Industry 2019 & 2032
- Table 86: Global Virtual Sensing Technology Industry Revenue Million Forecast, by Market Segmentation and Target Audience 2019 & 2032
- Table 87: Global Virtual Sensing Technology Industry Revenue Million Forecast, by Value Proposition 2019 & 2032
- Table 88: Global Virtual Sensing Technology Industry Revenue Million Forecast, by Distribution Channel Strategies 2019 & 2032
- Table 89: Global Virtual Sensing Technology Industry Revenue Million Forecast, by Competitive Landscape 2019 & 2032
- Table 90: Global Virtual Sensing Technology Industry Revenue Million Forecast, by Addressing Market Challenges 2019 & 2032
- Table 91: Global Virtual Sensing Technology Industry Revenue Million Forecast, by Conclusion and Recommendations 2019 & 2032
- Table 92: Global Virtual Sensing Technology Industry Revenue Million Forecast, by Country 2019 & 2032
- Table 93: Global Virtual Sensing Technology Industry Revenue Million Forecast, by Deployment Type 2019 & 2032
- Table 94: Global Virtual Sensing Technology Industry Revenue Million Forecast, by End-user Industry 2019 & 2032
- Table 95: Global Virtual Sensing Technology Industry Revenue Million Forecast, by Market Segmentation and Target Audience 2019 & 2032
- Table 96: Global Virtual Sensing Technology Industry Revenue Million Forecast, by Value Proposition 2019 & 2032
- Table 97: Global Virtual Sensing Technology Industry Revenue Million Forecast, by Distribution Channel Strategies 2019 & 2032
- Table 98: Global Virtual Sensing Technology Industry Revenue Million Forecast, by Competitive Landscape 2019 & 2032
- Table 99: Global Virtual Sensing Technology Industry Revenue Million Forecast, by Addressing Market Challenges 2019 & 2032
- Table 100: Global Virtual Sensing Technology Industry Revenue Million Forecast, by Conclusion and Recommendations 2019 & 2032
- Table 101: Global Virtual Sensing Technology Industry Revenue Million Forecast, by Country 2019 & 2032
Frequently Asked Questions
1. What is the projected Compound Annual Growth Rate (CAGR) of the Virtual Sensing Technology Industry?
The projected CAGR is approximately 31.38%.
2. Which companies are prominent players in the Virtual Sensing Technology Industry?
Key companies in the market include Körber AG, Modelway SRL, Elliptic Labs ASA, Cisco Systems Inc, Siemens AG, Schneider Electric SE, Andata Lt, Intelli Dynamics (Biocomp Systems Inc ), General Electric Company.
3. What are the main segments of the Virtual Sensing Technology Industry?
The market segments include Deployment Type, End-user Industry, Market Segmentation and Target Audience, Value Proposition, Distribution Channel Strategies, Competitive Landscape, Addressing Market Challenges, Conclusion and Recommendations.
4. Can you provide details about the market size?
The market size is estimated to be USD 1.04 Million as of 2022.
5. What are some drivers contributing to market growth?
Increasing Adoption of IoT and Cloud Platform Is Expected to Drive the Market; Growing Need For Enhanced Cost-effectiveness and Operational Efficiency in Manufacturing.
6. What are the notable trends driving market growth?
Transportation and Automotive Industry to be the Fastest Growing End User.
7. Are there any restraints impacting market growth?
High Deployment and Maintenance Cost.
8. Can you provide examples of recent developments in the market?
March 2024 - Elliptic Labs announced that it has deployed over 500 million devices and is shipping its AI Virtual Proximity Sensor INNER BEAUTY on the Lava Blaze Curve smartphone. Elliptic Labs' newest smartphone customer, Lava International, has released the Lava Blaze Curve smartphone for the international market. Lava has collaborated with Elliptic Labs' partner MediaTek and chosen MediaTek's Dimensity 7050 chipset to drive the Blaze Curve smartphone. Elliptic Labs previously announced the contract for this launch.
9. What pricing options are available for accessing the report?
Pricing options include single-user, multi-user, and enterprise licenses priced at USD 4750, USD 5250, and USD 8750 respectively.
10. Is the market size provided in terms of value or volume?
The market size is provided in terms of value, measured in Million.
11. Are there any specific market keywords associated with the report?
Yes, the market keyword associated with the report is "Virtual Sensing Technology Industry," which aids in identifying and referencing the specific market segment covered.
12. How do I determine which pricing option suits my needs best?
The pricing options vary based on user requirements and access needs. Individual users may opt for single-user licenses, while businesses requiring broader access may choose multi-user or enterprise licenses for cost-effective access to the report.
13. Are there any additional resources or data provided in the Virtual Sensing Technology Industry report?
While the report offers comprehensive insights, it's advisable to review the specific contents or supplementary materials provided to ascertain if additional resources or data are available.
14. How can I stay updated on further developments or reports in the Virtual Sensing Technology Industry?
To stay informed about further developments, trends, and reports in the Virtual Sensing Technology Industry, consider subscribing to industry newsletters, following relevant companies and organizations, or regularly checking reputable industry news sources and publications.
Methodology
Step 1 - Identification of Relevant Samples Size from Population Database


Step 2 - Approaches for Defining Global Market Size (Value, Volume* & Price*)

Note*: In applicable scenarios
Step 3 - Data Sources
Primary Research
- Web Analytics
- Survey Reports
- Research Institute
- Latest Research Reports
- Opinion Leaders
Secondary Research
- Annual Reports
- White Paper
- Latest Press Release
- Industry Association
- Paid Database
- Investor Presentations

Step 4 - Data Triangulation
Involves using different sources of information in order to increase the validity of a study
These sources are likely to be stakeholders in a program - participants, other researchers, program staff, other community members, and so on.
Then we put all data in single framework & apply various statistical tools to find out the dynamic on the market.
During the analysis stage, feedback from the stakeholder groups would be compared to determine areas of agreement as well as areas of divergence


