
Key Insights
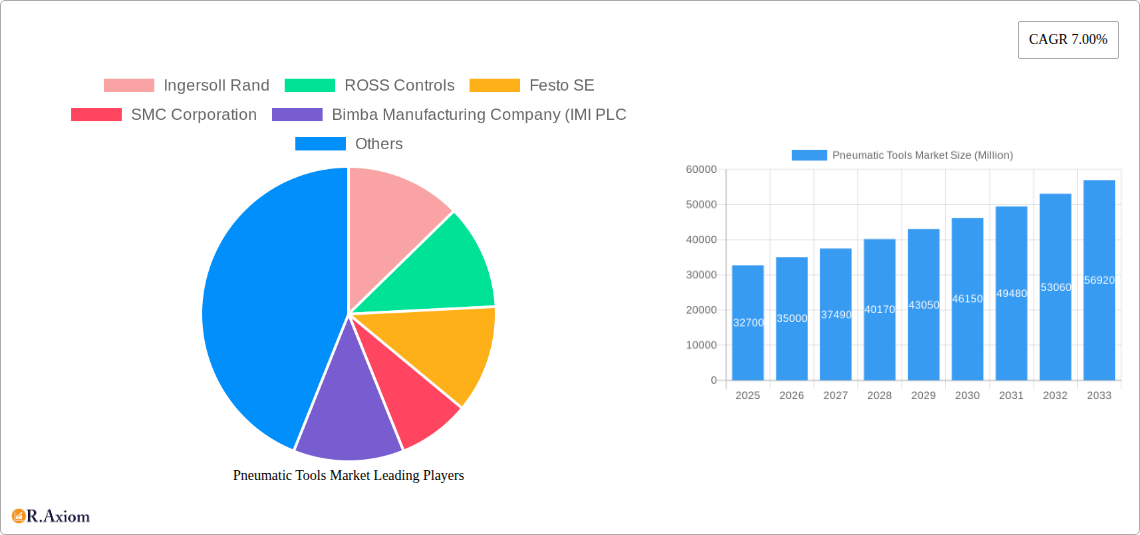
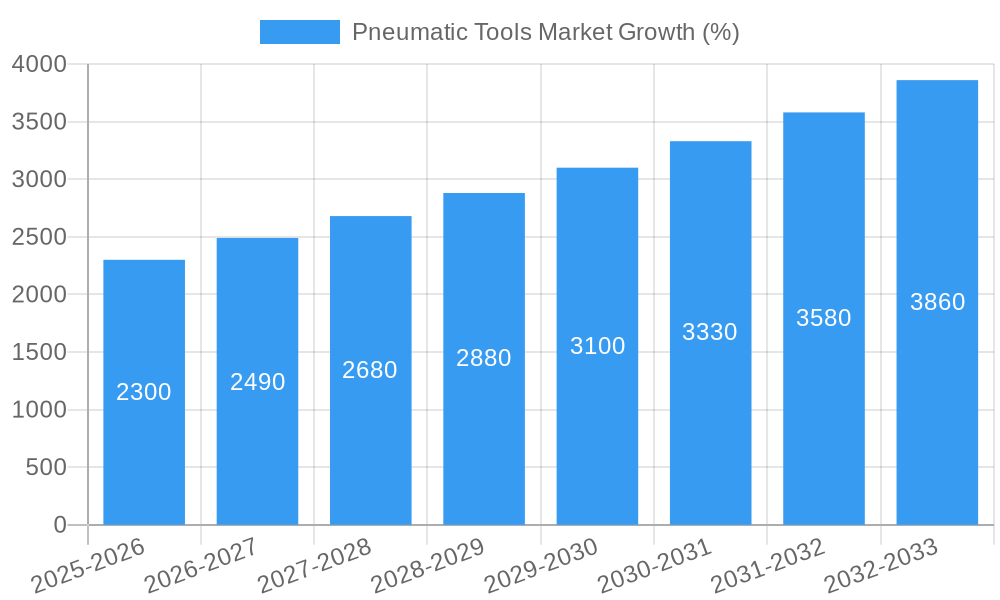
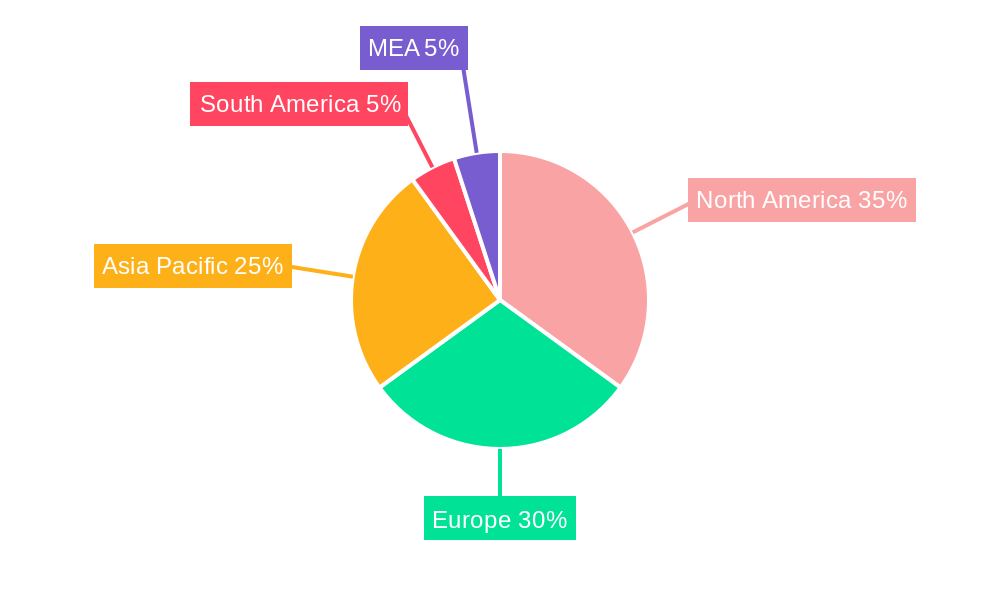
The global pneumatic tools market, valued at $32.70 billion in 2025, is projected to experience robust growth, exhibiting a Compound Annual Growth Rate (CAGR) of 7.00% from 2025 to 2033. This expansion is driven by several key factors. Increased automation across diverse industries, particularly automotive manufacturing, food and beverage processing, and aerospace, fuels the demand for efficient and reliable pneumatic tools. The inherent advantages of pneumatic tools – such as their durability, lightweight design in many applications, and suitability for hazardous environments – contribute significantly to their widespread adoption. Furthermore, ongoing technological advancements, focusing on improved energy efficiency, reduced noise pollution, and enhanced precision, are further propelling market growth. However, the market faces certain restraints, including the rising cost of raw materials and the increasing preference for electric and robotic alternatives in some sectors. The market is segmented by equipment type (actuators, valves, fittings, and others) and end-user industry (automotive, food and beverage, aerospace & defense, life sciences, chemicals & petrochemicals, and others). The automotive industry currently holds a substantial market share due to high demand for pneumatic tools in assembly lines and related operations, though other sectors are exhibiting accelerated growth. North America and Europe currently dominate the market, but the Asia-Pacific region is anticipated to witness the fastest growth due to rapid industrialization and expanding manufacturing capabilities in countries like China and India. Leading players like Ingersoll Rand, Festo, SMC Corporation, and Parker Hannifin are continuously investing in research and development to maintain their competitive edge and meet evolving market demands.
The forecast period (2025-2033) anticipates significant expansion in all major regions, with particularly strong growth projected for the Asia-Pacific market due to its burgeoning manufacturing sector. The continued adoption of pneumatic tools in diverse applications, coupled with technological innovations aimed at enhancing performance and addressing environmental concerns, will likely offset the challenges posed by rising material costs and competition from alternative technologies. Specific segments, such as actuators and valves, are expected to show stronger growth rates than others, reflecting the importance of these core components in many pneumatic tool applications. Strategic partnerships, mergers, and acquisitions among key players will also shape the market landscape in the coming years, leading to greater product diversification and increased market concentration.
Pneumatic Tools Market: A Comprehensive Report (2019-2033)
This in-depth report provides a comprehensive analysis of the global Pneumatic Tools Market, offering invaluable insights for stakeholders across the industry. The study period covers 2019-2033, with 2025 as the base year and forecast period spanning 2025-2033. The report meticulously examines market dynamics, segmentation, competitive landscape, and future growth potential. Key players such as Ingersoll Rand, ROSS Controls, Festo SE, SMC Corporation, and Bimba Manufacturing Company (IMI PLC) are thoroughly profiled.
Pneumatic Tools Market Concentration & Innovation
The pneumatic tools market exhibits a moderately consolidated structure, with a few major players holding significant market share. Ingersoll Rand, Festo SE, and SMC Corporation are among the dominant players, collectively accounting for an estimated xx% of the global market in 2025. However, the presence of several regional and niche players fosters competition and innovation. Market concentration is expected to remain relatively stable throughout the forecast period, with potential shifts influenced by M&A activities and the emergence of innovative technologies.
Innovation in the pneumatic tools sector is driven by the need for increased efficiency, enhanced precision, and improved energy efficiency. Regulatory frameworks, particularly those related to environmental sustainability and safety, are also shaping innovation, encouraging the development of eco-friendly and safer pneumatic tools. The market witnesses constant development of advanced materials, improved designs and sophisticated control systems.
Product substitutes, such as electric and hydraulic tools, present a competitive challenge. However, pneumatic tools continue to hold advantages in specific applications due to their robustness, reliability, and suitability for hazardous environments. End-user trends, particularly towards automation and Industry 4.0 adoption, are fueling demand for advanced pneumatic tools with integrated sensors and smart capabilities.
M&A activity in the sector has been moderate in recent years, with deal values averaging approximately xx Million annually during the historical period. These mergers and acquisitions mainly focus on expanding product portfolios, enhancing geographical reach, and acquiring specialized technologies.
Pneumatic Tools Market Industry Trends & Insights
The global pneumatic tools market is projected to experience a CAGR of xx% during the forecast period (2025-2033), driven by robust growth across various end-user industries. Key growth drivers include increasing automation across manufacturing sectors, rising demand for sophisticated pneumatic tools in diverse applications, and the expansion of emerging economies. Technological disruptions, such as the integration of advanced sensors, IoT capabilities, and AI-based control systems are revolutionizing the capabilities of pneumatic tools, further boosting market growth.
Consumer preferences are shifting toward lightweight, ergonomic, and energy-efficient tools. This trend is driving manufacturers to invest in research and development to enhance product features and designs. Competitive dynamics are intense, with companies focusing on product differentiation, technological advancements, and strategic partnerships to maintain a competitive edge. Market penetration of advanced pneumatic tools is increasing, particularly in the automotive and aerospace industries.
Dominant Markets & Segments in Pneumatic Tools Market
The automotive industry remains the dominant end-user segment for pneumatic tools, accounting for an estimated xx% of the market in 2025. This is attributed to the extensive use of pneumatic tools in various automotive manufacturing processes, such as assembly, painting, and welding. Other significant end-user industries include food and beverage processing and packaging, aerospace and defense, and chemical and petrochemical sectors.
By Type of Equipment: Actuators hold the largest market share, driven by their extensive application in automation systems and industrial processes. Valves and fittings are also essential components of pneumatic systems, contributing significantly to overall market revenue.
By End-user Industry:
- Automotive: High production volumes and the complexity of automotive manufacturing drive significant demand for pneumatic tools. The sector's focus on efficiency improvements continues to fuel market expansion.
- Food and Beverage Processing and Packaging: The need for hygienic, reliable, and easy-to-clean equipment in food processing facilities boosts demand for pneumatic tools.
- Aerospace and Defense: The demand for high-precision and reliable tools in the aerospace and defense industries sustains market growth.
- Life Sciences: The pharmaceutical and biotechnology sectors utilize pneumatic tools in various applications, demanding high levels of precision and sterility.
- Chemical and Petrochemical: The hazardous nature of operations in these industries makes pneumatic tools a preferred choice.
Geographic dominance is expected to shift gradually towards the Asia-Pacific region driven by industrialization and expanding manufacturing bases in countries like China and India. North America and Europe remain significant markets, however, with high adoption rates of advanced pneumatic technologies.
Pneumatic Tools Market Product Developments
Recent product innovations focus on enhancing precision, efficiency, and safety. The development of smart pneumatic tools with integrated sensors and data analytics capabilities is a key trend. Miniaturization of components is allowing for the creation of more compact and versatile tools. Improved materials are also leading to greater durability and longer lifespan, ultimately reducing operational costs. These advancements are improving the overall market fit for pneumatic tools in a wide array of applications, from precision assembly to heavy-duty industrial operations.
Report Scope & Segmentation Analysis
This report segments the pneumatic tools market by type of equipment (actuators, valves, fittings, other types of equipment) and by end-user industry (automotive, food and beverage processing and packaging, aerospace and defense, life sciences, chemical and petrochemical, other end-user industries). Each segment is analyzed in detail, providing market size estimations, growth projections, and competitive dynamics. Actuators are projected to have the highest growth rate across the forecast period, while the automotive industry is expected to maintain its dominant position in terms of market share.
Key Drivers of Pneumatic Tools Market Growth
Several factors are driving the growth of the pneumatic tools market. Automation and increased adoption of robotics in industrial settings are major factors, creating high demand for pneumatic components for automation systems. Furthermore, government initiatives promoting industrial development in several regions are boosting market growth. Finally, the rising demand for energy-efficient and sustainable manufacturing processes is supporting the development of advanced and eco-friendly pneumatic tools.
Challenges in the Pneumatic Tools Market Sector
The pneumatic tools market faces challenges including fluctuations in raw material prices, supply chain disruptions affecting component availability, and increasing competition from alternative technologies like electric and hydraulic systems. Regulatory changes related to safety and environmental standards can also impact the market. These challenges can lead to increased production costs and potentially affect the market growth trajectory. For example, supply chain disruptions in 2022-2023 impacted production by an estimated xx%.
Emerging Opportunities in Pneumatic Tools Market
Emerging opportunities lie in the development of advanced pneumatic systems integrated with IoT and AI, creating smart factories. Growth in renewable energy sectors presents opportunities for the application of pneumatic tools. Furthermore, the expansion of e-commerce and the need for efficient packaging solutions are boosting the market for pneumatic tools in this sector. Finally, the development of lightweight and sustainable pneumatic tools is an area of significant opportunity.
Leading Players in the Pneumatic Tools Market Market
- Ingersoll Rand
- ROSS Controls
- Festo SE
- SMC Corporation
- Bimba Manufacturing Company (IMI PLC)
- Chicago Pneumatic
- Emerson Electric Co
- Siemens AG
- Janatics
- Koki Holdings Co Ltd
- Parker Hannifin Corp
- Eaton Corporation
Key Developments in Pneumatic Tools Market Industry
- December 2023: Researchers at the Shenzhen Institute of Advanced Technology (SIAT) developed a reprogrammable bistable soft gripper, showcasing advancements in soft robotics and human-machine interaction. This development highlights the potential for innovative pneumatic actuators in advanced applications.
- July 2023: KSB Group's launch of pneumatic 90° quarter-turn actuators expands the range of available actuators for part-turn valves, impacting various industries such as water treatment, wastewater treatment, and power generation.
Strategic Outlook for Pneumatic Tools Market Market
The future of the pneumatic tools market looks promising, driven by technological advancements and the increasing adoption of automation across various industrial sectors. The focus on energy efficiency, sustainability, and the integration of smart technologies will continue to shape the market. Companies that can effectively leverage technological innovation and cater to evolving customer preferences will be well-positioned to capture significant market share in the coming years. The continued expansion of emerging economies and the rising demand for automation in developing nations offer significant growth potential for pneumatic tool manufacturers.
Pneumatic Tools Market Segmentation
-
1. Type of Equipment
- 1.1. Actuators
- 1.2. Valves
- 1.3. Fittings
- 1.4. Other Types of Equipment
-
2. End-user Industry
- 2.1. Automotive
- 2.2. Food and Beverage Processing and Packaging
- 2.3. Aerospace and Defense
- 2.4. Life Sciences
- 2.5. Chemical and Petrochemical
- 2.6. Other End-user Industries
Pneumatic Tools Market Segmentation By Geography
-
1. North America
- 1.1. United States
- 1.2. Canada
-
2. Europe
- 2.1. United Kingdom
- 2.2. Germany
- 2.3. France
- 2.4. Rest of Europe
-
3. Asia Pacific
- 3.1. China
- 3.2. Japan
- 3.3. India
- 3.4. Rest of Asia Pacific
- 4. Latin America
- 5. Middle East
Pneumatic Tools Market REPORT HIGHLIGHTS
| Aspects | Details |
|---|---|
| Study Period | 2019-2033 |
| Base Year | 2024 |
| Estimated Year | 2025 |
| Forecast Period | 2025-2033 |
| Historical Period | 2019-2024 |
| Growth Rate | CAGR of 7.00% from 2019-2033 |
| Segmentation |
|
Table of Contents
- 1. Introduction
- 1.1. Research Scope
- 1.2. Market Segmentation
- 1.3. Research Methodology
- 1.4. Definitions and Assumptions
- 2. Executive Summary
- 2.1. Introduction
- 3. Market Dynamics
- 3.1. Introduction
- 3.2. Market Drivers
- 3.2.1. Increasing Automation Across Industries; Stringent Government Regulations
- 3.3. Market Restrains
- 3.3.1. ; Limited In-House Skillset to Manage Monitoring Solutions and Analyze Data; High Costs of Installation and Maintenance
- 3.4. Market Trends
- 3.4.1. Industrial End-user Segment to Hold Major Market Share
- 4. Market Factor Analysis
- 4.1. Porters Five Forces
- 4.2. Supply/Value Chain
- 4.3. PESTEL analysis
- 4.4. Market Entropy
- 4.5. Patent/Trademark Analysis
- 5. Global Pneumatic Tools Market Analysis, Insights and Forecast, 2019-2031
- 5.1. Market Analysis, Insights and Forecast - by Type of Equipment
- 5.1.1. Actuators
- 5.1.2. Valves
- 5.1.3. Fittings
- 5.1.4. Other Types of Equipment
- 5.2. Market Analysis, Insights and Forecast - by End-user Industry
- 5.2.1. Automotive
- 5.2.2. Food and Beverage Processing and Packaging
- 5.2.3. Aerospace and Defense
- 5.2.4. Life Sciences
- 5.2.5. Chemical and Petrochemical
- 5.2.6. Other End-user Industries
- 5.3. Market Analysis, Insights and Forecast - by Region
- 5.3.1. North America
- 5.3.2. Europe
- 5.3.3. Asia Pacific
- 5.3.4. Latin America
- 5.3.5. Middle East
- 5.1. Market Analysis, Insights and Forecast - by Type of Equipment
- 6. North America Pneumatic Tools Market Analysis, Insights and Forecast, 2019-2031
- 6.1. Market Analysis, Insights and Forecast - by Type of Equipment
- 6.1.1. Actuators
- 6.1.2. Valves
- 6.1.3. Fittings
- 6.1.4. Other Types of Equipment
- 6.2. Market Analysis, Insights and Forecast - by End-user Industry
- 6.2.1. Automotive
- 6.2.2. Food and Beverage Processing and Packaging
- 6.2.3. Aerospace and Defense
- 6.2.4. Life Sciences
- 6.2.5. Chemical and Petrochemical
- 6.2.6. Other End-user Industries
- 6.1. Market Analysis, Insights and Forecast - by Type of Equipment
- 7. Europe Pneumatic Tools Market Analysis, Insights and Forecast, 2019-2031
- 7.1. Market Analysis, Insights and Forecast - by Type of Equipment
- 7.1.1. Actuators
- 7.1.2. Valves
- 7.1.3. Fittings
- 7.1.4. Other Types of Equipment
- 7.2. Market Analysis, Insights and Forecast - by End-user Industry
- 7.2.1. Automotive
- 7.2.2. Food and Beverage Processing and Packaging
- 7.2.3. Aerospace and Defense
- 7.2.4. Life Sciences
- 7.2.5. Chemical and Petrochemical
- 7.2.6. Other End-user Industries
- 7.1. Market Analysis, Insights and Forecast - by Type of Equipment
- 8. Asia Pacific Pneumatic Tools Market Analysis, Insights and Forecast, 2019-2031
- 8.1. Market Analysis, Insights and Forecast - by Type of Equipment
- 8.1.1. Actuators
- 8.1.2. Valves
- 8.1.3. Fittings
- 8.1.4. Other Types of Equipment
- 8.2. Market Analysis, Insights and Forecast - by End-user Industry
- 8.2.1. Automotive
- 8.2.2. Food and Beverage Processing and Packaging
- 8.2.3. Aerospace and Defense
- 8.2.4. Life Sciences
- 8.2.5. Chemical and Petrochemical
- 8.2.6. Other End-user Industries
- 8.1. Market Analysis, Insights and Forecast - by Type of Equipment
- 9. Latin America Pneumatic Tools Market Analysis, Insights and Forecast, 2019-2031
- 9.1. Market Analysis, Insights and Forecast - by Type of Equipment
- 9.1.1. Actuators
- 9.1.2. Valves
- 9.1.3. Fittings
- 9.1.4. Other Types of Equipment
- 9.2. Market Analysis, Insights and Forecast - by End-user Industry
- 9.2.1. Automotive
- 9.2.2. Food and Beverage Processing and Packaging
- 9.2.3. Aerospace and Defense
- 9.2.4. Life Sciences
- 9.2.5. Chemical and Petrochemical
- 9.2.6. Other End-user Industries
- 9.1. Market Analysis, Insights and Forecast - by Type of Equipment
- 10. Middle East Pneumatic Tools Market Analysis, Insights and Forecast, 2019-2031
- 10.1. Market Analysis, Insights and Forecast - by Type of Equipment
- 10.1.1. Actuators
- 10.1.2. Valves
- 10.1.3. Fittings
- 10.1.4. Other Types of Equipment
- 10.2. Market Analysis, Insights and Forecast - by End-user Industry
- 10.2.1. Automotive
- 10.2.2. Food and Beverage Processing and Packaging
- 10.2.3. Aerospace and Defense
- 10.2.4. Life Sciences
- 10.2.5. Chemical and Petrochemical
- 10.2.6. Other End-user Industries
- 10.1. Market Analysis, Insights and Forecast - by Type of Equipment
- 11. North America Pneumatic Tools Market Analysis, Insights and Forecast, 2019-2031
- 11.1. Market Analysis, Insights and Forecast - By Country/Sub-region
- 11.1.1 United States
- 11.1.2 Canada
- 11.1.3 Mexico
- 12. Europe Pneumatic Tools Market Analysis, Insights and Forecast, 2019-2031
- 12.1. Market Analysis, Insights and Forecast - By Country/Sub-region
- 12.1.1 Germany
- 12.1.2 United Kingdom
- 12.1.3 France
- 12.1.4 Spain
- 12.1.5 Italy
- 12.1.6 Spain
- 12.1.7 Belgium
- 12.1.8 Netherland
- 12.1.9 Nordics
- 12.1.10 Rest of Europe
- 13. Asia Pacific Pneumatic Tools Market Analysis, Insights and Forecast, 2019-2031
- 13.1. Market Analysis, Insights and Forecast - By Country/Sub-region
- 13.1.1 China
- 13.1.2 Japan
- 13.1.3 India
- 13.1.4 South Korea
- 13.1.5 Southeast Asia
- 13.1.6 Australia
- 13.1.7 Indonesia
- 13.1.8 Phillipes
- 13.1.9 Singapore
- 13.1.10 Thailandc
- 13.1.11 Rest of Asia Pacific
- 14. South America Pneumatic Tools Market Analysis, Insights and Forecast, 2019-2031
- 14.1. Market Analysis, Insights and Forecast - By Country/Sub-region
- 14.1.1 Brazil
- 14.1.2 Argentina
- 14.1.3 Peru
- 14.1.4 Chile
- 14.1.5 Colombia
- 14.1.6 Ecuador
- 14.1.7 Venezuela
- 14.1.8 Rest of South America
- 15. North America Pneumatic Tools Market Analysis, Insights and Forecast, 2019-2031
- 15.1. Market Analysis, Insights and Forecast - By Country/Sub-region
- 15.1.1 United States
- 15.1.2 Canada
- 15.1.3 Mexico
- 16. MEA Pneumatic Tools Market Analysis, Insights and Forecast, 2019-2031
- 16.1. Market Analysis, Insights and Forecast - By Country/Sub-region
- 16.1.1 United Arab Emirates
- 16.1.2 Saudi Arabia
- 16.1.3 South Africa
- 16.1.4 Rest of Middle East and Africa
- 17. Competitive Analysis
- 17.1. Global Market Share Analysis 2024
- 17.2. Company Profiles
- 17.2.1 Ingersoll Rand
- 17.2.1.1. Overview
- 17.2.1.2. Products
- 17.2.1.3. SWOT Analysis
- 17.2.1.4. Recent Developments
- 17.2.1.5. Financials (Based on Availability)
- 17.2.2 ROSS Controls
- 17.2.2.1. Overview
- 17.2.2.2. Products
- 17.2.2.3. SWOT Analysis
- 17.2.2.4. Recent Developments
- 17.2.2.5. Financials (Based on Availability)
- 17.2.3 Festo SE
- 17.2.3.1. Overview
- 17.2.3.2. Products
- 17.2.3.3. SWOT Analysis
- 17.2.3.4. Recent Developments
- 17.2.3.5. Financials (Based on Availability)
- 17.2.4 SMC Corporation
- 17.2.4.1. Overview
- 17.2.4.2. Products
- 17.2.4.3. SWOT Analysis
- 17.2.4.4. Recent Developments
- 17.2.4.5. Financials (Based on Availability)
- 17.2.5 Bimba Manufacturing Company (IMI PLC
- 17.2.5.1. Overview
- 17.2.5.2. Products
- 17.2.5.3. SWOT Analysis
- 17.2.5.4. Recent Developments
- 17.2.5.5. Financials (Based on Availability)
- 17.2.6 Chicago Pneumatic
- 17.2.6.1. Overview
- 17.2.6.2. Products
- 17.2.6.3. SWOT Analysis
- 17.2.6.4. Recent Developments
- 17.2.6.5. Financials (Based on Availability)
- 17.2.7 Emerson Electric Co
- 17.2.7.1. Overview
- 17.2.7.2. Products
- 17.2.7.3. SWOT Analysis
- 17.2.7.4. Recent Developments
- 17.2.7.5. Financials (Based on Availability)
- 17.2.8 Siemens AG
- 17.2.8.1. Overview
- 17.2.8.2. Products
- 17.2.8.3. SWOT Analysis
- 17.2.8.4. Recent Developments
- 17.2.8.5. Financials (Based on Availability)
- 17.2.9 Janatics
- 17.2.9.1. Overview
- 17.2.9.2. Products
- 17.2.9.3. SWOT Analysis
- 17.2.9.4. Recent Developments
- 17.2.9.5. Financials (Based on Availability)
- 17.2.10 Koki Holdings Co Ltd
- 17.2.10.1. Overview
- 17.2.10.2. Products
- 17.2.10.3. SWOT Analysis
- 17.2.10.4. Recent Developments
- 17.2.10.5. Financials (Based on Availability)
- 17.2.11 Parker Hannifin Corp
- 17.2.11.1. Overview
- 17.2.11.2. Products
- 17.2.11.3. SWOT Analysis
- 17.2.11.4. Recent Developments
- 17.2.11.5. Financials (Based on Availability)
- 17.2.12 Eaton Corporation
- 17.2.12.1. Overview
- 17.2.12.2. Products
- 17.2.12.3. SWOT Analysis
- 17.2.12.4. Recent Developments
- 17.2.12.5. Financials (Based on Availability)
- 17.2.1 Ingersoll Rand
List of Figures
- Figure 1: Global Pneumatic Tools Market Revenue Breakdown (Million, %) by Region 2024 & 2032
- Figure 2: Global Pneumatic Tools Market Volume Breakdown (K Unit, %) by Region 2024 & 2032
- Figure 3: North America Pneumatic Tools Market Revenue (Million), by Country 2024 & 2032
- Figure 4: North America Pneumatic Tools Market Volume (K Unit), by Country 2024 & 2032
- Figure 5: North America Pneumatic Tools Market Revenue Share (%), by Country 2024 & 2032
- Figure 6: North America Pneumatic Tools Market Volume Share (%), by Country 2024 & 2032
- Figure 7: Europe Pneumatic Tools Market Revenue (Million), by Country 2024 & 2032
- Figure 8: Europe Pneumatic Tools Market Volume (K Unit), by Country 2024 & 2032
- Figure 9: Europe Pneumatic Tools Market Revenue Share (%), by Country 2024 & 2032
- Figure 10: Europe Pneumatic Tools Market Volume Share (%), by Country 2024 & 2032
- Figure 11: Asia Pacific Pneumatic Tools Market Revenue (Million), by Country 2024 & 2032
- Figure 12: Asia Pacific Pneumatic Tools Market Volume (K Unit), by Country 2024 & 2032
- Figure 13: Asia Pacific Pneumatic Tools Market Revenue Share (%), by Country 2024 & 2032
- Figure 14: Asia Pacific Pneumatic Tools Market Volume Share (%), by Country 2024 & 2032
- Figure 15: South America Pneumatic Tools Market Revenue (Million), by Country 2024 & 2032
- Figure 16: South America Pneumatic Tools Market Volume (K Unit), by Country 2024 & 2032
- Figure 17: South America Pneumatic Tools Market Revenue Share (%), by Country 2024 & 2032
- Figure 18: South America Pneumatic Tools Market Volume Share (%), by Country 2024 & 2032
- Figure 19: North America Pneumatic Tools Market Revenue (Million), by Country 2024 & 2032
- Figure 20: North America Pneumatic Tools Market Volume (K Unit), by Country 2024 & 2032
- Figure 21: North America Pneumatic Tools Market Revenue Share (%), by Country 2024 & 2032
- Figure 22: North America Pneumatic Tools Market Volume Share (%), by Country 2024 & 2032
- Figure 23: MEA Pneumatic Tools Market Revenue (Million), by Country 2024 & 2032
- Figure 24: MEA Pneumatic Tools Market Volume (K Unit), by Country 2024 & 2032
- Figure 25: MEA Pneumatic Tools Market Revenue Share (%), by Country 2024 & 2032
- Figure 26: MEA Pneumatic Tools Market Volume Share (%), by Country 2024 & 2032
- Figure 27: North America Pneumatic Tools Market Revenue (Million), by Type of Equipment 2024 & 2032
- Figure 28: North America Pneumatic Tools Market Volume (K Unit), by Type of Equipment 2024 & 2032
- Figure 29: North America Pneumatic Tools Market Revenue Share (%), by Type of Equipment 2024 & 2032
- Figure 30: North America Pneumatic Tools Market Volume Share (%), by Type of Equipment 2024 & 2032
- Figure 31: North America Pneumatic Tools Market Revenue (Million), by End-user Industry 2024 & 2032
- Figure 32: North America Pneumatic Tools Market Volume (K Unit), by End-user Industry 2024 & 2032
- Figure 33: North America Pneumatic Tools Market Revenue Share (%), by End-user Industry 2024 & 2032
- Figure 34: North America Pneumatic Tools Market Volume Share (%), by End-user Industry 2024 & 2032
- Figure 35: North America Pneumatic Tools Market Revenue (Million), by Country 2024 & 2032
- Figure 36: North America Pneumatic Tools Market Volume (K Unit), by Country 2024 & 2032
- Figure 37: North America Pneumatic Tools Market Revenue Share (%), by Country 2024 & 2032
- Figure 38: North America Pneumatic Tools Market Volume Share (%), by Country 2024 & 2032
- Figure 39: Europe Pneumatic Tools Market Revenue (Million), by Type of Equipment 2024 & 2032
- Figure 40: Europe Pneumatic Tools Market Volume (K Unit), by Type of Equipment 2024 & 2032
- Figure 41: Europe Pneumatic Tools Market Revenue Share (%), by Type of Equipment 2024 & 2032
- Figure 42: Europe Pneumatic Tools Market Volume Share (%), by Type of Equipment 2024 & 2032
- Figure 43: Europe Pneumatic Tools Market Revenue (Million), by End-user Industry 2024 & 2032
- Figure 44: Europe Pneumatic Tools Market Volume (K Unit), by End-user Industry 2024 & 2032
- Figure 45: Europe Pneumatic Tools Market Revenue Share (%), by End-user Industry 2024 & 2032
- Figure 46: Europe Pneumatic Tools Market Volume Share (%), by End-user Industry 2024 & 2032
- Figure 47: Europe Pneumatic Tools Market Revenue (Million), by Country 2024 & 2032
- Figure 48: Europe Pneumatic Tools Market Volume (K Unit), by Country 2024 & 2032
- Figure 49: Europe Pneumatic Tools Market Revenue Share (%), by Country 2024 & 2032
- Figure 50: Europe Pneumatic Tools Market Volume Share (%), by Country 2024 & 2032
- Figure 51: Asia Pacific Pneumatic Tools Market Revenue (Million), by Type of Equipment 2024 & 2032
- Figure 52: Asia Pacific Pneumatic Tools Market Volume (K Unit), by Type of Equipment 2024 & 2032
- Figure 53: Asia Pacific Pneumatic Tools Market Revenue Share (%), by Type of Equipment 2024 & 2032
- Figure 54: Asia Pacific Pneumatic Tools Market Volume Share (%), by Type of Equipment 2024 & 2032
- Figure 55: Asia Pacific Pneumatic Tools Market Revenue (Million), by End-user Industry 2024 & 2032
- Figure 56: Asia Pacific Pneumatic Tools Market Volume (K Unit), by End-user Industry 2024 & 2032
- Figure 57: Asia Pacific Pneumatic Tools Market Revenue Share (%), by End-user Industry 2024 & 2032
- Figure 58: Asia Pacific Pneumatic Tools Market Volume Share (%), by End-user Industry 2024 & 2032
- Figure 59: Asia Pacific Pneumatic Tools Market Revenue (Million), by Country 2024 & 2032
- Figure 60: Asia Pacific Pneumatic Tools Market Volume (K Unit), by Country 2024 & 2032
- Figure 61: Asia Pacific Pneumatic Tools Market Revenue Share (%), by Country 2024 & 2032
- Figure 62: Asia Pacific Pneumatic Tools Market Volume Share (%), by Country 2024 & 2032
- Figure 63: Latin America Pneumatic Tools Market Revenue (Million), by Type of Equipment 2024 & 2032
- Figure 64: Latin America Pneumatic Tools Market Volume (K Unit), by Type of Equipment 2024 & 2032
- Figure 65: Latin America Pneumatic Tools Market Revenue Share (%), by Type of Equipment 2024 & 2032
- Figure 66: Latin America Pneumatic Tools Market Volume Share (%), by Type of Equipment 2024 & 2032
- Figure 67: Latin America Pneumatic Tools Market Revenue (Million), by End-user Industry 2024 & 2032
- Figure 68: Latin America Pneumatic Tools Market Volume (K Unit), by End-user Industry 2024 & 2032
- Figure 69: Latin America Pneumatic Tools Market Revenue Share (%), by End-user Industry 2024 & 2032
- Figure 70: Latin America Pneumatic Tools Market Volume Share (%), by End-user Industry 2024 & 2032
- Figure 71: Latin America Pneumatic Tools Market Revenue (Million), by Country 2024 & 2032
- Figure 72: Latin America Pneumatic Tools Market Volume (K Unit), by Country 2024 & 2032
- Figure 73: Latin America Pneumatic Tools Market Revenue Share (%), by Country 2024 & 2032
- Figure 74: Latin America Pneumatic Tools Market Volume Share (%), by Country 2024 & 2032
- Figure 75: Middle East Pneumatic Tools Market Revenue (Million), by Type of Equipment 2024 & 2032
- Figure 76: Middle East Pneumatic Tools Market Volume (K Unit), by Type of Equipment 2024 & 2032
- Figure 77: Middle East Pneumatic Tools Market Revenue Share (%), by Type of Equipment 2024 & 2032
- Figure 78: Middle East Pneumatic Tools Market Volume Share (%), by Type of Equipment 2024 & 2032
- Figure 79: Middle East Pneumatic Tools Market Revenue (Million), by End-user Industry 2024 & 2032
- Figure 80: Middle East Pneumatic Tools Market Volume (K Unit), by End-user Industry 2024 & 2032
- Figure 81: Middle East Pneumatic Tools Market Revenue Share (%), by End-user Industry 2024 & 2032
- Figure 82: Middle East Pneumatic Tools Market Volume Share (%), by End-user Industry 2024 & 2032
- Figure 83: Middle East Pneumatic Tools Market Revenue (Million), by Country 2024 & 2032
- Figure 84: Middle East Pneumatic Tools Market Volume (K Unit), by Country 2024 & 2032
- Figure 85: Middle East Pneumatic Tools Market Revenue Share (%), by Country 2024 & 2032
- Figure 86: Middle East Pneumatic Tools Market Volume Share (%), by Country 2024 & 2032
List of Tables
- Table 1: Global Pneumatic Tools Market Revenue Million Forecast, by Region 2019 & 2032
- Table 2: Global Pneumatic Tools Market Volume K Unit Forecast, by Region 2019 & 2032
- Table 3: Global Pneumatic Tools Market Revenue Million Forecast, by Type of Equipment 2019 & 2032
- Table 4: Global Pneumatic Tools Market Volume K Unit Forecast, by Type of Equipment 2019 & 2032
- Table 5: Global Pneumatic Tools Market Revenue Million Forecast, by End-user Industry 2019 & 2032
- Table 6: Global Pneumatic Tools Market Volume K Unit Forecast, by End-user Industry 2019 & 2032
- Table 7: Global Pneumatic Tools Market Revenue Million Forecast, by Region 2019 & 2032
- Table 8: Global Pneumatic Tools Market Volume K Unit Forecast, by Region 2019 & 2032
- Table 9: Global Pneumatic Tools Market Revenue Million Forecast, by Country 2019 & 2032
- Table 10: Global Pneumatic Tools Market Volume K Unit Forecast, by Country 2019 & 2032
- Table 11: United States Pneumatic Tools Market Revenue (Million) Forecast, by Application 2019 & 2032
- Table 12: United States Pneumatic Tools Market Volume (K Unit) Forecast, by Application 2019 & 2032
- Table 13: Canada Pneumatic Tools Market Revenue (Million) Forecast, by Application 2019 & 2032
- Table 14: Canada Pneumatic Tools Market Volume (K Unit) Forecast, by Application 2019 & 2032
- Table 15: Mexico Pneumatic Tools Market Revenue (Million) Forecast, by Application 2019 & 2032
- Table 16: Mexico Pneumatic Tools Market Volume (K Unit) Forecast, by Application 2019 & 2032
- Table 17: Global Pneumatic Tools Market Revenue Million Forecast, by Country 2019 & 2032
- Table 18: Global Pneumatic Tools Market Volume K Unit Forecast, by Country 2019 & 2032
- Table 19: Germany Pneumatic Tools Market Revenue (Million) Forecast, by Application 2019 & 2032
- Table 20: Germany Pneumatic Tools Market Volume (K Unit) Forecast, by Application 2019 & 2032
- Table 21: United Kingdom Pneumatic Tools Market Revenue (Million) Forecast, by Application 2019 & 2032
- Table 22: United Kingdom Pneumatic Tools Market Volume (K Unit) Forecast, by Application 2019 & 2032
- Table 23: France Pneumatic Tools Market Revenue (Million) Forecast, by Application 2019 & 2032
- Table 24: France Pneumatic Tools Market Volume (K Unit) Forecast, by Application 2019 & 2032
- Table 25: Spain Pneumatic Tools Market Revenue (Million) Forecast, by Application 2019 & 2032
- Table 26: Spain Pneumatic Tools Market Volume (K Unit) Forecast, by Application 2019 & 2032
- Table 27: Italy Pneumatic Tools Market Revenue (Million) Forecast, by Application 2019 & 2032
- Table 28: Italy Pneumatic Tools Market Volume (K Unit) Forecast, by Application 2019 & 2032
- Table 29: Spain Pneumatic Tools Market Revenue (Million) Forecast, by Application 2019 & 2032
- Table 30: Spain Pneumatic Tools Market Volume (K Unit) Forecast, by Application 2019 & 2032
- Table 31: Belgium Pneumatic Tools Market Revenue (Million) Forecast, by Application 2019 & 2032
- Table 32: Belgium Pneumatic Tools Market Volume (K Unit) Forecast, by Application 2019 & 2032
- Table 33: Netherland Pneumatic Tools Market Revenue (Million) Forecast, by Application 2019 & 2032
- Table 34: Netherland Pneumatic Tools Market Volume (K Unit) Forecast, by Application 2019 & 2032
- Table 35: Nordics Pneumatic Tools Market Revenue (Million) Forecast, by Application 2019 & 2032
- Table 36: Nordics Pneumatic Tools Market Volume (K Unit) Forecast, by Application 2019 & 2032
- Table 37: Rest of Europe Pneumatic Tools Market Revenue (Million) Forecast, by Application 2019 & 2032
- Table 38: Rest of Europe Pneumatic Tools Market Volume (K Unit) Forecast, by Application 2019 & 2032
- Table 39: Global Pneumatic Tools Market Revenue Million Forecast, by Country 2019 & 2032
- Table 40: Global Pneumatic Tools Market Volume K Unit Forecast, by Country 2019 & 2032
- Table 41: China Pneumatic Tools Market Revenue (Million) Forecast, by Application 2019 & 2032
- Table 42: China Pneumatic Tools Market Volume (K Unit) Forecast, by Application 2019 & 2032
- Table 43: Japan Pneumatic Tools Market Revenue (Million) Forecast, by Application 2019 & 2032
- Table 44: Japan Pneumatic Tools Market Volume (K Unit) Forecast, by Application 2019 & 2032
- Table 45: India Pneumatic Tools Market Revenue (Million) Forecast, by Application 2019 & 2032
- Table 46: India Pneumatic Tools Market Volume (K Unit) Forecast, by Application 2019 & 2032
- Table 47: South Korea Pneumatic Tools Market Revenue (Million) Forecast, by Application 2019 & 2032
- Table 48: South Korea Pneumatic Tools Market Volume (K Unit) Forecast, by Application 2019 & 2032
- Table 49: Southeast Asia Pneumatic Tools Market Revenue (Million) Forecast, by Application 2019 & 2032
- Table 50: Southeast Asia Pneumatic Tools Market Volume (K Unit) Forecast, by Application 2019 & 2032
- Table 51: Australia Pneumatic Tools Market Revenue (Million) Forecast, by Application 2019 & 2032
- Table 52: Australia Pneumatic Tools Market Volume (K Unit) Forecast, by Application 2019 & 2032
- Table 53: Indonesia Pneumatic Tools Market Revenue (Million) Forecast, by Application 2019 & 2032
- Table 54: Indonesia Pneumatic Tools Market Volume (K Unit) Forecast, by Application 2019 & 2032
- Table 55: Phillipes Pneumatic Tools Market Revenue (Million) Forecast, by Application 2019 & 2032
- Table 56: Phillipes Pneumatic Tools Market Volume (K Unit) Forecast, by Application 2019 & 2032
- Table 57: Singapore Pneumatic Tools Market Revenue (Million) Forecast, by Application 2019 & 2032
- Table 58: Singapore Pneumatic Tools Market Volume (K Unit) Forecast, by Application 2019 & 2032
- Table 59: Thailandc Pneumatic Tools Market Revenue (Million) Forecast, by Application 2019 & 2032
- Table 60: Thailandc Pneumatic Tools Market Volume (K Unit) Forecast, by Application 2019 & 2032
- Table 61: Rest of Asia Pacific Pneumatic Tools Market Revenue (Million) Forecast, by Application 2019 & 2032
- Table 62: Rest of Asia Pacific Pneumatic Tools Market Volume (K Unit) Forecast, by Application 2019 & 2032
- Table 63: Global Pneumatic Tools Market Revenue Million Forecast, by Country 2019 & 2032
- Table 64: Global Pneumatic Tools Market Volume K Unit Forecast, by Country 2019 & 2032
- Table 65: Brazil Pneumatic Tools Market Revenue (Million) Forecast, by Application 2019 & 2032
- Table 66: Brazil Pneumatic Tools Market Volume (K Unit) Forecast, by Application 2019 & 2032
- Table 67: Argentina Pneumatic Tools Market Revenue (Million) Forecast, by Application 2019 & 2032
- Table 68: Argentina Pneumatic Tools Market Volume (K Unit) Forecast, by Application 2019 & 2032
- Table 69: Peru Pneumatic Tools Market Revenue (Million) Forecast, by Application 2019 & 2032
- Table 70: Peru Pneumatic Tools Market Volume (K Unit) Forecast, by Application 2019 & 2032
- Table 71: Chile Pneumatic Tools Market Revenue (Million) Forecast, by Application 2019 & 2032
- Table 72: Chile Pneumatic Tools Market Volume (K Unit) Forecast, by Application 2019 & 2032
- Table 73: Colombia Pneumatic Tools Market Revenue (Million) Forecast, by Application 2019 & 2032
- Table 74: Colombia Pneumatic Tools Market Volume (K Unit) Forecast, by Application 2019 & 2032
- Table 75: Ecuador Pneumatic Tools Market Revenue (Million) Forecast, by Application 2019 & 2032
- Table 76: Ecuador Pneumatic Tools Market Volume (K Unit) Forecast, by Application 2019 & 2032
- Table 77: Venezuela Pneumatic Tools Market Revenue (Million) Forecast, by Application 2019 & 2032
- Table 78: Venezuela Pneumatic Tools Market Volume (K Unit) Forecast, by Application 2019 & 2032
- Table 79: Rest of South America Pneumatic Tools Market Revenue (Million) Forecast, by Application 2019 & 2032
- Table 80: Rest of South America Pneumatic Tools Market Volume (K Unit) Forecast, by Application 2019 & 2032
- Table 81: Global Pneumatic Tools Market Revenue Million Forecast, by Country 2019 & 2032
- Table 82: Global Pneumatic Tools Market Volume K Unit Forecast, by Country 2019 & 2032
- Table 83: United States Pneumatic Tools Market Revenue (Million) Forecast, by Application 2019 & 2032
- Table 84: United States Pneumatic Tools Market Volume (K Unit) Forecast, by Application 2019 & 2032
- Table 85: Canada Pneumatic Tools Market Revenue (Million) Forecast, by Application 2019 & 2032
- Table 86: Canada Pneumatic Tools Market Volume (K Unit) Forecast, by Application 2019 & 2032
- Table 87: Mexico Pneumatic Tools Market Revenue (Million) Forecast, by Application 2019 & 2032
- Table 88: Mexico Pneumatic Tools Market Volume (K Unit) Forecast, by Application 2019 & 2032
- Table 89: Global Pneumatic Tools Market Revenue Million Forecast, by Country 2019 & 2032
- Table 90: Global Pneumatic Tools Market Volume K Unit Forecast, by Country 2019 & 2032
- Table 91: United Arab Emirates Pneumatic Tools Market Revenue (Million) Forecast, by Application 2019 & 2032
- Table 92: United Arab Emirates Pneumatic Tools Market Volume (K Unit) Forecast, by Application 2019 & 2032
- Table 93: Saudi Arabia Pneumatic Tools Market Revenue (Million) Forecast, by Application 2019 & 2032
- Table 94: Saudi Arabia Pneumatic Tools Market Volume (K Unit) Forecast, by Application 2019 & 2032
- Table 95: South Africa Pneumatic Tools Market Revenue (Million) Forecast, by Application 2019 & 2032
- Table 96: South Africa Pneumatic Tools Market Volume (K Unit) Forecast, by Application 2019 & 2032
- Table 97: Rest of Middle East and Africa Pneumatic Tools Market Revenue (Million) Forecast, by Application 2019 & 2032
- Table 98: Rest of Middle East and Africa Pneumatic Tools Market Volume (K Unit) Forecast, by Application 2019 & 2032
- Table 99: Global Pneumatic Tools Market Revenue Million Forecast, by Type of Equipment 2019 & 2032
- Table 100: Global Pneumatic Tools Market Volume K Unit Forecast, by Type of Equipment 2019 & 2032
- Table 101: Global Pneumatic Tools Market Revenue Million Forecast, by End-user Industry 2019 & 2032
- Table 102: Global Pneumatic Tools Market Volume K Unit Forecast, by End-user Industry 2019 & 2032
- Table 103: Global Pneumatic Tools Market Revenue Million Forecast, by Country 2019 & 2032
- Table 104: Global Pneumatic Tools Market Volume K Unit Forecast, by Country 2019 & 2032
- Table 105: United States Pneumatic Tools Market Revenue (Million) Forecast, by Application 2019 & 2032
- Table 106: United States Pneumatic Tools Market Volume (K Unit) Forecast, by Application 2019 & 2032
- Table 107: Canada Pneumatic Tools Market Revenue (Million) Forecast, by Application 2019 & 2032
- Table 108: Canada Pneumatic Tools Market Volume (K Unit) Forecast, by Application 2019 & 2032
- Table 109: Global Pneumatic Tools Market Revenue Million Forecast, by Type of Equipment 2019 & 2032
- Table 110: Global Pneumatic Tools Market Volume K Unit Forecast, by Type of Equipment 2019 & 2032
- Table 111: Global Pneumatic Tools Market Revenue Million Forecast, by End-user Industry 2019 & 2032
- Table 112: Global Pneumatic Tools Market Volume K Unit Forecast, by End-user Industry 2019 & 2032
- Table 113: Global Pneumatic Tools Market Revenue Million Forecast, by Country 2019 & 2032
- Table 114: Global Pneumatic Tools Market Volume K Unit Forecast, by Country 2019 & 2032
- Table 115: United Kingdom Pneumatic Tools Market Revenue (Million) Forecast, by Application 2019 & 2032
- Table 116: United Kingdom Pneumatic Tools Market Volume (K Unit) Forecast, by Application 2019 & 2032
- Table 117: Germany Pneumatic Tools Market Revenue (Million) Forecast, by Application 2019 & 2032
- Table 118: Germany Pneumatic Tools Market Volume (K Unit) Forecast, by Application 2019 & 2032
- Table 119: France Pneumatic Tools Market Revenue (Million) Forecast, by Application 2019 & 2032
- Table 120: France Pneumatic Tools Market Volume (K Unit) Forecast, by Application 2019 & 2032
- Table 121: Rest of Europe Pneumatic Tools Market Revenue (Million) Forecast, by Application 2019 & 2032
- Table 122: Rest of Europe Pneumatic Tools Market Volume (K Unit) Forecast, by Application 2019 & 2032
- Table 123: Global Pneumatic Tools Market Revenue Million Forecast, by Type of Equipment 2019 & 2032
- Table 124: Global Pneumatic Tools Market Volume K Unit Forecast, by Type of Equipment 2019 & 2032
- Table 125: Global Pneumatic Tools Market Revenue Million Forecast, by End-user Industry 2019 & 2032
- Table 126: Global Pneumatic Tools Market Volume K Unit Forecast, by End-user Industry 2019 & 2032
- Table 127: Global Pneumatic Tools Market Revenue Million Forecast, by Country 2019 & 2032
- Table 128: Global Pneumatic Tools Market Volume K Unit Forecast, by Country 2019 & 2032
- Table 129: China Pneumatic Tools Market Revenue (Million) Forecast, by Application 2019 & 2032
- Table 130: China Pneumatic Tools Market Volume (K Unit) Forecast, by Application 2019 & 2032
- Table 131: Japan Pneumatic Tools Market Revenue (Million) Forecast, by Application 2019 & 2032
- Table 132: Japan Pneumatic Tools Market Volume (K Unit) Forecast, by Application 2019 & 2032
- Table 133: India Pneumatic Tools Market Revenue (Million) Forecast, by Application 2019 & 2032
- Table 134: India Pneumatic Tools Market Volume (K Unit) Forecast, by Application 2019 & 2032
- Table 135: Rest of Asia Pacific Pneumatic Tools Market Revenue (Million) Forecast, by Application 2019 & 2032
- Table 136: Rest of Asia Pacific Pneumatic Tools Market Volume (K Unit) Forecast, by Application 2019 & 2032
- Table 137: Global Pneumatic Tools Market Revenue Million Forecast, by Type of Equipment 2019 & 2032
- Table 138: Global Pneumatic Tools Market Volume K Unit Forecast, by Type of Equipment 2019 & 2032
- Table 139: Global Pneumatic Tools Market Revenue Million Forecast, by End-user Industry 2019 & 2032
- Table 140: Global Pneumatic Tools Market Volume K Unit Forecast, by End-user Industry 2019 & 2032
- Table 141: Global Pneumatic Tools Market Revenue Million Forecast, by Country 2019 & 2032
- Table 142: Global Pneumatic Tools Market Volume K Unit Forecast, by Country 2019 & 2032
- Table 143: Global Pneumatic Tools Market Revenue Million Forecast, by Type of Equipment 2019 & 2032
- Table 144: Global Pneumatic Tools Market Volume K Unit Forecast, by Type of Equipment 2019 & 2032
- Table 145: Global Pneumatic Tools Market Revenue Million Forecast, by End-user Industry 2019 & 2032
- Table 146: Global Pneumatic Tools Market Volume K Unit Forecast, by End-user Industry 2019 & 2032
- Table 147: Global Pneumatic Tools Market Revenue Million Forecast, by Country 2019 & 2032
- Table 148: Global Pneumatic Tools Market Volume K Unit Forecast, by Country 2019 & 2032
Frequently Asked Questions
1. What is the projected Compound Annual Growth Rate (CAGR) of the Pneumatic Tools Market?
The projected CAGR is approximately 7.00%.
2. Which companies are prominent players in the Pneumatic Tools Market?
Key companies in the market include Ingersoll Rand, ROSS Controls, Festo SE, SMC Corporation, Bimba Manufacturing Company (IMI PLC, Chicago Pneumatic, Emerson Electric Co, Siemens AG, Janatics, Koki Holdings Co Ltd, Parker Hannifin Corp, Eaton Corporation.
3. What are the main segments of the Pneumatic Tools Market?
The market segments include Type of Equipment, End-user Industry.
4. Can you provide details about the market size?
The market size is estimated to be USD 32.70 Million as of 2022.
5. What are some drivers contributing to market growth?
Increasing Automation Across Industries; Stringent Government Regulations.
6. What are the notable trends driving market growth?
Industrial End-user Segment to Hold Major Market Share.
7. Are there any restraints impacting market growth?
; Limited In-House Skillset to Manage Monitoring Solutions and Analyze Data; High Costs of Installation and Maintenance.
8. Can you provide examples of recent developments in the market?
December 2023: Researchers at the Shenzhen Institute of Advanced Technology (SIAT) of the Chinese Academy of Sciences (CAS) developed a reprogrammable bistable soft gripper for enhanced human-machine interaction. The soft gripper consists of a bistable frame and soft pneumatic bi-directional actuator linked by a nonstretchable cable. In the programming process, the pneumatic actuator shortened its longitudinal length to pull the frame through the cable, gradually accumulating the strain energies of the lateral plates and reducing the energy required for the fast snap-through of the structure.
9. What pricing options are available for accessing the report?
Pricing options include single-user, multi-user, and enterprise licenses priced at USD 4750, USD 5250, and USD 8750 respectively.
10. Is the market size provided in terms of value or volume?
The market size is provided in terms of value, measured in Million and volume, measured in K Unit.
11. Are there any specific market keywords associated with the report?
Yes, the market keyword associated with the report is "Pneumatic Tools Market," which aids in identifying and referencing the specific market segment covered.
12. How do I determine which pricing option suits my needs best?
The pricing options vary based on user requirements and access needs. Individual users may opt for single-user licenses, while businesses requiring broader access may choose multi-user or enterprise licenses for cost-effective access to the report.
13. Are there any additional resources or data provided in the Pneumatic Tools Market report?
While the report offers comprehensive insights, it's advisable to review the specific contents or supplementary materials provided to ascertain if additional resources or data are available.
14. How can I stay updated on further developments or reports in the Pneumatic Tools Market?
To stay informed about further developments, trends, and reports in the Pneumatic Tools Market, consider subscribing to industry newsletters, following relevant companies and organizations, or regularly checking reputable industry news sources and publications.
Methodology
Step 1 - Identification of Relevant Samples Size from Population Database


Step 2 - Approaches for Defining Global Market Size (Value, Volume* & Price*)

Note*: In applicable scenarios
Step 3 - Data Sources
Primary Research
- Web Analytics
- Survey Reports
- Research Institute
- Latest Research Reports
- Opinion Leaders
Secondary Research
- Annual Reports
- White Paper
- Latest Press Release
- Industry Association
- Paid Database
- Investor Presentations

Step 4 - Data Triangulation
Involves using different sources of information in order to increase the validity of a study
These sources are likely to be stakeholders in a program - participants, other researchers, program staff, other community members, and so on.
Then we put all data in single framework & apply various statistical tools to find out the dynamic on the market.
During the analysis stage, feedback from the stakeholder groups would be compared to determine areas of agreement as well as areas of divergence


