

Key Insights
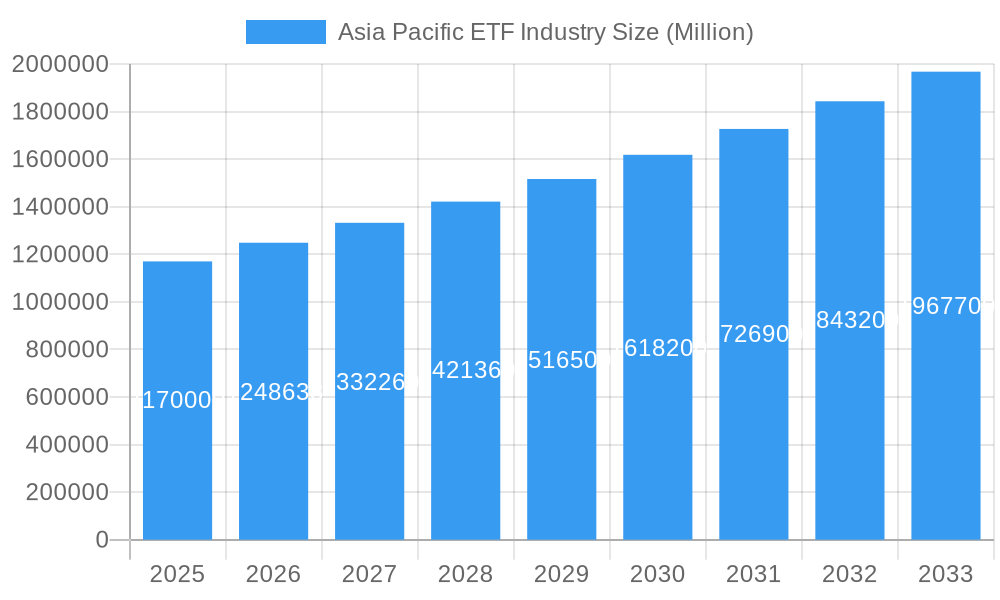
The Asia Pacific exchange-traded fund (ETF) industry is experiencing robust growth, projected to reach a market size of $1.17 trillion in 2025, exhibiting a Compound Annual Growth Rate (CAGR) of 6.59% from 2019 to 2033. This expansion is fueled by several key drivers. Increasing investor awareness of ETFs as a diversified and efficient investment vehicle, coupled with the region's burgeoning middle class and rising retail investor participation, are significantly contributing to market growth. Furthermore, favorable regulatory environments in several key Asia Pacific markets are facilitating ETF product innovation and accessibility. The increasing availability of thematic ETFs, catering to specific investment strategies and sectors such as technology and sustainable investments, is also driving demand. Competition among major players like BlackRock's iShares, Nikko Asset Management, and others is intensifying, fostering product innovation and driving down fees. While challenges such as market volatility and geopolitical uncertainties exist, the long-term outlook for the Asia Pacific ETF market remains positive, driven by sustained economic growth and increasing investor sophistication.
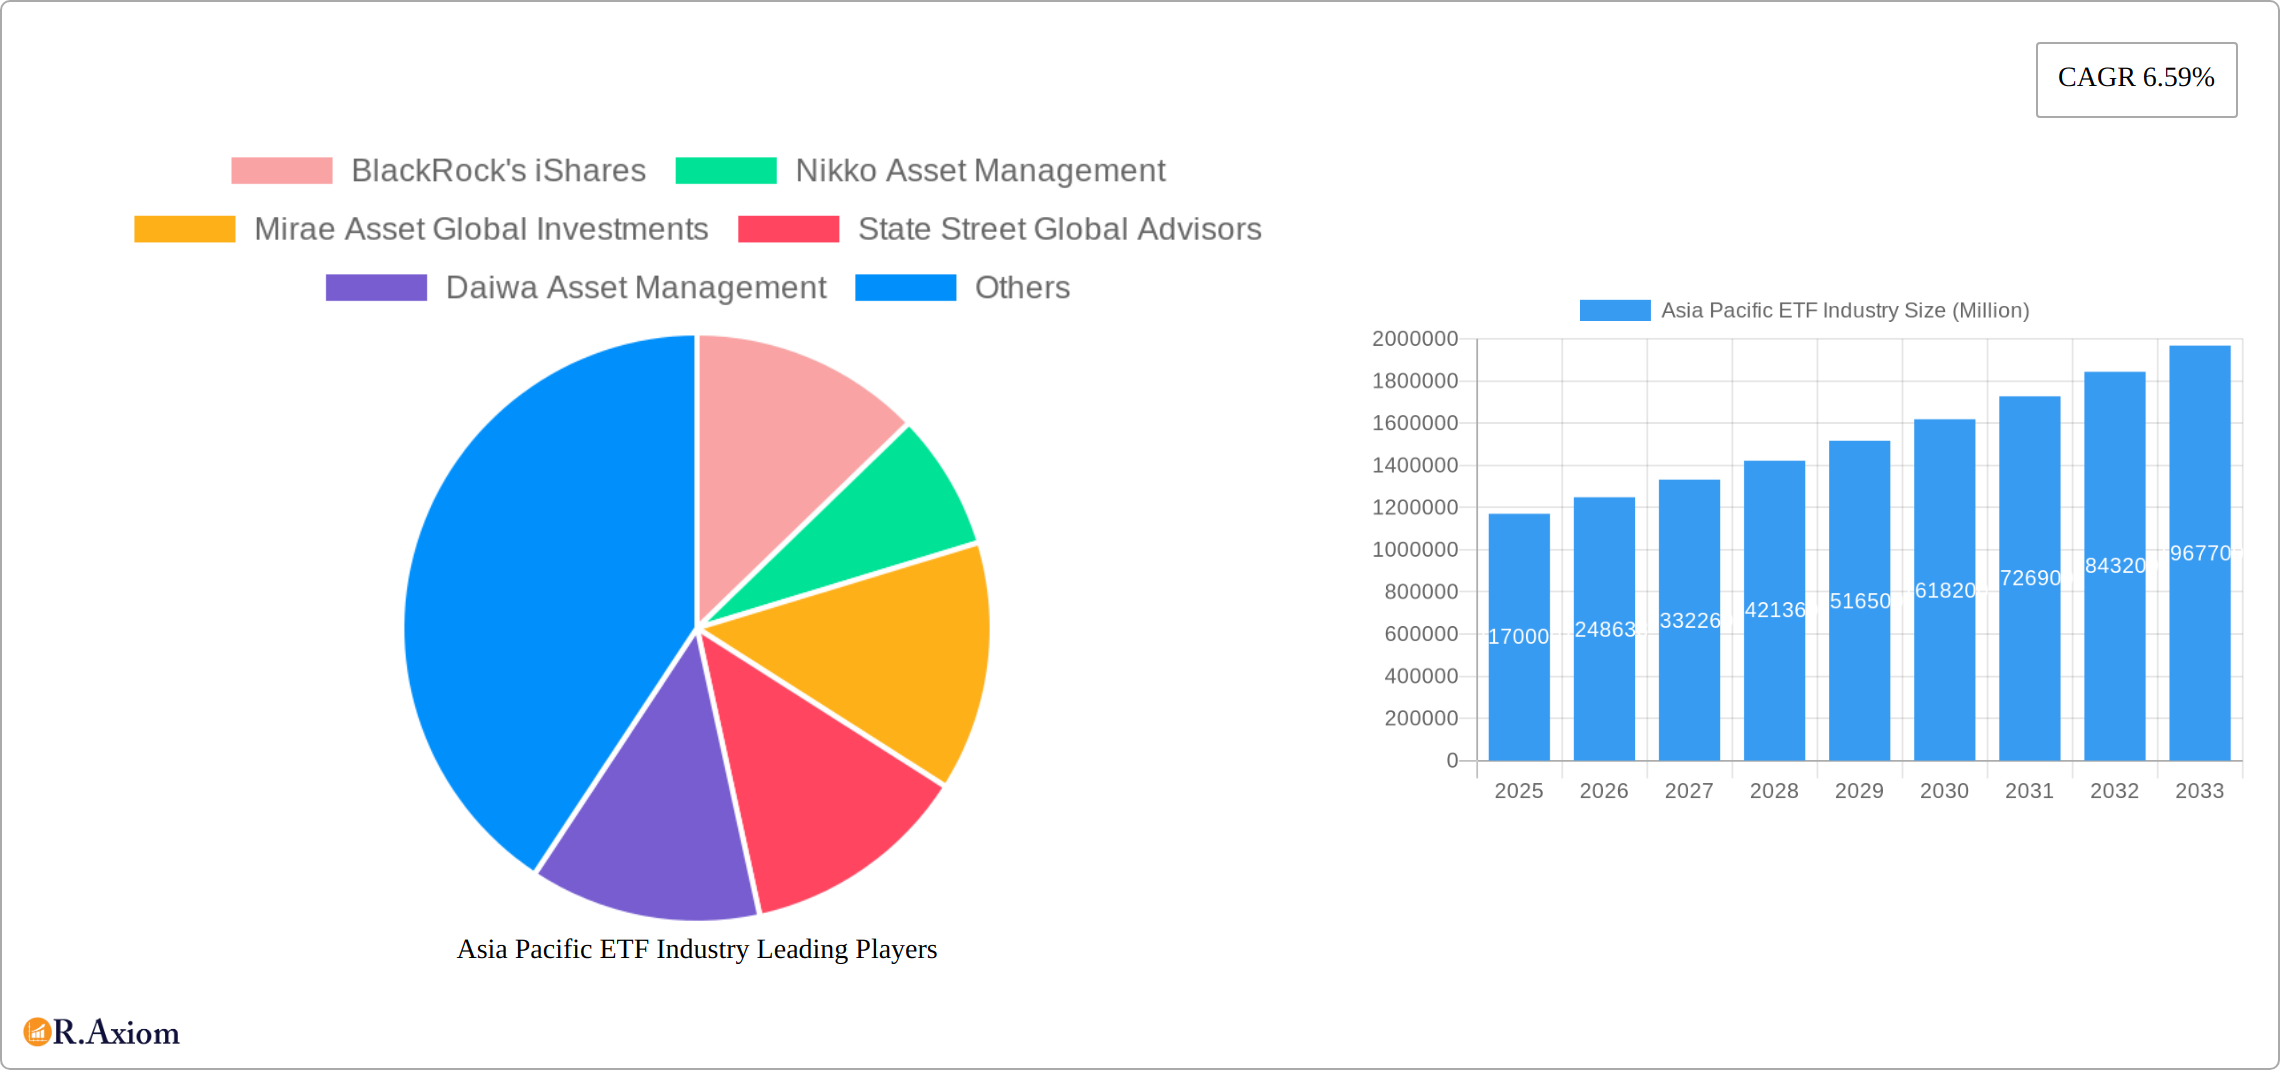
Asia Pacific ETF Industry Market Size (In Million)
The forecast period from 2025 to 2033 anticipates continued growth, albeit potentially with some fluctuation reflecting global economic conditions. We anticipate that the increasing adoption of digital platforms for trading and investment will further enhance the accessibility and popularity of ETFs. Specific regional variations in growth are expected, with faster expansion in countries experiencing rapid economic development and increased financial market maturity. While the current focus lies on established markets like Japan, South Korea, and Australia, significant opportunities exist in emerging markets across Southeast Asia. The ongoing expansion of ETF product offerings and the penetration into smaller markets will drive future growth, positioning the Asia Pacific ETF industry for sustained success in the coming decade. Major players are strategically investing in product development and market education to capture this significant growth potential.
Asia Pacific ETF Industry Company Market Share
This detailed report provides a comprehensive analysis of the Asia Pacific ETF industry, covering market trends, competitive landscape, growth drivers, and future outlook. The study period spans from 2019 to 2033, with 2025 as the base and estimated year. The report leverages extensive data and insightful analysis to provide actionable intelligence for industry stakeholders, investors, and strategic decision-makers.
Asia Pacific ETF Industry Market Concentration & Innovation
This section analyzes the market concentration, innovation drivers, regulatory frameworks, product substitutes, end-user trends, and M&A activities within the Asia Pacific ETF industry. The analysis covers the period 2019-2024, incorporating projections for 2025-2033.
The Asia Pacific ETF market exhibits a moderately concentrated structure, with a few dominant players commanding significant market share. BlackRock's iShares, for instance, holds a substantial portion, estimated at xx% in 2024. Other key players include Nikko Asset Management, Mirae Asset Global Investments, and State Street Global Advisors, each possessing a notable but smaller market share. This concentration is further influenced by the ongoing mergers and acquisitions (M&A) activity.
- Market Share: BlackRock’s iShares (xx%), Nikko Asset Management (xx%), Mirae Asset Global Investments (xx%), State Street Global Advisors (xx%), others (xx%).
- M&A Activity: The total value of M&A deals in the Asia Pacific ETF industry between 2019 and 2024 is estimated at $xx Million. These deals have largely focused on expanding product offerings and geographical reach.
- Innovation: Innovation is driven by the introduction of thematic ETFs, ESG-focused funds, and the increasing use of technology for trading and portfolio management. Regulatory frameworks, while generally supportive of ETF growth, vary across the region, potentially impacting innovation speed.
- Product Substitutes: Traditional mutual funds and other investment vehicles compete with ETFs, but ETFs are gaining traction due to their lower costs and transparency.
- End-User Trends: Increasing retail investor participation and institutional adoption are driving market growth.
Asia Pacific ETF Industry Industry Trends & Insights
The Asia Pacific ETF industry is experiencing a period of dynamic transformation, projected to achieve a Compound Annual Growth Rate (CAGR) of [Insert Updated CAGR]% from 2025 to 2033. This robust growth trajectory, leading to an estimated market penetration of [Insert Updated Market Penetration]% by 2033, is fueled by several interconnected factors. Rising investor awareness and sophistication, particularly amongst retail investors, is driving significant demand. This is further amplified by a diversification of product offerings, catering to a broader range of investment strategies and risk tolerances. Supportive regulatory environments in key markets are also facilitating industry expansion.
Technological advancements are acting as a catalyst for growth. Algorithmic trading and the increasing adoption of robo-advisors are streamlining investment processes and making ETFs more accessible to a wider investor base. A discernible shift in consumer preferences towards low-cost, diversified, and transparent investment vehicles further underscores the appeal of ETFs. While intense competition persists amongst established players, the emergence of new entrants is also injecting innovation and dynamism into the market. The incorporation of Environmental, Social, and Governance (ESG) factors into investment decisions is significantly boosting the growth of sustainable and responsible ETFs, aligning with evolving investor priorities. However, navigating market volatility, geopolitical uncertainty, and macroeconomic headwinds will remain critical considerations for sustained, long-term growth.
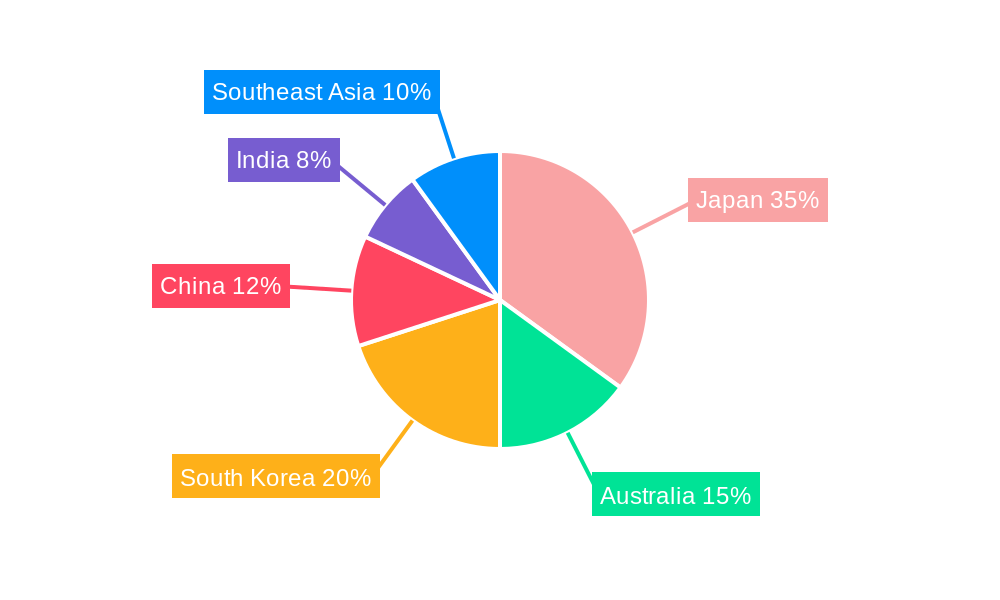
Dominant Markets & Segments in Asia Pacific ETF Industry
This section identifies the leading regions, countries, and segments within the Asia Pacific ETF industry. Japan, Australia, and South Korea are currently the most significant markets, but other markets like Hong Kong, Singapore, and India are showing rapid growth.
- Key Drivers of Dominance:
- Japan: Established equity markets, high investor sophistication, and a supportive regulatory environment.
- Australia: Strong regulatory framework, increasing retail investor participation, and favorable economic conditions.
- South Korea: Growing institutional investment, increasing domestic savings, and supportive government policies.
- China: Significant potential for growth, but subject to regulatory uncertainty and market volatility.
- Detailed Dominance Analysis: Japan's dominance is primarily due to its mature market and the presence of major asset management firms like Nomura Asset Management. Australia benefits from strong retail participation and the popularity of passive investment strategies. South Korea's growth is fueled by increasing domestic savings and the relatively high level of financial literacy amongst investors.
Asia Pacific ETF Industry Product Developments
Recent product innovations include the introduction of thematic ETFs focusing on specific sectors, such as technology and renewable energy, and ESG-focused ETFs. These products are designed to cater to the evolving preferences of investors and tap into emerging market opportunities. Competitive advantages are often gained through cost leadership, superior risk-adjusted returns, and innovative product features. Technological trends such as AI-powered portfolio construction and blockchain-based ETF trading are expected to further shape the industry. The increasing adoption of fractional shares and the proliferation of mobile investing platforms are also impacting the product landscape and ease of access for retail investors.
Report Scope & Segmentation Analysis
This report provides a comprehensive segmentation of the Asia Pacific ETF market, analyzing it across key dimensions: asset class (equity, fixed income, commodities, real estate, multi-asset, etc.), investment strategy (passive, active, smart beta), and investor type (retail, institutional, high-net-worth individuals). Growth projections are detailed for each segment, highlighting variations in market dynamics. While equity ETFs are expected to retain their market dominance, significant growth potential is identified within fixed income, thematic (e.g., technology, healthcare, sustainable energy), and factor-based ETFs. The report offers detailed market size estimations for each segment, accompanied by an analysis of competitive dynamics, including market share distribution and the intensity of competition within each segment.
Key Drivers of Asia Pacific ETF Industry Growth
Several key factors are driving the growth of the Asia Pacific ETF industry. These include:
- Technological Advancements: Improved trading platforms and access to financial information are enhancing investor participation.
- Economic Growth: Rising disposable incomes and increasing wealth accumulation are contributing to higher investment demand.
- Regulatory Support: Supportive regulatory frameworks are fostering the development and growth of the ETF market in several countries.
Challenges in the Asia Pacific ETF Industry Sector
The Asia Pacific ETF industry faces a complex interplay of challenges that require strategic navigation:
- Regulatory Landscape: Navigating the diverse and evolving regulatory frameworks across the Asia-Pacific region presents significant operational complexities and compliance burdens for ETF providers.
- Competitive Intensity: The market is characterized by intense competition, both amongst established global players and a rising number of regional and niche players. This necessitates continuous innovation and differentiation to maintain profitability and market share.
- Market Volatility and Geopolitical Risks: Geopolitical instability, macroeconomic uncertainties, and sudden shifts in investor sentiment can significantly impact ETF performance and investor confidence.
- Education and Awareness: Promoting greater understanding and awareness of ETFs amongst retail investors remains a key challenge, especially in emerging markets within the region.
Emerging Opportunities in Asia Pacific ETF Industry
Several emerging opportunities exist within the Asia Pacific ETF industry:
- Growth in Emerging Markets: Untapped potential in several emerging markets presents significant opportunities for expansion.
- Innovation in Product Offerings: The development of innovative ETF products, such as thematic and ESG-focused funds, can attract new investors and drive growth.
- Technological Disruption: Leveraging technology to enhance efficiency and reduce costs can provide competitive advantages.
Leading Players in the Asia Pacific ETF Industry Market
- BlackRock's iShares
- Nikko Asset Management
- Mirae Asset Global Investments
- State Street Global Advisors
- Daiwa Asset Management
- Mitsubishi UFJ Financial Group
- Samsung Asset Management
- Fortune SG Fund Management
- China Asset Management
- Nomura Asset Management Co Ltd
Key Developments in Asia Pacific ETF Industry Industry
- December 2022: Nikko Asset Management Co. Ltd launched a new ETF-listed index fund, US Equity (Dow Average), on the Tokyo Stock Exchange, notable for its unhedged currency exposure.
- May 2023: Nomura Investor Relations Co. Ltd and Nomura Securities Co. Ltd partnered with QUICK Corp. to operate a sponsored research company, potentially impacting market research and analysis availability.
Strategic Outlook for Asia Pacific ETF Industry Market
The Asia Pacific ETF industry is poised for sustained, albeit potentially volatile, growth. The long-term outlook remains positive, driven by the factors mentioned previously. Key opportunities lie in strategically expanding into underserved or emerging markets, developing innovative and specialized ETF products (including those focusing on specific sectors, factors, or ESG themes), and leveraging technological advancements to enhance operational efficiency, improve investor experience, and reduce costs. However, successfully navigating the challenges of regulatory complexities, market volatility, and intensifying competition will be paramount for sustained success. Strategic partnerships, mergers, and acquisitions will likely continue to shape the competitive landscape, with a focus on scaling operations, enhancing product offerings, and broadening distribution networks.
Asia Pacific ETF Industry Segmentation
-
1. Types of ETFs
- 1.1. Fixed Income ETFs
- 1.2. Equity ETFs
- 1.3. Commodity ETFs
- 1.4. Currency ETFs
- 1.5. Real Estate ETFs
- 1.6. Specialty ETFs
Asia Pacific ETF Industry Segmentation By Geography
-
1. Asia Pacific
- 1.1. China
- 1.2. Japan
- 1.3. South Korea
- 1.4. India
- 1.5. Australia
- 1.6. New Zealand
- 1.7. Indonesia
- 1.8. Malaysia
- 1.9. Singapore
- 1.10. Thailand
- 1.11. Vietnam
- 1.12. Philippines
Asia Pacific ETF Industry Regional Market Share
Geographic Coverage of Asia Pacific ETF Industry
Asia Pacific ETF Industry REPORT HIGHLIGHTS
| Aspects | Details |
|---|---|
| Study Period | 2020-2034 |
| Base Year | 2025 |
| Estimated Year | 2026 |
| Forecast Period | 2026-2034 |
| Historical Period | 2020-2025 |
| Growth Rate | CAGR of 6.59% from 2020-2034 |
| Segmentation |
|
Table of Contents
- 1. Introduction
- 1.1. Research Scope
- 1.2. Market Segmentation
- 1.3. Research Objective
- 1.4. Definitions and Assumptions
- 2. Executive Summary
- 2.1. Market Snapshot
- 3. Market Dynamics
- 3.1. Market Drivers
- 3.2. Market Restrains
- 3.3. Market Trends
- 3.4. Market Opportunities
- 4. Market Factor Analysis
- 4.1. Porters Five Forces
- 4.1.1. Bargaining Power of Suppliers
- 4.1.2. Bargaining Power of Buyers
- 4.1.3. Threat of New Entrants
- 4.1.4. Threat of Substitutes
- 4.1.5. Competitive Rivalry
- 4.2. PESTEL analysis
- 4.3. BCG Analysis
- 4.3.1. Stars (High Growth, High Market Share)
- 4.3.2. Cash Cows (Low Growth, High Market Share)
- 4.3.3. Question Mark (High Growth, Low Market Share)
- 4.3.4. Dogs (Low Growth, Low Market Share)
- 4.4. Ansoff Matrix Analysis
- 4.5. Supply Chain Analysis
- 4.6. Regulatory Landscape
- 4.7. Current Market Potential and Opportunity Assessment (TAM–SAM–SOM Framework)
- 4.8. RAX Analyst Note
- 4.1. Porters Five Forces
- 5. Market Analysis, Insights and Forecast 2021-2033
- 5.1. Market Analysis, Insights and Forecast - by Types of ETFs
- 5.1.1. Fixed Income ETFs
- 5.1.2. Equity ETFs
- 5.1.3. Commodity ETFs
- 5.1.4. Currency ETFs
- 5.1.5. Real Estate ETFs
- 5.1.6. Specialty ETFs
- 5.2. Market Analysis, Insights and Forecast - by Region
- 5.2.1. Asia Pacific
- 5.1. Market Analysis, Insights and Forecast - by Types of ETFs
- 6. Asia Pacific ETF Industry Analysis, Insights and Forecast, 2021-2033
- 6.1. Market Analysis, Insights and Forecast - by Types of ETFs
- 6.1.1. Fixed Income ETFs
- 6.1.2. Equity ETFs
- 6.1.3. Commodity ETFs
- 6.1.4. Currency ETFs
- 6.1.5. Real Estate ETFs
- 6.1.6. Specialty ETFs
- 6.1. Market Analysis, Insights and Forecast - by Types of ETFs
- 7. Competitive Analysis
- 7.1. Company Profiles
- 7.1.1 BlackRock's iShares
- 7.1.1.1. Company Overview
- 7.1.1.2. Products
- 7.1.1.3. Company Financials
- 7.1.1.4. SWOT Analysis
- 7.1.2 Nikko Asset Management
- 7.1.2.1. Company Overview
- 7.1.2.2. Products
- 7.1.2.3. Company Financials
- 7.1.2.4. SWOT Analysis
- 7.1.3 Mirae Asset Global Investments
- 7.1.3.1. Company Overview
- 7.1.3.2. Products
- 7.1.3.3. Company Financials
- 7.1.3.4. SWOT Analysis
- 7.1.4 State Street Global Advisors
- 7.1.4.1. Company Overview
- 7.1.4.2. Products
- 7.1.4.3. Company Financials
- 7.1.4.4. SWOT Analysis
- 7.1.5 Daiwa Asset Management
- 7.1.5.1. Company Overview
- 7.1.5.2. Products
- 7.1.5.3. Company Financials
- 7.1.5.4. SWOT Analysis
- 7.1.6 Mitsubishi UFJ Financial Group
- 7.1.6.1. Company Overview
- 7.1.6.2. Products
- 7.1.6.3. Company Financials
- 7.1.6.4. SWOT Analysis
- 7.1.7 Samsung Asset Management
- 7.1.7.1. Company Overview
- 7.1.7.2. Products
- 7.1.7.3. Company Financials
- 7.1.7.4. SWOT Analysis
- 7.1.8 Fortune SG Fund Management
- 7.1.8.1. Company Overview
- 7.1.8.2. Products
- 7.1.8.3. Company Financials
- 7.1.8.4. SWOT Analysis
- 7.1.9 China Asset Management
- 7.1.9.1. Company Overview
- 7.1.9.2. Products
- 7.1.9.3. Company Financials
- 7.1.9.4. SWOT Analysis
- 7.1.10 Nomura Asset Management Co Ltd**List Not Exhaustive
- 7.1.10.1. Company Overview
- 7.1.10.2. Products
- 7.1.10.3. Company Financials
- 7.1.10.4. SWOT Analysis
- 7.1.1 BlackRock's iShares
- 7.2. Market Entropy
- 7.2.1 Company's Key Areas Served
- 7.2.2 Recent Developments
- 7.3. Company Market Share Analysis 2025
- 7.3.1 Top 5 Companies Market Share Analysis
- 7.3.2 Top 3 Companies Market Share Analysis
- 7.4. List of Potential Customers
- 8. Research Methodology
List of Figures
- Figure 1: Asia Pacific ETF Industry Revenue Breakdown (Million, %) by Product 2025 & 2033
- Figure 2: Asia Pacific ETF Industry Share (%) by Company 2025
List of Tables
- Table 1: Asia Pacific ETF Industry Revenue Million Forecast, by Types of ETFs 2020 & 2033
- Table 2: Asia Pacific ETF Industry Volume Trillion Forecast, by Types of ETFs 2020 & 2033
- Table 3: Asia Pacific ETF Industry Revenue Million Forecast, by Region 2020 & 2033
- Table 4: Asia Pacific ETF Industry Volume Trillion Forecast, by Region 2020 & 2033
- Table 5: Asia Pacific ETF Industry Revenue Million Forecast, by Types of ETFs 2020 & 2033
- Table 6: Asia Pacific ETF Industry Volume Trillion Forecast, by Types of ETFs 2020 & 2033
- Table 7: Asia Pacific ETF Industry Revenue Million Forecast, by Country 2020 & 2033
- Table 8: Asia Pacific ETF Industry Volume Trillion Forecast, by Country 2020 & 2033
- Table 9: China Asia Pacific ETF Industry Revenue (Million) Forecast, by Application 2020 & 2033
- Table 10: China Asia Pacific ETF Industry Volume (Trillion) Forecast, by Application 2020 & 2033
- Table 11: Japan Asia Pacific ETF Industry Revenue (Million) Forecast, by Application 2020 & 2033
- Table 12: Japan Asia Pacific ETF Industry Volume (Trillion) Forecast, by Application 2020 & 2033
- Table 13: South Korea Asia Pacific ETF Industry Revenue (Million) Forecast, by Application 2020 & 2033
- Table 14: South Korea Asia Pacific ETF Industry Volume (Trillion) Forecast, by Application 2020 & 2033
- Table 15: India Asia Pacific ETF Industry Revenue (Million) Forecast, by Application 2020 & 2033
- Table 16: India Asia Pacific ETF Industry Volume (Trillion) Forecast, by Application 2020 & 2033
- Table 17: Australia Asia Pacific ETF Industry Revenue (Million) Forecast, by Application 2020 & 2033
- Table 18: Australia Asia Pacific ETF Industry Volume (Trillion) Forecast, by Application 2020 & 2033
- Table 19: New Zealand Asia Pacific ETF Industry Revenue (Million) Forecast, by Application 2020 & 2033
- Table 20: New Zealand Asia Pacific ETF Industry Volume (Trillion) Forecast, by Application 2020 & 2033
- Table 21: Indonesia Asia Pacific ETF Industry Revenue (Million) Forecast, by Application 2020 & 2033
- Table 22: Indonesia Asia Pacific ETF Industry Volume (Trillion) Forecast, by Application 2020 & 2033
- Table 23: Malaysia Asia Pacific ETF Industry Revenue (Million) Forecast, by Application 2020 & 2033
- Table 24: Malaysia Asia Pacific ETF Industry Volume (Trillion) Forecast, by Application 2020 & 2033
- Table 25: Singapore Asia Pacific ETF Industry Revenue (Million) Forecast, by Application 2020 & 2033
- Table 26: Singapore Asia Pacific ETF Industry Volume (Trillion) Forecast, by Application 2020 & 2033
- Table 27: Thailand Asia Pacific ETF Industry Revenue (Million) Forecast, by Application 2020 & 2033
- Table 28: Thailand Asia Pacific ETF Industry Volume (Trillion) Forecast, by Application 2020 & 2033
- Table 29: Vietnam Asia Pacific ETF Industry Revenue (Million) Forecast, by Application 2020 & 2033
- Table 30: Vietnam Asia Pacific ETF Industry Volume (Trillion) Forecast, by Application 2020 & 2033
- Table 31: Philippines Asia Pacific ETF Industry Revenue (Million) Forecast, by Application 2020 & 2033
- Table 32: Philippines Asia Pacific ETF Industry Volume (Trillion) Forecast, by Application 2020 & 2033
Frequently Asked Questions
1. What is the projected Compound Annual Growth Rate (CAGR) of the Asia Pacific ETF Industry?
The projected CAGR is approximately 6.59%.
2. Which companies are prominent players in the Asia Pacific ETF Industry?
Key companies in the market include BlackRock's iShares, Nikko Asset Management, Mirae Asset Global Investments, State Street Global Advisors, Daiwa Asset Management, Mitsubishi UFJ Financial Group, Samsung Asset Management, Fortune SG Fund Management, China Asset Management, Nomura Asset Management Co Ltd**List Not Exhaustive.
3. What are the main segments of the Asia Pacific ETF Industry?
The market segments include Types of ETFs.
4. Can you provide details about the market size?
The market size is estimated to be USD 1.17 Million as of 2022.
5. What are some drivers contributing to market growth?
Accessible Investment Platforms; Growing Culture of Financial Investment.
6. What are the notable trends driving market growth?
Equity ETFs Dominate the ETF Market.
7. Are there any restraints impacting market growth?
Accessible Investment Platforms; Growing Culture of Financial Investment.
8. Can you provide examples of recent developments in the market?
May 2023: Nomura Investor Relations Co. Ltd ("Nomura IR") and Nomura Securities Co. Ltd ("Nomura Securities") partnered with QUICK Corp. to run a sponsored research company.
9. What pricing options are available for accessing the report?
Pricing options include single-user, multi-user, and enterprise licenses priced at USD 4750, USD 4950, and USD 6800 respectively.
10. Is the market size provided in terms of value or volume?
The market size is provided in terms of value, measured in Million and volume, measured in Trillion.
11. Are there any specific market keywords associated with the report?
Yes, the market keyword associated with the report is "Asia Pacific ETF Industry," which aids in identifying and referencing the specific market segment covered.
12. How do I determine which pricing option suits my needs best?
The pricing options vary based on user requirements and access needs. Individual users may opt for single-user licenses, while businesses requiring broader access may choose multi-user or enterprise licenses for cost-effective access to the report.
13. Are there any additional resources or data provided in the Asia Pacific ETF Industry report?
While the report offers comprehensive insights, it's advisable to review the specific contents or supplementary materials provided to ascertain if additional resources or data are available.
14. How can I stay updated on further developments or reports in the Asia Pacific ETF Industry?
To stay informed about further developments, trends, and reports in the Asia Pacific ETF Industry, consider subscribing to industry newsletters, following relevant companies and organizations, or regularly checking reputable industry news sources and publications.
Methodology
Step 1 - Identification of Relevant Samples Size from Population Database


Step 2 - Approaches for Defining Global Market Size (Value, Volume* & Price*)

Note*: In applicable scenarios
Step 3 - Data Sources
Primary Research
- Web Analytics
- Survey Reports
- Research Institute
- Latest Research Reports
- Opinion Leaders
Secondary Research
- Annual Reports
- White Paper
- Latest Press Release
- Industry Association
- Paid Database
- Investor Presentations

Step 4 - Data Triangulation
Involves using different sources of information in order to increase the validity of a study
These sources are likely to be stakeholders in a program - participants, other researchers, program staff, other community members, and so on.
Then we put all data in single framework & apply various statistical tools to find out the dynamic on the market.
During the analysis stage, feedback from the stakeholder groups would be compared to determine areas of agreement as well as areas of divergence