

Key Insights
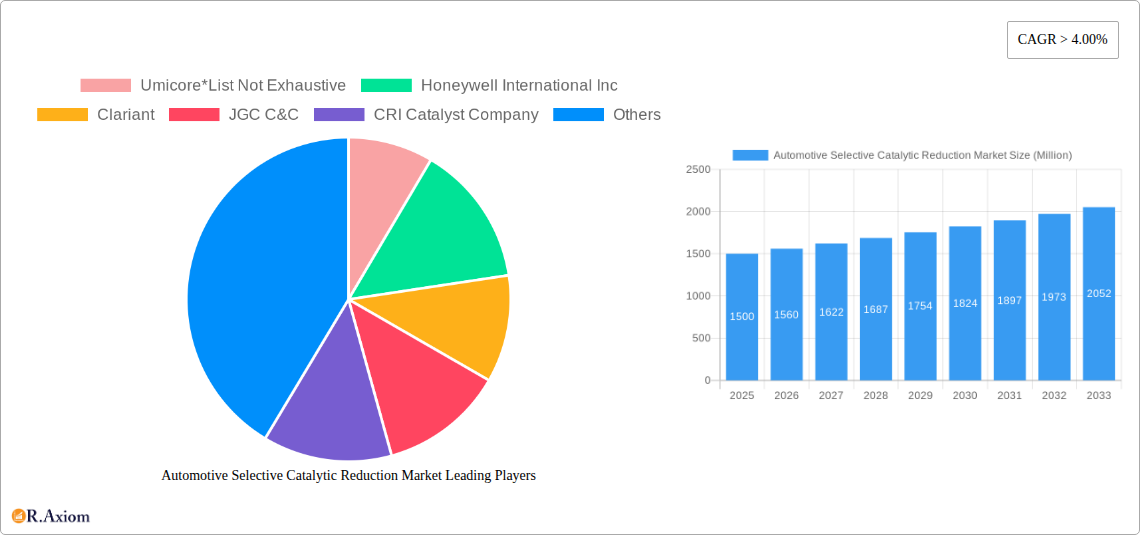
The global Automotive Selective Catalytic Reduction (SCR) market is poised for significant expansion, propelled by increasingly stringent worldwide emission regulations, particularly targeting nitrogen oxide (NOx) emissions from diesel vehicles. The market, valued at $13.22 billion in 2025, is projected to grow at a Compound Annual Growth Rate (CAGR) of 11.8% from 2025 to 2033. This upward trend is driven by the widespread integration of SCR technology in both light-duty and heavy-duty vehicles to comply with evolving emission standards, such as Euro 7 and comparable international mandates. Key market segments encompass SCR systems for diverse vehicle types and catalyst configurations, including honeycomb, plate, and corrugated designs. Honeycomb catalysts currently dominate due to their proven efficiency and economic viability. The Asia-Pacific region, bolstered by robust automotive manufacturing in China and India, is anticipated to lead market growth, followed by North America and Europe. Nevertheless, significant initial investment for SCR systems and the potential for ammonia slip present ongoing challenges to market penetration.
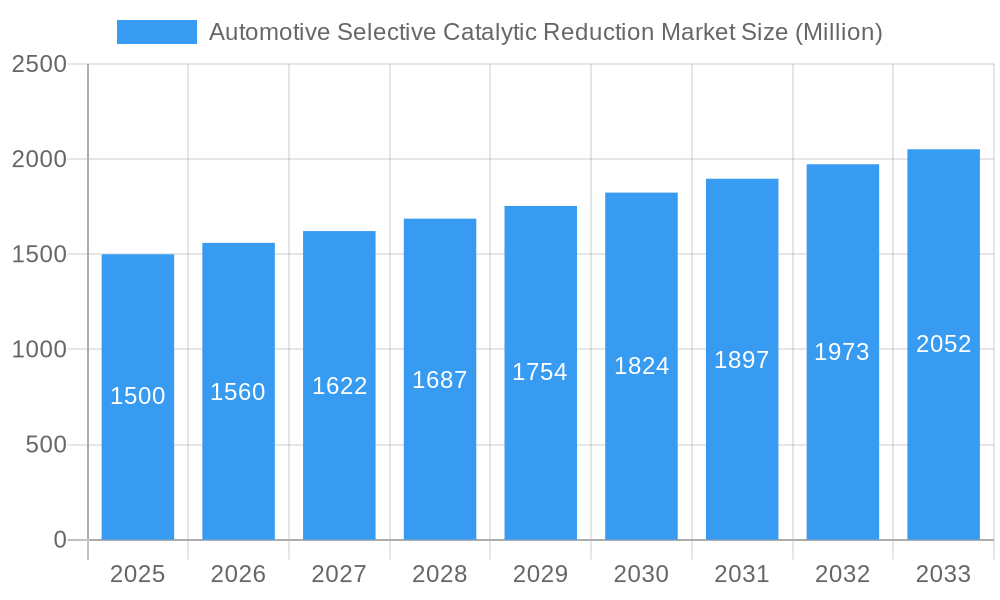
Automotive Selective Catalytic Reduction Market Market Size (In Billion)
Continued market development will be facilitated by technological innovations focused on enhancing SCR efficiency, minimizing ammonia slip, and optimizing urea utilization as a reductant. The introduction of more durable, cost-effective catalysts and advanced urea dosing systems is essential for broader market adoption. Intense competition among leading manufacturers, including Umicore, Honeywell International Inc., and Clariant, is driving a focus on innovation, strategic alliances, and global expansion to secure market leadership. The long-term prognosis for the automotive SCR market remains highly favorable, underpinned by persistent environmental mandates and ongoing advancements in SCR technology designed to overcome current limitations and improve performance across a wide array of vehicle applications.
Automotive Selective Catalytic Reduction Market Company Market Share
Automotive Selective Catalytic Reduction Market: A Comprehensive Analysis (2019-2033)
This comprehensive report provides an in-depth analysis of the Automotive Selective Catalytic Reduction (SCR) market, offering invaluable insights for stakeholders across the automotive, chemical, and energy sectors. Covering the period from 2019 to 2033, with 2025 as the base year, this report meticulously examines market trends, competitive dynamics, and future growth prospects. The report leverages rigorous research methodologies and data analysis to deliver actionable intelligence for strategic decision-making.
Automotive Selective Catalytic Reduction Market Concentration & Innovation
The Automotive SCR market exhibits a moderately consolidated structure, with a few dominant players holding significant market share. Umicore, Honeywell International Inc, Clariant, and Johnson Matthey are some of the key players shaping the market landscape. Market share data for 2025 suggests Umicore holds approximately xx% market share, followed by Honeywell International Inc at xx%, and Clariant at xx%. The remaining market share is distributed amongst other players, indicating a competitive yet concentrated market.
Innovation in the SCR market is driven by stringent emission regulations globally, pushing manufacturers to develop more efficient and durable catalysts. Significant R&D investments are focused on enhancing catalyst performance, reducing production costs, and extending catalyst lifespan. Mergers and acquisitions (M&A) play a crucial role in market consolidation and technological advancement. Recent M&A activities, while not publicly disclosed in full detail, involved a total deal value of approximately $xx Million in 2024. These activities often involve the acquisition of smaller technology companies with specialized expertise or patents.
Key Innovation Drivers:
- Stringent emission regulations (e.g., Euro VII, EPA standards)
- Demand for improved fuel efficiency
- Need for longer-lasting and more cost-effective catalysts
- Technological advancements in catalyst design and materials
Regulatory Frameworks: Stricter emission norms are the primary driver of market growth, continuously pushing the demand for high-performance SCR systems. Variations in regulations across geographies influence market dynamics significantly.
Product Substitutes: While SCR is currently the dominant technology, alternative technologies are being explored, but none yet pose a significant threat to its market dominance in the near future.
End-User Trends: The increasing adoption of SCR systems in heavy-duty vehicles and commercial fleets is a key growth driver.
Automotive Selective Catalytic Reduction Market Industry Trends & Insights
The Automotive SCR market is experiencing robust growth, driven by increasingly stringent emission regulations worldwide and the rising demand for cleaner transportation. The global market is projected to reach $xx Million by 2033, exhibiting a CAGR of xx% during the forecast period (2025-2033). Market penetration has increased significantly, particularly in developed nations, where emission standards are stringent. The market penetration in emerging economies is also expected to grow at a significant pace due to expanding vehicle sales and increased regulatory focus on emission control. However, the fluctuating prices of raw materials used in catalyst manufacturing pose a challenge and can affect overall market growth. Technological advancements in catalyst design are leading to increased efficiency and reduced costs, which also boosts market expansion. Consumer preferences are shifting toward eco-friendly vehicles, further accelerating the adoption of SCR technology. Competitive dynamics are characterized by intense rivalry among established players, who are focusing on strategic partnerships, R&D investments, and geographical expansion to secure their market positions.
Dominant Markets & Segments in Automotive Selective Catalytic Reduction Market
The Selective Catalytic Reduction (SCR) process type dominates the market due to its high efficiency in reducing NOx emissions. Within applications, the power generation (excluding coal-based) segment holds a leading position driven by stringent regulations and rising environmental concerns within that sector. Geographically, [Leading Region/Country - e.g., Europe/Germany] demonstrates significant market dominance due to its stringent emission norms and substantial automotive manufacturing base.
Key Drivers of Dominance:
- Europe/Germany (Example): Stringent emission standards, high vehicle production, strong regulatory support, and well-established automotive supply chains.
- SCR Process Type: Superior NOx reduction efficiency compared to other technologies.
- Power Generation (excluding coal-based): Growing demand for cleaner energy and stricter emission controls.
Regional Analysis: Growth in Asia-Pacific will be noteworthy due to increasing vehicle ownership and governmental initiatives. North America will show steady growth.
Segment-Specific Analysis: The honeycomb catalyst segment holds the largest market share in catalyst type due to its high surface area and efficiency. However, other catalyst types are continuously being improved, and the market share may shift slightly in the future.
Automotive Selective Catalytic Reduction Market Product Developments
Recent product innovations focus on enhancing catalyst durability, improving NOx conversion efficiency under various operating conditions, and reducing the use of precious metals. These advancements translate to extended catalyst lifespan, lower operating costs, and enhanced environmental benefits. Companies are concentrating on developing catalysts that can withstand higher temperatures and broader operating ranges, making them suitable for a wider range of vehicles and applications. The emphasis on improved cold-start performance is another critical trend in the market. Market fit is determined by the ability of new products to meet tightening regulatory demands, offer better performance, and improve cost-effectiveness.
Report Scope & Segmentation Analysis
This report segments the Automotive SCR market across several key parameters:
Process Type: Selective Catalytic Reduction (SCR), Non-selective Catalytic Reduction (NSCR), Diesel Particulate Filters (DPF), Catalytic Oxidation (CO). SCR dominates, followed by DPF. NSCR and CO hold comparatively smaller market shares. Growth projections are highest for SCR and DPF.
Application: Power Generation (Excluding Coal based), Coal-based Thermal Power Generation, Industrial. Power Generation (excluding coal-based) shows the largest market share.
Catalyst Type: Honeycomb Catalyst, Plate Catalyst, Corrugated Catalyst. Honeycomb catalysts dominate due to their high surface area to volume ratio.
Competitive dynamics within each segment vary depending on the technological maturity and the degree of market concentration.
Key Drivers of Automotive Selective Catalytic Reduction Market Growth
The Automotive SCR market's growth is primarily driven by increasingly stringent global emission regulations aimed at reducing harmful NOx emissions from vehicles. The rising adoption of SCR systems in heavy-duty vehicles and commercial fleets, coupled with technological advancements leading to improved catalyst efficiency and reduced costs, further fuels market expansion. Government incentives and subsidies promoting cleaner transportation also play a crucial role. Furthermore, increasing environmental awareness among consumers is driving the demand for eco-friendly vehicles equipped with effective emission control systems.
Challenges in the Automotive Selective Catalytic Reduction Market Sector
The Automotive SCR market faces challenges including the fluctuating prices of precious metals used in catalyst manufacturing, which impacts production costs and profitability. Supply chain disruptions, particularly concerning the availability of rare earth elements, pose a significant risk. The intense competition among established players necessitates continuous innovation and cost optimization to maintain a competitive edge. Stringent regulatory compliance requirements can also add complexity to the manufacturing process and increase operational costs. The market also faces challenges related to the effective implementation and enforcement of emission standards in different regions and the need to develop catalysts optimized for diverse operating conditions.
Emerging Opportunities in Automotive Selective Catalytic Reduction Market
Emerging opportunities include the expansion of the SCR market in developing economies with growing vehicle ownership and rising emission control mandates. Technological advancements, such as the development of more efficient and cost-effective catalysts employing alternative materials, present significant opportunities. The increasing focus on hybrid and electric vehicles could lead to newer applications for SCR technology in different powertrain configurations. Furthermore, opportunities exist in the development of integrated emission control systems combining SCR with other technologies to achieve optimal emission reduction.
Leading Players in the Automotive Selective Catalytic Reduction Market Market
- Umicore
- Honeywell International Inc
- Clariant
- JGC C&C
- CRI Catalyst Company
- DCL International Inc
- CDTi Advanced Materials Inc
- Hitachi Zosen Corporation
- CORMETECH
- BASF SE
- Cataler Corporation
- Johnson Matthey
- IBIDEN Porzellanfabrik Frauenthal
- Corning Incorporated
Key Developments in Automotive Selective Catalytic Reduction Market Industry
- January 2024: Umicore announces the launch of a new generation of SCR catalysts with enhanced durability and efficiency.
- March 2024: Honeywell International Inc. secures a major contract to supply SCR systems for a leading commercial vehicle manufacturer.
- June 2024: Clariant invests in expanding its manufacturing capacity for SCR catalysts to meet growing demand.
- (Add further examples as available)
Strategic Outlook for Automotive Selective Catalytic Reduction Market Market
The Automotive SCR market is poised for continued growth driven by increasingly stringent emission regulations, technological advancements, and rising consumer demand for cleaner transportation. Future opportunities lie in the development of advanced catalysts with improved performance and reduced environmental impact. Expansion into new markets, particularly in developing economies, and strategic partnerships to leverage technological expertise will be crucial for success. The focus will remain on enhancing efficiency, durability, and cost-effectiveness while meeting evolving regulatory requirements. The market’s future trajectory hinges on the successful navigation of challenges related to raw material costs, supply chain disruptions, and intensifying competition.
Automotive Selective Catalytic Reduction Market Segmentation
-
1. Catalyst Type
- 1.1. Honeycomb Catalyst
- 1.2. Plate Catalyst
- 1.3. Corrugated Catalyst
-
2. Process Type
- 2.1. Selective Catalytic Reduction
- 2.2. Non-selective Catalytic Reduction
- 2.3. Diesel Particulate Filters
- 2.4. Catalytic Oxidation
-
3. Application
- 3.1. Power Generation (Excluding Coal based)
- 3.2. Coal-based Thermal Power Generation
- 3.3. Industrial
Automotive Selective Catalytic Reduction Market Segmentation By Geography
-
1. Asia Pacific
- 1.1. China
- 1.2. India
- 1.3. Japan
- 1.4. South Korea
- 1.5. ASEAN Countries
- 1.6. Rest of Asia Pacific
-
2. North America
- 2.1. United States
- 2.2. Canada
- 2.3. Mexico
-
3. Europe
- 3.1. Germany
- 3.2. United Kingdom
- 3.3. Italy
- 3.4. Russia
- 3.5. Rest of the Europe
-
4. South America
- 4.1. Brazil
- 4.2. Argentina
- 4.3. Rest of South America
-
5. Middle East and Africa
- 5.1. Saudi Arabia
- 5.2. South Africa
- 5.3. Rest of Middle East and Africa
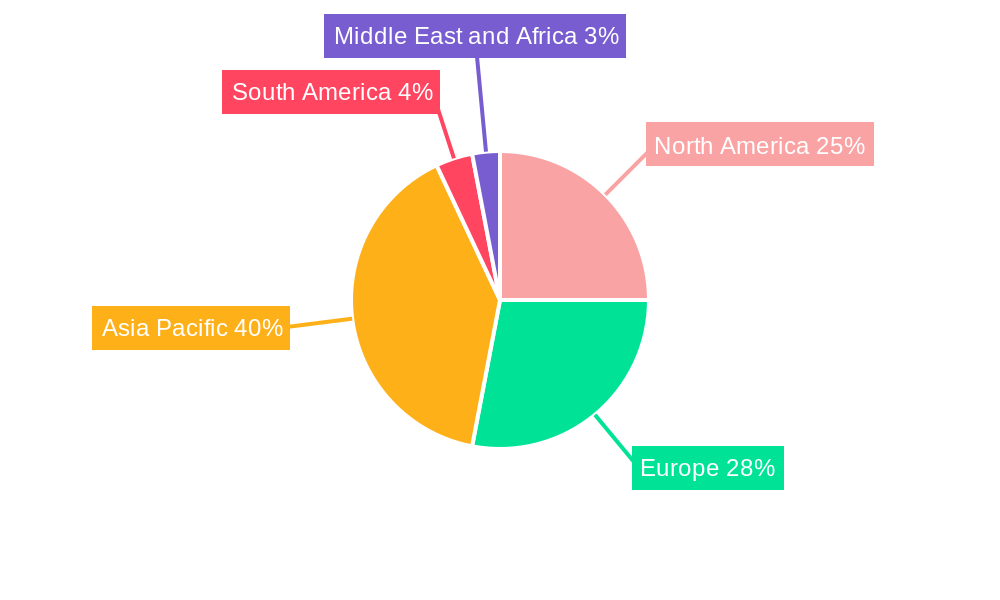
Automotive Selective Catalytic Reduction Market Regional Market Share
Geographic Coverage of Automotive Selective Catalytic Reduction Market
Automotive Selective Catalytic Reduction Market REPORT HIGHLIGHTS
| Aspects | Details |
|---|---|
| Study Period | 2020-2034 |
| Base Year | 2025 |
| Estimated Year | 2026 |
| Forecast Period | 2026-2034 |
| Historical Period | 2020-2025 |
| Growth Rate | CAGR of 11.8% from 2020-2034 |
| Segmentation |
|
Table of Contents
- 1. Introduction
- 1.1. Research Scope
- 1.2. Market Segmentation
- 1.3. Research Objective
- 1.4. Definitions and Assumptions
- 2. Executive Summary
- 2.1. Market Snapshot
- 3. Market Dynamics
- 3.1. Market Drivers
- 3.2. Market Restrains
- 3.3. Market Trends
- 3.4. Market Opportunities
- 4. Market Factor Analysis
- 4.1. Porters Five Forces
- 4.1.1. Bargaining Power of Suppliers
- 4.1.2. Bargaining Power of Buyers
- 4.1.3. Threat of New Entrants
- 4.1.4. Threat of Substitutes
- 4.1.5. Competitive Rivalry
- 4.2. PESTEL analysis
- 4.3. BCG Analysis
- 4.3.1. Stars (High Growth, High Market Share)
- 4.3.2. Cash Cows (Low Growth, High Market Share)
- 4.3.3. Question Mark (High Growth, Low Market Share)
- 4.3.4. Dogs (Low Growth, Low Market Share)
- 4.4. Ansoff Matrix Analysis
- 4.5. Supply Chain Analysis
- 4.6. Regulatory Landscape
- 4.7. Current Market Potential and Opportunity Assessment (TAM–SAM–SOM Framework)
- 4.8. RAX Analyst Note
- 4.1. Porters Five Forces
- 5. Market Analysis, Insights and Forecast 2021-2033
- 5.1. Market Analysis, Insights and Forecast - by Catalyst Type
- 5.1.1. Honeycomb Catalyst
- 5.1.2. Plate Catalyst
- 5.1.3. Corrugated Catalyst
- 5.2. Market Analysis, Insights and Forecast - by Process Type
- 5.2.1. Selective Catalytic Reduction
- 5.2.2. Non-selective Catalytic Reduction
- 5.2.3. Diesel Particulate Filters
- 5.2.4. Catalytic Oxidation
- 5.3. Market Analysis, Insights and Forecast - by Application
- 5.3.1. Power Generation (Excluding Coal based)
- 5.3.2. Coal-based Thermal Power Generation
- 5.3.3. Industrial
- 5.4. Market Analysis, Insights and Forecast - by Region
- 5.4.1. Asia Pacific
- 5.4.2. North America
- 5.4.3. Europe
- 5.4.4. South America
- 5.4.5. Middle East and Africa
- 5.1. Market Analysis, Insights and Forecast - by Catalyst Type
- 6. Global Automotive Selective Catalytic Reduction Market Analysis, Insights and Forecast, 2021-2033
- 6.1. Market Analysis, Insights and Forecast - by Catalyst Type
- 6.1.1. Honeycomb Catalyst
- 6.1.2. Plate Catalyst
- 6.1.3. Corrugated Catalyst
- 6.2. Market Analysis, Insights and Forecast - by Process Type
- 6.2.1. Selective Catalytic Reduction
- 6.2.2. Non-selective Catalytic Reduction
- 6.2.3. Diesel Particulate Filters
- 6.2.4. Catalytic Oxidation
- 6.3. Market Analysis, Insights and Forecast - by Application
- 6.3.1. Power Generation (Excluding Coal based)
- 6.3.2. Coal-based Thermal Power Generation
- 6.3.3. Industrial
- 6.1. Market Analysis, Insights and Forecast - by Catalyst Type
- 7. Asia Pacific Automotive Selective Catalytic Reduction Market Analysis, Insights and Forecast, 2020-2032
- 7.1. Market Analysis, Insights and Forecast - by Catalyst Type
- 7.1.1. Honeycomb Catalyst
- 7.1.2. Plate Catalyst
- 7.1.3. Corrugated Catalyst
- 7.2. Market Analysis, Insights and Forecast - by Process Type
- 7.2.1. Selective Catalytic Reduction
- 7.2.2. Non-selective Catalytic Reduction
- 7.2.3. Diesel Particulate Filters
- 7.2.4. Catalytic Oxidation
- 7.3. Market Analysis, Insights and Forecast - by Application
- 7.3.1. Power Generation (Excluding Coal based)
- 7.3.2. Coal-based Thermal Power Generation
- 7.3.3. Industrial
- 7.1. Market Analysis, Insights and Forecast - by Catalyst Type
- 8. North America Automotive Selective Catalytic Reduction Market Analysis, Insights and Forecast, 2020-2032
- 8.1. Market Analysis, Insights and Forecast - by Catalyst Type
- 8.1.1. Honeycomb Catalyst
- 8.1.2. Plate Catalyst
- 8.1.3. Corrugated Catalyst
- 8.2. Market Analysis, Insights and Forecast - by Process Type
- 8.2.1. Selective Catalytic Reduction
- 8.2.2. Non-selective Catalytic Reduction
- 8.2.3. Diesel Particulate Filters
- 8.2.4. Catalytic Oxidation
- 8.3. Market Analysis, Insights and Forecast - by Application
- 8.3.1. Power Generation (Excluding Coal based)
- 8.3.2. Coal-based Thermal Power Generation
- 8.3.3. Industrial
- 8.1. Market Analysis, Insights and Forecast - by Catalyst Type
- 9. Europe Automotive Selective Catalytic Reduction Market Analysis, Insights and Forecast, 2020-2032
- 9.1. Market Analysis, Insights and Forecast - by Catalyst Type
- 9.1.1. Honeycomb Catalyst
- 9.1.2. Plate Catalyst
- 9.1.3. Corrugated Catalyst
- 9.2. Market Analysis, Insights and Forecast - by Process Type
- 9.2.1. Selective Catalytic Reduction
- 9.2.2. Non-selective Catalytic Reduction
- 9.2.3. Diesel Particulate Filters
- 9.2.4. Catalytic Oxidation
- 9.3. Market Analysis, Insights and Forecast - by Application
- 9.3.1. Power Generation (Excluding Coal based)
- 9.3.2. Coal-based Thermal Power Generation
- 9.3.3. Industrial
- 9.1. Market Analysis, Insights and Forecast - by Catalyst Type
- 10. South America Automotive Selective Catalytic Reduction Market Analysis, Insights and Forecast, 2020-2032
- 10.1. Market Analysis, Insights and Forecast - by Catalyst Type
- 10.1.1. Honeycomb Catalyst
- 10.1.2. Plate Catalyst
- 10.1.3. Corrugated Catalyst
- 10.2. Market Analysis, Insights and Forecast - by Process Type
- 10.2.1. Selective Catalytic Reduction
- 10.2.2. Non-selective Catalytic Reduction
- 10.2.3. Diesel Particulate Filters
- 10.2.4. Catalytic Oxidation
- 10.3. Market Analysis, Insights and Forecast - by Application
- 10.3.1. Power Generation (Excluding Coal based)
- 10.3.2. Coal-based Thermal Power Generation
- 10.3.3. Industrial
- 10.1. Market Analysis, Insights and Forecast - by Catalyst Type
- 11. Middle East and Africa Automotive Selective Catalytic Reduction Market Analysis, Insights and Forecast, 2020-2032
- 11.1. Market Analysis, Insights and Forecast - by Catalyst Type
- 11.1.1. Honeycomb Catalyst
- 11.1.2. Plate Catalyst
- 11.1.3. Corrugated Catalyst
- 11.2. Market Analysis, Insights and Forecast - by Process Type
- 11.2.1. Selective Catalytic Reduction
- 11.2.2. Non-selective Catalytic Reduction
- 11.2.3. Diesel Particulate Filters
- 11.2.4. Catalytic Oxidation
- 11.3. Market Analysis, Insights and Forecast - by Application
- 11.3.1. Power Generation (Excluding Coal based)
- 11.3.2. Coal-based Thermal Power Generation
- 11.3.3. Industrial
- 11.1. Market Analysis, Insights and Forecast - by Catalyst Type
- 12. Competitive Analysis
- 12.1. Company Profiles
- 12.1.1 Umicore*List Not Exhaustive
- 12.1.1.1. Company Overview
- 12.1.1.2. Products
- 12.1.1.3. Company Financials
- 12.1.1.4. SWOT Analysis
- 12.1.2 Honeywell International Inc
- 12.1.2.1. Company Overview
- 12.1.2.2. Products
- 12.1.2.3. Company Financials
- 12.1.2.4. SWOT Analysis
- 12.1.3 Clariant
- 12.1.3.1. Company Overview
- 12.1.3.2. Products
- 12.1.3.3. Company Financials
- 12.1.3.4. SWOT Analysis
- 12.1.4 JGC C&C
- 12.1.4.1. Company Overview
- 12.1.4.2. Products
- 12.1.4.3. Company Financials
- 12.1.4.4. SWOT Analysis
- 12.1.5 CRI Catalyst Company
- 12.1.5.1. Company Overview
- 12.1.5.2. Products
- 12.1.5.3. Company Financials
- 12.1.5.4. SWOT Analysis
- 12.1.6 DCL International Inc
- 12.1.6.1. Company Overview
- 12.1.6.2. Products
- 12.1.6.3. Company Financials
- 12.1.6.4. SWOT Analysis
- 12.1.7 CDTi Advanced Materials Inc
- 12.1.7.1. Company Overview
- 12.1.7.2. Products
- 12.1.7.3. Company Financials
- 12.1.7.4. SWOT Analysis
- 12.1.8 Hitachi Zosen Corporation
- 12.1.8.1. Company Overview
- 12.1.8.2. Products
- 12.1.8.3. Company Financials
- 12.1.8.4. SWOT Analysis
- 12.1.9 CORMETECH
- 12.1.9.1. Company Overview
- 12.1.9.2. Products
- 12.1.9.3. Company Financials
- 12.1.9.4. SWOT Analysis
- 12.1.10 BASF SE
- 12.1.10.1. Company Overview
- 12.1.10.2. Products
- 12.1.10.3. Company Financials
- 12.1.10.4. SWOT Analysis
- 12.1.11 Cataler Corporation
- 12.1.11.1. Company Overview
- 12.1.11.2. Products
- 12.1.11.3. Company Financials
- 12.1.11.4. SWOT Analysis
- 12.1.12 Johnson Matthey
- 12.1.12.1. Company Overview
- 12.1.12.2. Products
- 12.1.12.3. Company Financials
- 12.1.12.4. SWOT Analysis
- 12.1.13 IBIDEN Porzellanfabrik Frauenthal
- 12.1.13.1. Company Overview
- 12.1.13.2. Products
- 12.1.13.3. Company Financials
- 12.1.13.4. SWOT Analysis
- 12.1.14 Corning Incorporated
- 12.1.14.1. Company Overview
- 12.1.14.2. Products
- 12.1.14.3. Company Financials
- 12.1.14.4. SWOT Analysis
- 12.1.1 Umicore*List Not Exhaustive
- 12.2. Market Entropy
- 12.2.1 Company's Key Areas Served
- 12.2.2 Recent Developments
- 12.3. Company Market Share Analysis 2025
- 12.3.1 Top 5 Companies Market Share Analysis
- 12.3.2 Top 3 Companies Market Share Analysis
- 12.4. List of Potential Customers
- 13. Research Methodology
List of Figures
- Figure 1: Global Automotive Selective Catalytic Reduction Market Revenue Breakdown (billion, %) by Region 2025 & 2033
- Figure 2: Asia Pacific Automotive Selective Catalytic Reduction Market Revenue (billion), by Catalyst Type 2025 & 2033
- Figure 3: Asia Pacific Automotive Selective Catalytic Reduction Market Revenue Share (%), by Catalyst Type 2025 & 2033
- Figure 4: Asia Pacific Automotive Selective Catalytic Reduction Market Revenue (billion), by Process Type 2025 & 2033
- Figure 5: Asia Pacific Automotive Selective Catalytic Reduction Market Revenue Share (%), by Process Type 2025 & 2033
- Figure 6: Asia Pacific Automotive Selective Catalytic Reduction Market Revenue (billion), by Application 2025 & 2033
- Figure 7: Asia Pacific Automotive Selective Catalytic Reduction Market Revenue Share (%), by Application 2025 & 2033
- Figure 8: Asia Pacific Automotive Selective Catalytic Reduction Market Revenue (billion), by Country 2025 & 2033
- Figure 9: Asia Pacific Automotive Selective Catalytic Reduction Market Revenue Share (%), by Country 2025 & 2033
- Figure 10: North America Automotive Selective Catalytic Reduction Market Revenue (billion), by Catalyst Type 2025 & 2033
- Figure 11: North America Automotive Selective Catalytic Reduction Market Revenue Share (%), by Catalyst Type 2025 & 2033
- Figure 12: North America Automotive Selective Catalytic Reduction Market Revenue (billion), by Process Type 2025 & 2033
- Figure 13: North America Automotive Selective Catalytic Reduction Market Revenue Share (%), by Process Type 2025 & 2033
- Figure 14: North America Automotive Selective Catalytic Reduction Market Revenue (billion), by Application 2025 & 2033
- Figure 15: North America Automotive Selective Catalytic Reduction Market Revenue Share (%), by Application 2025 & 2033
- Figure 16: North America Automotive Selective Catalytic Reduction Market Revenue (billion), by Country 2025 & 2033
- Figure 17: North America Automotive Selective Catalytic Reduction Market Revenue Share (%), by Country 2025 & 2033
- Figure 18: Europe Automotive Selective Catalytic Reduction Market Revenue (billion), by Catalyst Type 2025 & 2033
- Figure 19: Europe Automotive Selective Catalytic Reduction Market Revenue Share (%), by Catalyst Type 2025 & 2033
- Figure 20: Europe Automotive Selective Catalytic Reduction Market Revenue (billion), by Process Type 2025 & 2033
- Figure 21: Europe Automotive Selective Catalytic Reduction Market Revenue Share (%), by Process Type 2025 & 2033
- Figure 22: Europe Automotive Selective Catalytic Reduction Market Revenue (billion), by Application 2025 & 2033
- Figure 23: Europe Automotive Selective Catalytic Reduction Market Revenue Share (%), by Application 2025 & 2033
- Figure 24: Europe Automotive Selective Catalytic Reduction Market Revenue (billion), by Country 2025 & 2033
- Figure 25: Europe Automotive Selective Catalytic Reduction Market Revenue Share (%), by Country 2025 & 2033
- Figure 26: South America Automotive Selective Catalytic Reduction Market Revenue (billion), by Catalyst Type 2025 & 2033
- Figure 27: South America Automotive Selective Catalytic Reduction Market Revenue Share (%), by Catalyst Type 2025 & 2033
- Figure 28: South America Automotive Selective Catalytic Reduction Market Revenue (billion), by Process Type 2025 & 2033
- Figure 29: South America Automotive Selective Catalytic Reduction Market Revenue Share (%), by Process Type 2025 & 2033
- Figure 30: South America Automotive Selective Catalytic Reduction Market Revenue (billion), by Application 2025 & 2033
- Figure 31: South America Automotive Selective Catalytic Reduction Market Revenue Share (%), by Application 2025 & 2033
- Figure 32: South America Automotive Selective Catalytic Reduction Market Revenue (billion), by Country 2025 & 2033
- Figure 33: South America Automotive Selective Catalytic Reduction Market Revenue Share (%), by Country 2025 & 2033
- Figure 34: Middle East and Africa Automotive Selective Catalytic Reduction Market Revenue (billion), by Catalyst Type 2025 & 2033
- Figure 35: Middle East and Africa Automotive Selective Catalytic Reduction Market Revenue Share (%), by Catalyst Type 2025 & 2033
- Figure 36: Middle East and Africa Automotive Selective Catalytic Reduction Market Revenue (billion), by Process Type 2025 & 2033
- Figure 37: Middle East and Africa Automotive Selective Catalytic Reduction Market Revenue Share (%), by Process Type 2025 & 2033
- Figure 38: Middle East and Africa Automotive Selective Catalytic Reduction Market Revenue (billion), by Application 2025 & 2033
- Figure 39: Middle East and Africa Automotive Selective Catalytic Reduction Market Revenue Share (%), by Application 2025 & 2033
- Figure 40: Middle East and Africa Automotive Selective Catalytic Reduction Market Revenue (billion), by Country 2025 & 2033
- Figure 41: Middle East and Africa Automotive Selective Catalytic Reduction Market Revenue Share (%), by Country 2025 & 2033
List of Tables
- Table 1: Global Automotive Selective Catalytic Reduction Market Revenue billion Forecast, by Catalyst Type 2020 & 2033
- Table 2: Global Automotive Selective Catalytic Reduction Market Revenue billion Forecast, by Process Type 2020 & 2033
- Table 3: Global Automotive Selective Catalytic Reduction Market Revenue billion Forecast, by Application 2020 & 2033
- Table 4: Global Automotive Selective Catalytic Reduction Market Revenue billion Forecast, by Region 2020 & 2033
- Table 5: Global Automotive Selective Catalytic Reduction Market Revenue billion Forecast, by Catalyst Type 2020 & 2033
- Table 6: Global Automotive Selective Catalytic Reduction Market Revenue billion Forecast, by Process Type 2020 & 2033
- Table 7: Global Automotive Selective Catalytic Reduction Market Revenue billion Forecast, by Application 2020 & 2033
- Table 8: Global Automotive Selective Catalytic Reduction Market Revenue billion Forecast, by Country 2020 & 2033
- Table 9: China Automotive Selective Catalytic Reduction Market Revenue (billion) Forecast, by Application 2020 & 2033
- Table 10: India Automotive Selective Catalytic Reduction Market Revenue (billion) Forecast, by Application 2020 & 2033
- Table 11: Japan Automotive Selective Catalytic Reduction Market Revenue (billion) Forecast, by Application 2020 & 2033
- Table 12: South Korea Automotive Selective Catalytic Reduction Market Revenue (billion) Forecast, by Application 2020 & 2033
- Table 13: ASEAN Countries Automotive Selective Catalytic Reduction Market Revenue (billion) Forecast, by Application 2020 & 2033
- Table 14: Rest of Asia Pacific Automotive Selective Catalytic Reduction Market Revenue (billion) Forecast, by Application 2020 & 2033
- Table 15: Global Automotive Selective Catalytic Reduction Market Revenue billion Forecast, by Catalyst Type 2020 & 2033
- Table 16: Global Automotive Selective Catalytic Reduction Market Revenue billion Forecast, by Process Type 2020 & 2033
- Table 17: Global Automotive Selective Catalytic Reduction Market Revenue billion Forecast, by Application 2020 & 2033
- Table 18: Global Automotive Selective Catalytic Reduction Market Revenue billion Forecast, by Country 2020 & 2033
- Table 19: United States Automotive Selective Catalytic Reduction Market Revenue (billion) Forecast, by Application 2020 & 2033
- Table 20: Canada Automotive Selective Catalytic Reduction Market Revenue (billion) Forecast, by Application 2020 & 2033
- Table 21: Mexico Automotive Selective Catalytic Reduction Market Revenue (billion) Forecast, by Application 2020 & 2033
- Table 22: Global Automotive Selective Catalytic Reduction Market Revenue billion Forecast, by Catalyst Type 2020 & 2033
- Table 23: Global Automotive Selective Catalytic Reduction Market Revenue billion Forecast, by Process Type 2020 & 2033
- Table 24: Global Automotive Selective Catalytic Reduction Market Revenue billion Forecast, by Application 2020 & 2033
- Table 25: Global Automotive Selective Catalytic Reduction Market Revenue billion Forecast, by Country 2020 & 2033
- Table 26: Germany Automotive Selective Catalytic Reduction Market Revenue (billion) Forecast, by Application 2020 & 2033
- Table 27: United Kingdom Automotive Selective Catalytic Reduction Market Revenue (billion) Forecast, by Application 2020 & 2033
- Table 28: Italy Automotive Selective Catalytic Reduction Market Revenue (billion) Forecast, by Application 2020 & 2033
- Table 29: Russia Automotive Selective Catalytic Reduction Market Revenue (billion) Forecast, by Application 2020 & 2033
- Table 30: Rest of the Europe Automotive Selective Catalytic Reduction Market Revenue (billion) Forecast, by Application 2020 & 2033
- Table 31: Global Automotive Selective Catalytic Reduction Market Revenue billion Forecast, by Catalyst Type 2020 & 2033
- Table 32: Global Automotive Selective Catalytic Reduction Market Revenue billion Forecast, by Process Type 2020 & 2033
- Table 33: Global Automotive Selective Catalytic Reduction Market Revenue billion Forecast, by Application 2020 & 2033
- Table 34: Global Automotive Selective Catalytic Reduction Market Revenue billion Forecast, by Country 2020 & 2033
- Table 35: Brazil Automotive Selective Catalytic Reduction Market Revenue (billion) Forecast, by Application 2020 & 2033
- Table 36: Argentina Automotive Selective Catalytic Reduction Market Revenue (billion) Forecast, by Application 2020 & 2033
- Table 37: Rest of South America Automotive Selective Catalytic Reduction Market Revenue (billion) Forecast, by Application 2020 & 2033
- Table 38: Global Automotive Selective Catalytic Reduction Market Revenue billion Forecast, by Catalyst Type 2020 & 2033
- Table 39: Global Automotive Selective Catalytic Reduction Market Revenue billion Forecast, by Process Type 2020 & 2033
- Table 40: Global Automotive Selective Catalytic Reduction Market Revenue billion Forecast, by Application 2020 & 2033
- Table 41: Global Automotive Selective Catalytic Reduction Market Revenue billion Forecast, by Country 2020 & 2033
- Table 42: Saudi Arabia Automotive Selective Catalytic Reduction Market Revenue (billion) Forecast, by Application 2020 & 2033
- Table 43: South Africa Automotive Selective Catalytic Reduction Market Revenue (billion) Forecast, by Application 2020 & 2033
- Table 44: Rest of Middle East and Africa Automotive Selective Catalytic Reduction Market Revenue (billion) Forecast, by Application 2020 & 2033
Frequently Asked Questions
1. What is the projected Compound Annual Growth Rate (CAGR) of the Automotive Selective Catalytic Reduction Market?
The projected CAGR is approximately 11.8%.
2. Which companies are prominent players in the Automotive Selective Catalytic Reduction Market?
Key companies in the market include Umicore*List Not Exhaustive, Honeywell International Inc, Clariant, JGC C&C, CRI Catalyst Company, DCL International Inc, CDTi Advanced Materials Inc, Hitachi Zosen Corporation, CORMETECH, BASF SE, Cataler Corporation, Johnson Matthey, IBIDEN Porzellanfabrik Frauenthal, Corning Incorporated.
3. What are the main segments of the Automotive Selective Catalytic Reduction Market?
The market segments include Catalyst Type, Process Type, Application.
4. Can you provide details about the market size?
The market size is estimated to be USD 13.22 billion as of 2022.
5. What are some drivers contributing to market growth?
Increasing Demand due to Stringent Emission Standards of Developed Countries; Increasing Thermal Power Production Capacity in China and India.
6. What are the notable trends driving market growth?
Power Industry to Dominate the Market.
7. Are there any restraints impacting market growth?
Decline in Coal Based Thermal Power Generation in Western European Countries.
8. Can you provide examples of recent developments in the market?
N/A
9. What pricing options are available for accessing the report?
Pricing options include single-user, multi-user, and enterprise licenses priced at USD 4750, USD 5250, and USD 8750 respectively.
10. Is the market size provided in terms of value or volume?
The market size is provided in terms of value, measured in billion.
11. Are there any specific market keywords associated with the report?
Yes, the market keyword associated with the report is "Automotive Selective Catalytic Reduction Market," which aids in identifying and referencing the specific market segment covered.
12. How do I determine which pricing option suits my needs best?
The pricing options vary based on user requirements and access needs. Individual users may opt for single-user licenses, while businesses requiring broader access may choose multi-user or enterprise licenses for cost-effective access to the report.
13. Are there any additional resources or data provided in the Automotive Selective Catalytic Reduction Market report?
While the report offers comprehensive insights, it's advisable to review the specific contents or supplementary materials provided to ascertain if additional resources or data are available.
14. How can I stay updated on further developments or reports in the Automotive Selective Catalytic Reduction Market?
To stay informed about further developments, trends, and reports in the Automotive Selective Catalytic Reduction Market, consider subscribing to industry newsletters, following relevant companies and organizations, or regularly checking reputable industry news sources and publications.
Methodology
Step 1 - Identification of Relevant Samples Size from Population Database


Step 2 - Approaches for Defining Global Market Size (Value, Volume* & Price*)

Note*: In applicable scenarios
Step 3 - Data Sources
Primary Research
- Web Analytics
- Survey Reports
- Research Institute
- Latest Research Reports
- Opinion Leaders
Secondary Research
- Annual Reports
- White Paper
- Latest Press Release
- Industry Association
- Paid Database
- Investor Presentations

Step 4 - Data Triangulation
Involves using different sources of information in order to increase the validity of a study
These sources are likely to be stakeholders in a program - participants, other researchers, program staff, other community members, and so on.
Then we put all data in single framework & apply various statistical tools to find out the dynamic on the market.
During the analysis stage, feedback from the stakeholder groups would be compared to determine areas of agreement as well as areas of divergence