Autonomous Systems Industry Analysis 2025-2033: Unlocking Competitive Opportunities

Autonomous Systems Industry by Production Analysis, by Consumption Analysis, by Import Market Analysis (Value & Volume), by Export Market Analysis (Value & Volume), by Price Trend Analysis, by North America (United States, Canada, Mexico), by South America (Brazil, Argentina, Rest of South America), by Europe (United Kingdom, Germany, France, Italy, Spain, Russia, Benelux, Nordics, Rest of Europe), by Middle East & Africa (Turkey, Israel, GCC, North Africa, South Africa, Rest of Middle East & Africa), by Asia Pacific (China, India, Japan, South Korea, ASEAN, Oceania, Rest of Asia Pacific) Forecast 2025-2033

Jun 8 2025
Base Year: 2024

234 Pages
Main Logo

Autonomous Systems Industry Analysis 2025-2033: Unlocking Competitive Opportunities


Home
Industries
Unmanned Systems

Tailored for you

  • In-depth Analysis Tailored to Specified Regions or Segments
  • Company Profiles Customized to User Preferences
  • Comprehensive Insights Focused on Specific Segments or Regions
  • Customized Evaluation of Competitive Landscape to Meet Your Needs
  • Tailored Customization to Address Other Specific Requirements
Ask for customization


Key Insights

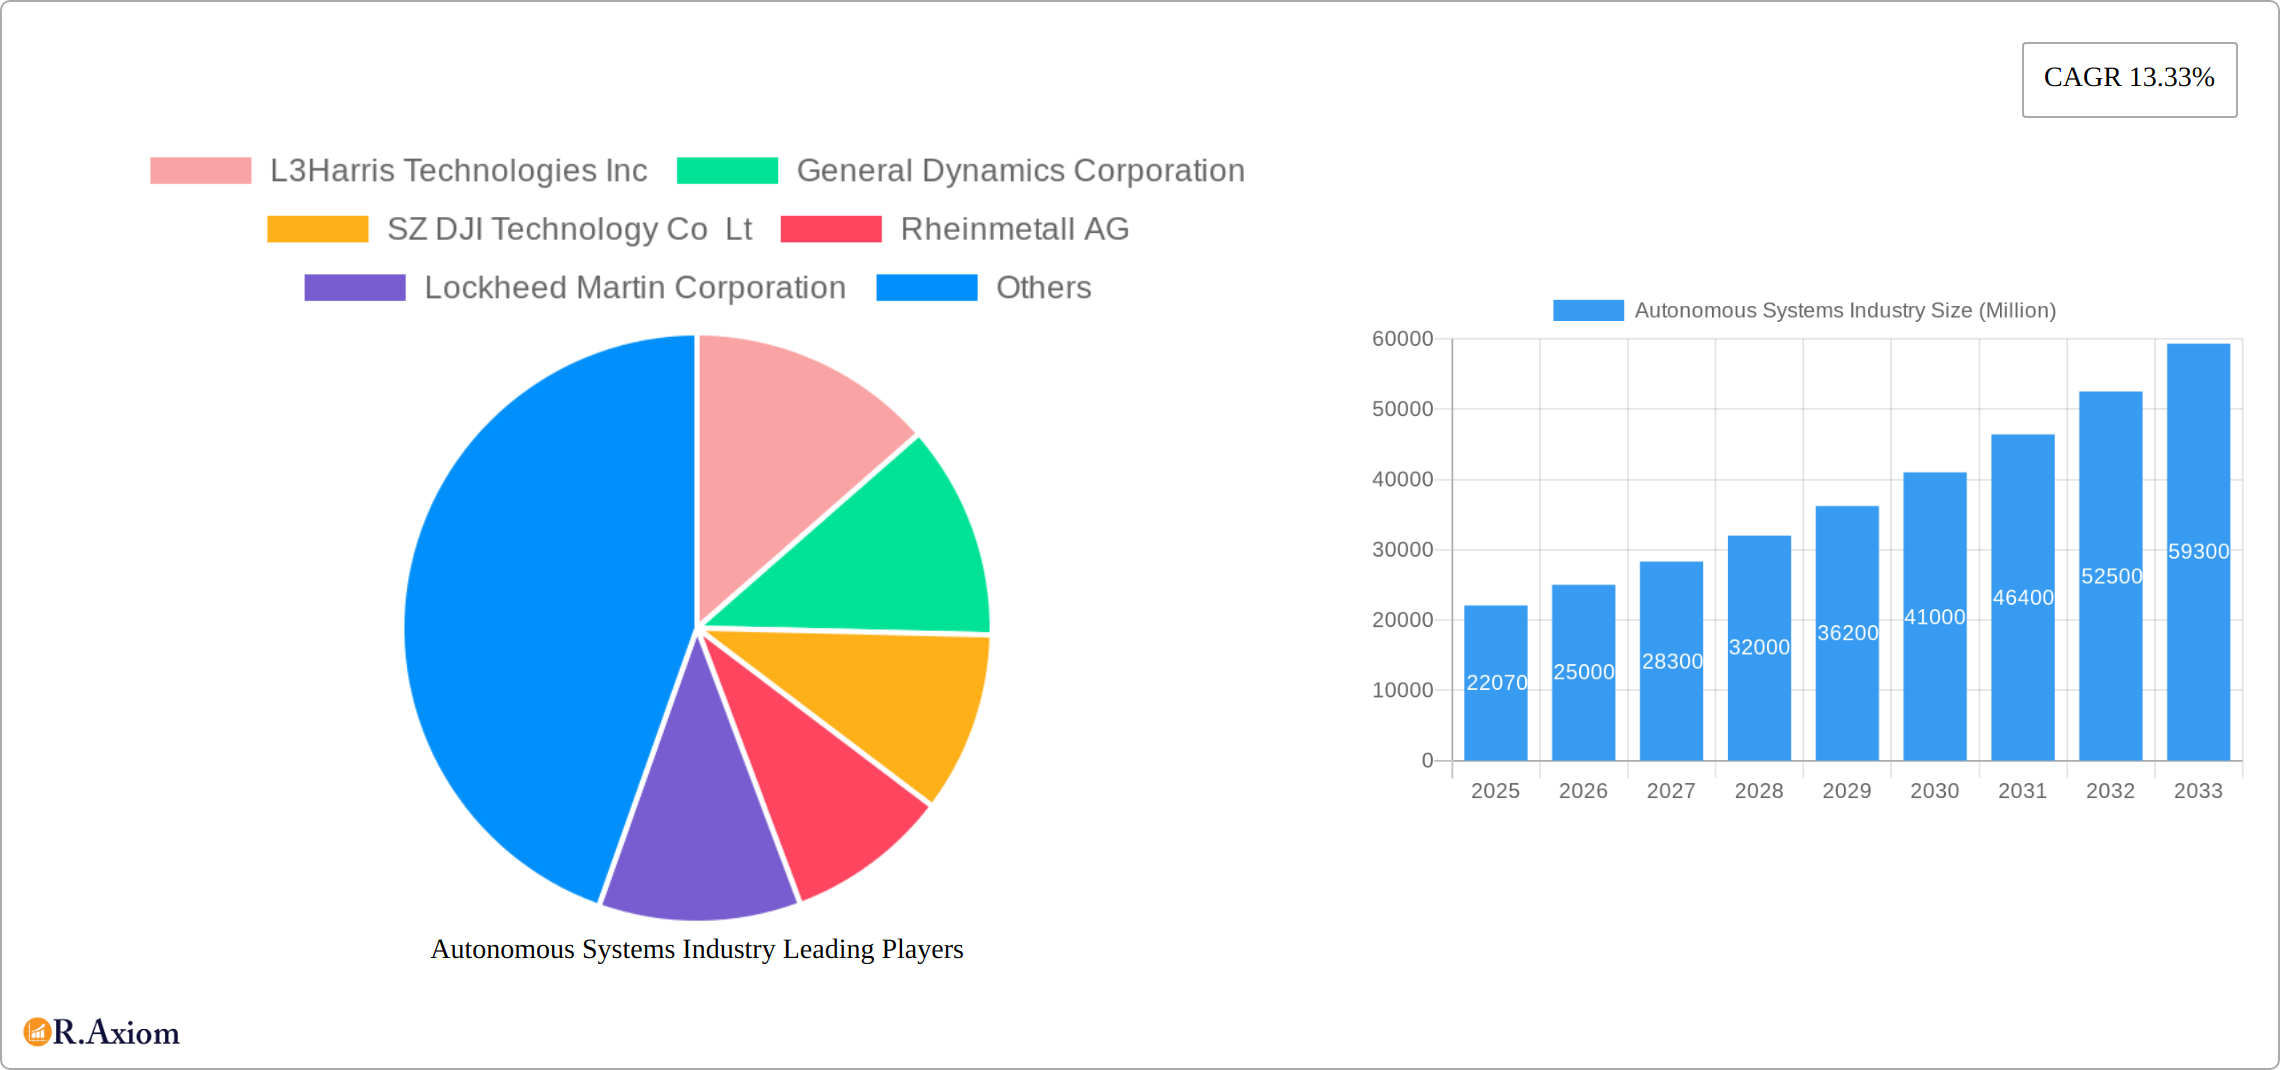
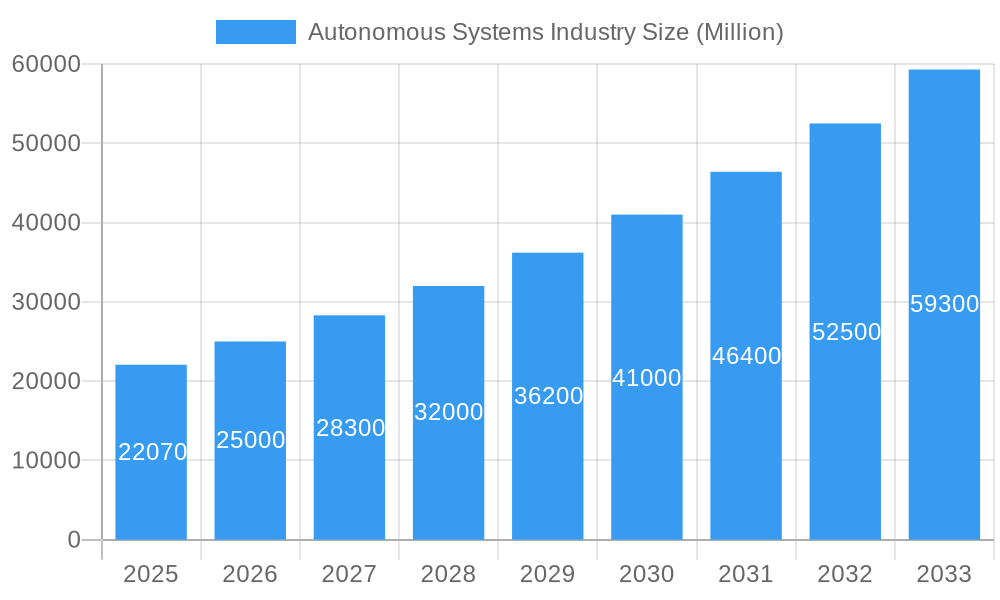
The Autonomous Systems industry is experiencing robust growth, projected to reach \$22.07 billion in 2025 and exhibiting a Compound Annual Growth Rate (CAGR) of 13.33% from 2025 to 2033. This expansion is driven by several key factors. Firstly, increasing demand for enhanced surveillance and security in military and law enforcement applications fuels significant investment in unmanned aerial vehicles (UAVs), unmanned ground vehicles (UGVs), and unmanned sea systems. Secondly, the commercial sector is adopting autonomous systems for logistics, infrastructure inspection, and precision agriculture, further propelling market growth. Technological advancements, particularly in areas like AI, sensor technology, and communication systems, are continuously improving the capabilities and reliability of these systems, expanding their applications and market reach. Finally, government initiatives and regulations supporting the development and deployment of autonomous systems are creating a favourable environment for industry growth.

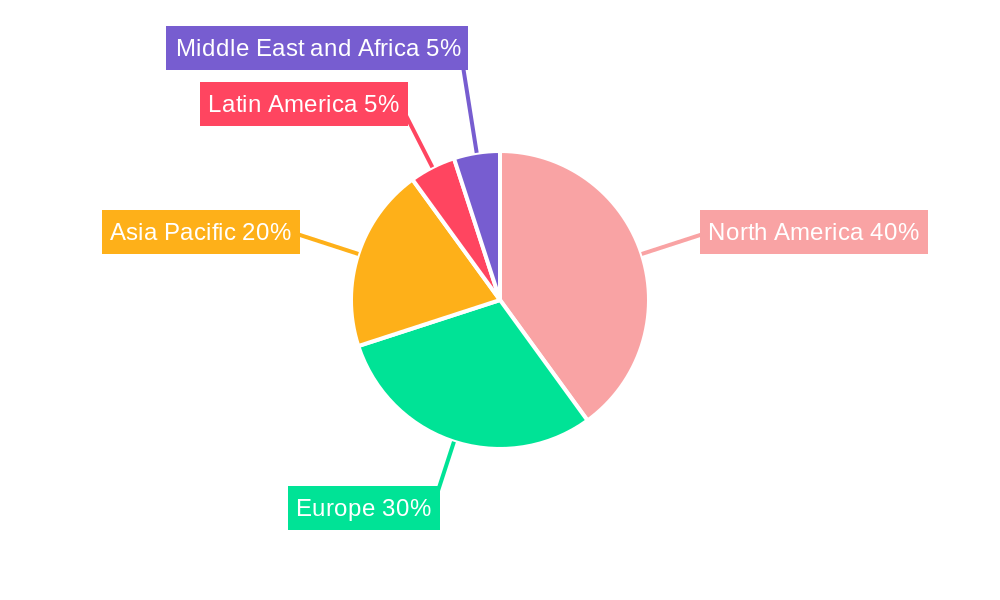
However, market growth is not without challenges. High initial investment costs, stringent regulatory frameworks in certain regions, and concerns surrounding cybersecurity and data privacy pose significant restraints. The market is segmented by system type (UAVs, UGVs, Unmanned Sea Systems), application (military & law enforcement, commercial), and hybrid systems. North America currently holds a substantial market share, followed by Europe and Asia-Pacific, with rapid growth expected from emerging economies in Asia-Pacific and the Middle East and Africa due to increasing infrastructure development and defense spending. Competition in the autonomous systems market is fierce, with established defense contractors and technology companies vying for market leadership. Successful players are focusing on strategic partnerships, research & development, and the development of innovative solutions to maintain a competitive edge and cater to the diverse needs of end-users.

This in-depth report provides a comprehensive analysis of the Autonomous Systems industry, offering valuable insights for stakeholders across the value chain. With a study period spanning 2019-2033, a base year of 2025, and an estimated and forecast period of 2025-2033, this report delivers crucial data and projections for informed decision-making. The report covers key segments, including Unmanned Aerial Vehicles (UAVs), Large UAVs, Unmanned Ground Vehicles (UGVs), and Unmanned Sea Systems, across Military & Law Enforcement and Commercial applications. The analysis incorporates data from the historical period (2019-2024) and projects future growth trends. The total market size in 2025 is estimated at $xx Million.

Autonomous Systems Industry Research Report - Market Size, Growth & Forecast

Autonomous Systems Industry Market Concentration & Innovation

The Autonomous Systems market exhibits a moderately concentrated structure, with a few dominant players commanding significant market share. In 2025, the top five companies—L3Harris Technologies Inc, General Dynamics Corporation, Lockheed Martin Corporation, Northrop Grumman Corporation, and Boeing—are estimated to hold a combined xx% market share. This concentration is driven by substantial R&D investments, strong intellectual property portfolios, and established supply chains. However, the market is witnessing increasing participation from smaller, specialized companies, particularly in niche segments like commercial drone delivery and autonomous navigation software.

Innovation is a key driver, fueled by advancements in artificial intelligence (AI), machine learning (ML), sensor technologies, and communication systems. Regulatory frameworks, while evolving, are playing a significant role in shaping market growth and adoption. Stringent safety and security regulations, particularly in the military and airspace sectors, impact market entry and product development. The industry faces pressure from substitute technologies, such as remotely piloted vehicles (RPVs), but autonomous systems are increasingly preferred for their enhanced efficiency and reduced reliance on human intervention. End-user trends favor increased automation and improved operational efficiency, pushing demand for sophisticated autonomous solutions. Significant M&A activity is observed, with deal values exceeding $xx Million in the past five years, indicating consolidation and expansion strategies among key players. For example, the acquisition of Company X by Company Y in 2023 for $xx Million significantly altered market dynamics.

  • Top 5 Companies Market Share (2025): xx%
  • M&A Deal Value (2019-2024): Over $xx Million

Autonomous Systems Industry Industry Trends & Insights

The Autonomous Systems market is experiencing robust growth, driven by several key factors. The Compound Annual Growth Rate (CAGR) from 2025 to 2033 is projected to be xx%, fueled by increasing demand across diverse applications. Technological advancements, particularly in AI and sensor integration, are enhancing the capabilities and reliability of autonomous systems, leading to wider adoption. Consumer preferences are shifting towards greater automation, improved safety, and cost-effectiveness. The market penetration of autonomous systems varies significantly across segments and regions. The military and law enforcement sector demonstrates high market penetration due to the critical need for autonomous capabilities in surveillance, reconnaissance, and other security operations. Commercial applications are also showing significant growth potential, driven by the increased demand in logistics, delivery, agriculture, and other commercial sectors. The increasing need for optimized infrastructure management and automation has stimulated the growth of the Autonomous Systems market across sectors. The market is characterized by intense competition among established players and emerging startups, leading to continuous innovation and improved product offerings. This competitive landscape will drive technological developments and cost optimization, further accelerating the adoption of Autonomous Systems in various sectors.

Autonomous Systems Industry Growth

Dominant Markets & Segments in Autonomous Systems Industry

Leading Regions and Segments:

  • Unmanned Aerial Vehicles (UAVs): The UAV segment dominates the market, driven by its wide range of applications in surveillance, mapping, delivery, and inspection. North America and Europe currently hold the largest market share due to robust technological advancements and high defense budgets. Key drivers include increasing investments in defense modernization programs and the growing need for autonomous surveillance capabilities.

  • Military and Law Enforcement Applications: This segment is the largest revenue generator, owing to significant government spending on defense and security. Growth is fuelled by the need for enhanced situational awareness, improved operational efficiency, and reduced risk to personnel.

  • Unmanned Ground Vehicles (UGVs): The UGV market is experiencing steady growth, with strong demand from logistics, mining, and agriculture sectors. The Asia-Pacific region shows high potential for growth due to rapid industrialization and infrastructure development. Key drivers include the rising need for improved efficiency and safety in hazardous environments, driving the growth of the segment.

  • Hybrid: Unmanned Sea Systems: While currently smaller than other segments, the market for unmanned sea systems is poised for substantial growth driven by advancements in autonomous navigation and underwater robotics. Demand is largely concentrated in defense and oceanographic research.

  • Commercial Applications: The commercial segment exhibits high growth potential, driven by the adoption of autonomous systems in diverse applications such as delivery, inspection, and agriculture. Rapid technological advancements and increased investments in automation are key drivers propelling this sector's rapid growth.

Autonomous Systems Industry Product Developments

Recent innovations include advancements in AI-powered navigation, improved sensor fusion techniques, and the development of more robust and reliable platforms. These technological advancements have led to autonomous systems with enhanced capabilities, improved safety features, and expanded operational range. The market is increasingly focused on developing systems with enhanced autonomy levels, reduced reliance on human intervention, and improved integration capabilities. This allows for greater interoperability and expands the operational capabilities of autonomous systems across various environments.

Report Scope & Segmentation Analysis

This report segments the Autonomous Systems market by:

  • Type: Unmanned Aerial Vehicles (UAVs), Large UAVs, Unmanned Ground Vehicles (UGVs), and Unmanned Sea Systems. Each segment is further analyzed in terms of market size, growth rate, and competitive landscape. UAVs represent the largest segment, followed by UGVs.
  • Application: Military and Law Enforcement, and Commercial. Military and Law Enforcement applications currently dominate, but commercial applications are showing rapid growth potential.
  • Hybrid: Each type of unmanned system is further classified based on hybrid functionalities and integration with other systems, examining advancements and growth prospects in integrated systems.

Key Drivers of Autonomous Systems Industry Growth

The Autonomous Systems industry’s growth is propelled by several factors:

  • Technological Advancements: AI, machine learning, and advanced sensor technologies are improving the capabilities and reliability of autonomous systems.
  • Economic Benefits: Autonomous systems offer improved efficiency, reduced labor costs, and increased productivity across various industries.
  • Regulatory Support: Governments worldwide are investing in research and development, creating favorable regulatory environments for autonomous system deployment. This includes supportive policies promoting technology adoption, such as streamlined approval processes.

Challenges in the Autonomous Systems Industry Sector

Several challenges hinder the industry's growth:

  • Regulatory Hurdles: Strict safety and security regulations, particularly for autonomous aerial vehicles, create barriers to market entry.
  • Supply Chain Issues: The complexity of autonomous systems necessitates sophisticated supply chains, susceptible to disruptions and component shortages.
  • Cybersecurity Risks: Autonomous systems are vulnerable to cyberattacks, raising concerns about security and data protection. This presents a significant barrier, requiring investment in robust cybersecurity solutions.

Emerging Opportunities in Autonomous Systems Industry

Several emerging opportunities are poised to shape the industry:

  • New Market Applications: Expanding applications in healthcare, infrastructure inspection, and precision agriculture offer significant growth potential.
  • Advanced Technologies: Integration of 5G, edge computing, and swarm technologies will enhance capabilities and expand operational possibilities.
  • Increased Consumer Adoption: Growing awareness and acceptance of autonomous systems, driven by improvements in safety and reliability, will boost demand.

Leading Players in the Autonomous Systems Industry Market

  • L3Harris Technologies Inc
  • General Dynamics Corporation
  • SZ DJI Technology Co Lt
  • Rheinmetall AG
  • Lockheed Martin Corporation
  • Elbit Systems Ltd
  • ECA Group
  • QinetiQ Group
  • BAE Systems PLC
  • Israel Aerospace Industries Ltd
  • Northrop Grumman Corporation
  • Saab AB
  • The Boeing Company
  • Teledyne FLIR LLC

Key Developments in Autonomous Systems Industry Industry

  • January 2023: Company X launched a new autonomous delivery drone with extended range and payload capacity. This significantly impacted the commercial delivery market segment.
  • March 2022: A major merger between Company Y and Company Z reshaped the competitive landscape in the UGV market. This consolidated market share and resources.
  • June 2021: New regulations on drone operations were implemented in Country A, influencing market access and product development strategies.

Strategic Outlook for Autonomous Systems Industry Market

The Autonomous Systems market is poised for continued expansion, driven by technological progress, increasing demand across diverse sectors, and supportive government policies. The market presents significant opportunities for both established players and emerging companies, especially within rapidly developing commercial applications such as delivery and logistics. Focusing on innovation, strategic partnerships, and addressing cybersecurity concerns will be crucial for success in this dynamic and evolving industry. The market is expected to reach $xx Million by 2033.

Autonomous Systems Industry Segmentation

  • 1. Production Analysis
  • 2. Consumption Analysis
  • 3. Import Market Analysis (Value & Volume)
  • 4. Export Market Analysis (Value & Volume)
  • 5. Price Trend Analysis

Autonomous Systems Industry Segmentation By Geography

  • 1. North America
    • 1.1. United States
    • 1.2. Canada
    • 1.3. Mexico
  • 2. South America
    • 2.1. Brazil
    • 2.2. Argentina
    • 2.3. Rest of South America
  • 3. Europe
    • 3.1. United Kingdom
    • 3.2. Germany
    • 3.3. France
    • 3.4. Italy
    • 3.5. Spain
    • 3.6. Russia
    • 3.7. Benelux
    • 3.8. Nordics
    • 3.9. Rest of Europe
  • 4. Middle East & Africa
    • 4.1. Turkey
    • 4.2. Israel
    • 4.3. GCC
    • 4.4. North Africa
    • 4.5. South Africa
    • 4.6. Rest of Middle East & Africa
  • 5. Asia Pacific
    • 5.1. China
    • 5.2. India
    • 5.3. Japan
    • 5.4. South Korea
    • 5.5. ASEAN
    • 5.6. Oceania
    • 5.7. Rest of Asia Pacific
Autonomous Systems Industry Regional Share


Autonomous Systems Industry REPORT HIGHLIGHTS

AspectsDetails
Study Period 2019-2033
Base Year 2024
Estimated Year 2025
Forecast Period2025-2033
Historical Period2019-2024
Growth RateCAGR of 13.33% from 2019-2033
Segmentation
    • By Production Analysis
    • By Consumption Analysis
    • By Import Market Analysis (Value & Volume)
    • By Export Market Analysis (Value & Volume)
    • By Price Trend Analysis
  • By Geography
    • North America
      • United States
      • Canada
      • Mexico
    • South America
      • Brazil
      • Argentina
      • Rest of South America
    • Europe
      • United Kingdom
      • Germany
      • France
      • Italy
      • Spain
      • Russia
      • Benelux
      • Nordics
      • Rest of Europe
    • Middle East & Africa
      • Turkey
      • Israel
      • GCC
      • North Africa
      • South Africa
      • Rest of Middle East & Africa
    • Asia Pacific
      • China
      • India
      • Japan
      • South Korea
      • ASEAN
      • Oceania
      • Rest of Asia Pacific


Table of Contents

  1. 1. Introduction
    • 1.1. Research Scope
    • 1.2. Market Segmentation
    • 1.3. Research Methodology
    • 1.4. Definitions and Assumptions
  2. 2. Executive Summary
    • 2.1. Introduction
  3. 3. Market Dynamics
    • 3.1. Introduction
      • 3.2. Market Drivers
        • 3.2.1. ; Increasing Number Of Air Passengers; Use Of Portable Electronic Devices
      • 3.3. Market Restrains
        • 3.3.1. ; High Cost Of Connectivity Equipments
      • 3.4. Market Trends
        • 3.4.1. The Unmanned Aerial Vehicles Segment to Witness the Highest Growth During the Forecast Period
  4. 4. Market Factor Analysis
    • 4.1. Porters Five Forces
    • 4.2. Supply/Value Chain
    • 4.3. PESTEL analysis
    • 4.4. Market Entropy
    • 4.5. Patent/Trademark Analysis
  5. 5. Global Autonomous Systems Industry Analysis, Insights and Forecast, 2019-2031
    • 5.1. Market Analysis, Insights and Forecast - by Production Analysis
      • 5.2. Market Analysis, Insights and Forecast - by Consumption Analysis
        • 5.3. Market Analysis, Insights and Forecast - by Import Market Analysis (Value & Volume)
          • 5.4. Market Analysis, Insights and Forecast - by Export Market Analysis (Value & Volume)
            • 5.5. Market Analysis, Insights and Forecast - by Price Trend Analysis
              • 5.6. Market Analysis, Insights and Forecast - by Region
                • 5.6.1. North America
                • 5.6.2. South America
                • 5.6.3. Europe
                • 5.6.4. Middle East & Africa
                • 5.6.5. Asia Pacific
            • 6. North America Autonomous Systems Industry Analysis, Insights and Forecast, 2019-2031
              • 6.1. Market Analysis, Insights and Forecast - by Production Analysis
                • 6.2. Market Analysis, Insights and Forecast - by Consumption Analysis
                  • 6.3. Market Analysis, Insights and Forecast - by Import Market Analysis (Value & Volume)
                    • 6.4. Market Analysis, Insights and Forecast - by Export Market Analysis (Value & Volume)
                      • 6.5. Market Analysis, Insights and Forecast - by Price Trend Analysis
                      • 7. South America Autonomous Systems Industry Analysis, Insights and Forecast, 2019-2031
                        • 7.1. Market Analysis, Insights and Forecast - by Production Analysis
                          • 7.2. Market Analysis, Insights and Forecast - by Consumption Analysis
                            • 7.3. Market Analysis, Insights and Forecast - by Import Market Analysis (Value & Volume)
                              • 7.4. Market Analysis, Insights and Forecast - by Export Market Analysis (Value & Volume)
                                • 7.5. Market Analysis, Insights and Forecast - by Price Trend Analysis
                                • 8. Europe Autonomous Systems Industry Analysis, Insights and Forecast, 2019-2031
                                  • 8.1. Market Analysis, Insights and Forecast - by Production Analysis
                                    • 8.2. Market Analysis, Insights and Forecast - by Consumption Analysis
                                      • 8.3. Market Analysis, Insights and Forecast - by Import Market Analysis (Value & Volume)
                                        • 8.4. Market Analysis, Insights and Forecast - by Export Market Analysis (Value & Volume)
                                          • 8.5. Market Analysis, Insights and Forecast - by Price Trend Analysis
                                          • 9. Middle East & Africa Autonomous Systems Industry Analysis, Insights and Forecast, 2019-2031
                                            • 9.1. Market Analysis, Insights and Forecast - by Production Analysis
                                              • 9.2. Market Analysis, Insights and Forecast - by Consumption Analysis
                                                • 9.3. Market Analysis, Insights and Forecast - by Import Market Analysis (Value & Volume)
                                                  • 9.4. Market Analysis, Insights and Forecast - by Export Market Analysis (Value & Volume)
                                                    • 9.5. Market Analysis, Insights and Forecast - by Price Trend Analysis
                                                    • 10. Asia Pacific Autonomous Systems Industry Analysis, Insights and Forecast, 2019-2031
                                                      • 10.1. Market Analysis, Insights and Forecast - by Production Analysis
                                                        • 10.2. Market Analysis, Insights and Forecast - by Consumption Analysis
                                                          • 10.3. Market Analysis, Insights and Forecast - by Import Market Analysis (Value & Volume)
                                                            • 10.4. Market Analysis, Insights and Forecast - by Export Market Analysis (Value & Volume)
                                                              • 10.5. Market Analysis, Insights and Forecast - by Price Trend Analysis
                                                              • 11. North America Autonomous Systems Industry Analysis, Insights and Forecast, 2019-2031
                                                                  • 11.1. Market Analysis, Insights and Forecast - By Country/Sub-region
                                                                    • 11.1.1 United States
                                                                    • 11.1.2 Canada
                                                              • 12. Europe Autonomous Systems Industry Analysis, Insights and Forecast, 2019-2031
                                                                  • 12.1. Market Analysis, Insights and Forecast - By Country/Sub-region
                                                                    • 12.1.1 Germany
                                                                    • 12.1.2 United Kingdom
                                                                    • 12.1.3 France
                                                                    • 12.1.4 Russia
                                                                    • 12.1.5 Rest of Europe
                                                              • 13. Asia Pacific Autonomous Systems Industry Analysis, Insights and Forecast, 2019-2031
                                                                  • 13.1. Market Analysis, Insights and Forecast - By Country/Sub-region
                                                                    • 13.1.1 China
                                                                    • 13.1.2 India
                                                                    • 13.1.3 South Korea
                                                                    • 13.1.4 Japan
                                                                    • 13.1.5 Rest of Asia Pacific
                                                              • 14. Latin America Autonomous Systems Industry Analysis, Insights and Forecast, 2019-2031
                                                                  • 14.1. Market Analysis, Insights and Forecast - By Country/Sub-region
                                                                    • 14.1.1 Brazil
                                                                    • 14.1.2 Rest of Latin America
                                                              • 15. Middle East and Africa Autonomous Systems Industry Analysis, Insights and Forecast, 2019-2031
                                                                  • 15.1. Market Analysis, Insights and Forecast - By Country/Sub-region
                                                                    • 15.1.1 United Arab Emirates
                                                                    • 15.1.2 Saudi Arabia
                                                                    • 15.1.3 Rest of Middle East and Africa
                                                              • 16. Competitive Analysis
                                                                • 16.1. Global Market Share Analysis 2024
                                                                  • 16.2. Company Profiles
                                                                    • 16.2.1 L3Harris Technologies Inc
                                                                      • 16.2.1.1. Overview
                                                                      • 16.2.1.2. Products
                                                                      • 16.2.1.3. SWOT Analysis
                                                                      • 16.2.1.4. Recent Developments
                                                                      • 16.2.1.5. Financials (Based on Availability)
                                                                    • 16.2.2 General Dynamics Corporation
                                                                      • 16.2.2.1. Overview
                                                                      • 16.2.2.2. Products
                                                                      • 16.2.2.3. SWOT Analysis
                                                                      • 16.2.2.4. Recent Developments
                                                                      • 16.2.2.5. Financials (Based on Availability)
                                                                    • 16.2.3 SZ DJI Technology Co Lt
                                                                      • 16.2.3.1. Overview
                                                                      • 16.2.3.2. Products
                                                                      • 16.2.3.3. SWOT Analysis
                                                                      • 16.2.3.4. Recent Developments
                                                                      • 16.2.3.5. Financials (Based on Availability)
                                                                    • 16.2.4 Rheinmetall AG
                                                                      • 16.2.4.1. Overview
                                                                      • 16.2.4.2. Products
                                                                      • 16.2.4.3. SWOT Analysis
                                                                      • 16.2.4.4. Recent Developments
                                                                      • 16.2.4.5. Financials (Based on Availability)
                                                                    • 16.2.5 Lockheed Martin Corporation
                                                                      • 16.2.5.1. Overview
                                                                      • 16.2.5.2. Products
                                                                      • 16.2.5.3. SWOT Analysis
                                                                      • 16.2.5.4. Recent Developments
                                                                      • 16.2.5.5. Financials (Based on Availability)
                                                                    • 16.2.6 Elbit Systems Ltd
                                                                      • 16.2.6.1. Overview
                                                                      • 16.2.6.2. Products
                                                                      • 16.2.6.3. SWOT Analysis
                                                                      • 16.2.6.4. Recent Developments
                                                                      • 16.2.6.5. Financials (Based on Availability)
                                                                    • 16.2.7 ECA Group
                                                                      • 16.2.7.1. Overview
                                                                      • 16.2.7.2. Products
                                                                      • 16.2.7.3. SWOT Analysis
                                                                      • 16.2.7.4. Recent Developments
                                                                      • 16.2.7.5. Financials (Based on Availability)
                                                                    • 16.2.8 QinetiQ Group
                                                                      • 16.2.8.1. Overview
                                                                      • 16.2.8.2. Products
                                                                      • 16.2.8.3. SWOT Analysis
                                                                      • 16.2.8.4. Recent Developments
                                                                      • 16.2.8.5. Financials (Based on Availability)
                                                                    • 16.2.9 BAE Systems PLC
                                                                      • 16.2.9.1. Overview
                                                                      • 16.2.9.2. Products
                                                                      • 16.2.9.3. SWOT Analysis
                                                                      • 16.2.9.4. Recent Developments
                                                                      • 16.2.9.5. Financials (Based on Availability)
                                                                    • 16.2.10 Israel Aerospace Industries Ltd
                                                                      • 16.2.10.1. Overview
                                                                      • 16.2.10.2. Products
                                                                      • 16.2.10.3. SWOT Analysis
                                                                      • 16.2.10.4. Recent Developments
                                                                      • 16.2.10.5. Financials (Based on Availability)
                                                                    • 16.2.11 Northrop Grumman Corporation
                                                                      • 16.2.11.1. Overview
                                                                      • 16.2.11.2. Products
                                                                      • 16.2.11.3. SWOT Analysis
                                                                      • 16.2.11.4. Recent Developments
                                                                      • 16.2.11.5. Financials (Based on Availability)
                                                                    • 16.2.12 Saab AB
                                                                      • 16.2.12.1. Overview
                                                                      • 16.2.12.2. Products
                                                                      • 16.2.12.3. SWOT Analysis
                                                                      • 16.2.12.4. Recent Developments
                                                                      • 16.2.12.5. Financials (Based on Availability)
                                                                    • 16.2.13 The Boeing Company
                                                                      • 16.2.13.1. Overview
                                                                      • 16.2.13.2. Products
                                                                      • 16.2.13.3. SWOT Analysis
                                                                      • 16.2.13.4. Recent Developments
                                                                      • 16.2.13.5. Financials (Based on Availability)
                                                                    • 16.2.14 Teledyne FLIR LLC
                                                                      • 16.2.14.1. Overview
                                                                      • 16.2.14.2. Products
                                                                      • 16.2.14.3. SWOT Analysis
                                                                      • 16.2.14.4. Recent Developments
                                                                      • 16.2.14.5. Financials (Based on Availability)

                                                              List of Figures

                                                              1. Figure 1: Global Autonomous Systems Industry Revenue Breakdown (Million, %) by Region 2024 & 2032
                                                              2. Figure 2: North America Autonomous Systems Industry Revenue (Million), by Country 2024 & 2032
                                                              3. Figure 3: North America Autonomous Systems Industry Revenue Share (%), by Country 2024 & 2032
                                                              4. Figure 4: Europe Autonomous Systems Industry Revenue (Million), by Country 2024 & 2032
                                                              5. Figure 5: Europe Autonomous Systems Industry Revenue Share (%), by Country 2024 & 2032
                                                              6. Figure 6: Asia Pacific Autonomous Systems Industry Revenue (Million), by Country 2024 & 2032
                                                              7. Figure 7: Asia Pacific Autonomous Systems Industry Revenue Share (%), by Country 2024 & 2032
                                                              8. Figure 8: Latin America Autonomous Systems Industry Revenue (Million), by Country 2024 & 2032
                                                              9. Figure 9: Latin America Autonomous Systems Industry Revenue Share (%), by Country 2024 & 2032
                                                              10. Figure 10: Middle East and Africa Autonomous Systems Industry Revenue (Million), by Country 2024 & 2032
                                                              11. Figure 11: Middle East and Africa Autonomous Systems Industry Revenue Share (%), by Country 2024 & 2032
                                                              12. Figure 12: North America Autonomous Systems Industry Revenue (Million), by Production Analysis 2024 & 2032
                                                              13. Figure 13: North America Autonomous Systems Industry Revenue Share (%), by Production Analysis 2024 & 2032
                                                              14. Figure 14: North America Autonomous Systems Industry Revenue (Million), by Consumption Analysis 2024 & 2032
                                                              15. Figure 15: North America Autonomous Systems Industry Revenue Share (%), by Consumption Analysis 2024 & 2032
                                                              16. Figure 16: North America Autonomous Systems Industry Revenue (Million), by Import Market Analysis (Value & Volume) 2024 & 2032
                                                              17. Figure 17: North America Autonomous Systems Industry Revenue Share (%), by Import Market Analysis (Value & Volume) 2024 & 2032
                                                              18. Figure 18: North America Autonomous Systems Industry Revenue (Million), by Export Market Analysis (Value & Volume) 2024 & 2032
                                                              19. Figure 19: North America Autonomous Systems Industry Revenue Share (%), by Export Market Analysis (Value & Volume) 2024 & 2032
                                                              20. Figure 20: North America Autonomous Systems Industry Revenue (Million), by Price Trend Analysis 2024 & 2032
                                                              21. Figure 21: North America Autonomous Systems Industry Revenue Share (%), by Price Trend Analysis 2024 & 2032
                                                              22. Figure 22: North America Autonomous Systems Industry Revenue (Million), by Country 2024 & 2032
                                                              23. Figure 23: North America Autonomous Systems Industry Revenue Share (%), by Country 2024 & 2032
                                                              24. Figure 24: South America Autonomous Systems Industry Revenue (Million), by Production Analysis 2024 & 2032
                                                              25. Figure 25: South America Autonomous Systems Industry Revenue Share (%), by Production Analysis 2024 & 2032
                                                              26. Figure 26: South America Autonomous Systems Industry Revenue (Million), by Consumption Analysis 2024 & 2032
                                                              27. Figure 27: South America Autonomous Systems Industry Revenue Share (%), by Consumption Analysis 2024 & 2032
                                                              28. Figure 28: South America Autonomous Systems Industry Revenue (Million), by Import Market Analysis (Value & Volume) 2024 & 2032
                                                              29. Figure 29: South America Autonomous Systems Industry Revenue Share (%), by Import Market Analysis (Value & Volume) 2024 & 2032
                                                              30. Figure 30: South America Autonomous Systems Industry Revenue (Million), by Export Market Analysis (Value & Volume) 2024 & 2032
                                                              31. Figure 31: South America Autonomous Systems Industry Revenue Share (%), by Export Market Analysis (Value & Volume) 2024 & 2032
                                                              32. Figure 32: South America Autonomous Systems Industry Revenue (Million), by Price Trend Analysis 2024 & 2032
                                                              33. Figure 33: South America Autonomous Systems Industry Revenue Share (%), by Price Trend Analysis 2024 & 2032
                                                              34. Figure 34: South America Autonomous Systems Industry Revenue (Million), by Country 2024 & 2032
                                                              35. Figure 35: South America Autonomous Systems Industry Revenue Share (%), by Country 2024 & 2032
                                                              36. Figure 36: Europe Autonomous Systems Industry Revenue (Million), by Production Analysis 2024 & 2032
                                                              37. Figure 37: Europe Autonomous Systems Industry Revenue Share (%), by Production Analysis 2024 & 2032
                                                              38. Figure 38: Europe Autonomous Systems Industry Revenue (Million), by Consumption Analysis 2024 & 2032
                                                              39. Figure 39: Europe Autonomous Systems Industry Revenue Share (%), by Consumption Analysis 2024 & 2032
                                                              40. Figure 40: Europe Autonomous Systems Industry Revenue (Million), by Import Market Analysis (Value & Volume) 2024 & 2032
                                                              41. Figure 41: Europe Autonomous Systems Industry Revenue Share (%), by Import Market Analysis (Value & Volume) 2024 & 2032
                                                              42. Figure 42: Europe Autonomous Systems Industry Revenue (Million), by Export Market Analysis (Value & Volume) 2024 & 2032
                                                              43. Figure 43: Europe Autonomous Systems Industry Revenue Share (%), by Export Market Analysis (Value & Volume) 2024 & 2032
                                                              44. Figure 44: Europe Autonomous Systems Industry Revenue (Million), by Price Trend Analysis 2024 & 2032
                                                              45. Figure 45: Europe Autonomous Systems Industry Revenue Share (%), by Price Trend Analysis 2024 & 2032
                                                              46. Figure 46: Europe Autonomous Systems Industry Revenue (Million), by Country 2024 & 2032
                                                              47. Figure 47: Europe Autonomous Systems Industry Revenue Share (%), by Country 2024 & 2032
                                                              48. Figure 48: Middle East & Africa Autonomous Systems Industry Revenue (Million), by Production Analysis 2024 & 2032
                                                              49. Figure 49: Middle East & Africa Autonomous Systems Industry Revenue Share (%), by Production Analysis 2024 & 2032
                                                              50. Figure 50: Middle East & Africa Autonomous Systems Industry Revenue (Million), by Consumption Analysis 2024 & 2032
                                                              51. Figure 51: Middle East & Africa Autonomous Systems Industry Revenue Share (%), by Consumption Analysis 2024 & 2032
                                                              52. Figure 52: Middle East & Africa Autonomous Systems Industry Revenue (Million), by Import Market Analysis (Value & Volume) 2024 & 2032
                                                              53. Figure 53: Middle East & Africa Autonomous Systems Industry Revenue Share (%), by Import Market Analysis (Value & Volume) 2024 & 2032
                                                              54. Figure 54: Middle East & Africa Autonomous Systems Industry Revenue (Million), by Export Market Analysis (Value & Volume) 2024 & 2032
                                                              55. Figure 55: Middle East & Africa Autonomous Systems Industry Revenue Share (%), by Export Market Analysis (Value & Volume) 2024 & 2032
                                                              56. Figure 56: Middle East & Africa Autonomous Systems Industry Revenue (Million), by Price Trend Analysis 2024 & 2032
                                                              57. Figure 57: Middle East & Africa Autonomous Systems Industry Revenue Share (%), by Price Trend Analysis 2024 & 2032
                                                              58. Figure 58: Middle East & Africa Autonomous Systems Industry Revenue (Million), by Country 2024 & 2032
                                                              59. Figure 59: Middle East & Africa Autonomous Systems Industry Revenue Share (%), by Country 2024 & 2032
                                                              60. Figure 60: Asia Pacific Autonomous Systems Industry Revenue (Million), by Production Analysis 2024 & 2032
                                                              61. Figure 61: Asia Pacific Autonomous Systems Industry Revenue Share (%), by Production Analysis 2024 & 2032
                                                              62. Figure 62: Asia Pacific Autonomous Systems Industry Revenue (Million), by Consumption Analysis 2024 & 2032
                                                              63. Figure 63: Asia Pacific Autonomous Systems Industry Revenue Share (%), by Consumption Analysis 2024 & 2032
                                                              64. Figure 64: Asia Pacific Autonomous Systems Industry Revenue (Million), by Import Market Analysis (Value & Volume) 2024 & 2032
                                                              65. Figure 65: Asia Pacific Autonomous Systems Industry Revenue Share (%), by Import Market Analysis (Value & Volume) 2024 & 2032
                                                              66. Figure 66: Asia Pacific Autonomous Systems Industry Revenue (Million), by Export Market Analysis (Value & Volume) 2024 & 2032
                                                              67. Figure 67: Asia Pacific Autonomous Systems Industry Revenue Share (%), by Export Market Analysis (Value & Volume) 2024 & 2032
                                                              68. Figure 68: Asia Pacific Autonomous Systems Industry Revenue (Million), by Price Trend Analysis 2024 & 2032
                                                              69. Figure 69: Asia Pacific Autonomous Systems Industry Revenue Share (%), by Price Trend Analysis 2024 & 2032
                                                              70. Figure 70: Asia Pacific Autonomous Systems Industry Revenue (Million), by Country 2024 & 2032
                                                              71. Figure 71: Asia Pacific Autonomous Systems Industry Revenue Share (%), by Country 2024 & 2032

                                                              List of Tables

                                                              1. Table 1: Global Autonomous Systems Industry Revenue Million Forecast, by Region 2019 & 2032
                                                              2. Table 2: Global Autonomous Systems Industry Revenue Million Forecast, by Production Analysis 2019 & 2032
                                                              3. Table 3: Global Autonomous Systems Industry Revenue Million Forecast, by Consumption Analysis 2019 & 2032
                                                              4. Table 4: Global Autonomous Systems Industry Revenue Million Forecast, by Import Market Analysis (Value & Volume) 2019 & 2032
                                                              5. Table 5: Global Autonomous Systems Industry Revenue Million Forecast, by Export Market Analysis (Value & Volume) 2019 & 2032
                                                              6. Table 6: Global Autonomous Systems Industry Revenue Million Forecast, by Price Trend Analysis 2019 & 2032
                                                              7. Table 7: Global Autonomous Systems Industry Revenue Million Forecast, by Region 2019 & 2032
                                                              8. Table 8: Global Autonomous Systems Industry Revenue Million Forecast, by Country 2019 & 2032
                                                              9. Table 9: United States Autonomous Systems Industry Revenue (Million) Forecast, by Application 2019 & 2032
                                                              10. Table 10: Canada Autonomous Systems Industry Revenue (Million) Forecast, by Application 2019 & 2032
                                                              11. Table 11: Global Autonomous Systems Industry Revenue Million Forecast, by Country 2019 & 2032
                                                              12. Table 12: Germany Autonomous Systems Industry Revenue (Million) Forecast, by Application 2019 & 2032
                                                              13. Table 13: United Kingdom Autonomous Systems Industry Revenue (Million) Forecast, by Application 2019 & 2032
                                                              14. Table 14: France Autonomous Systems Industry Revenue (Million) Forecast, by Application 2019 & 2032
                                                              15. Table 15: Russia Autonomous Systems Industry Revenue (Million) Forecast, by Application 2019 & 2032
                                                              16. Table 16: Rest of Europe Autonomous Systems Industry Revenue (Million) Forecast, by Application 2019 & 2032
                                                              17. Table 17: Global Autonomous Systems Industry Revenue Million Forecast, by Country 2019 & 2032
                                                              18. Table 18: China Autonomous Systems Industry Revenue (Million) Forecast, by Application 2019 & 2032
                                                              19. Table 19: India Autonomous Systems Industry Revenue (Million) Forecast, by Application 2019 & 2032
                                                              20. Table 20: South Korea Autonomous Systems Industry Revenue (Million) Forecast, by Application 2019 & 2032
                                                              21. Table 21: Japan Autonomous Systems Industry Revenue (Million) Forecast, by Application 2019 & 2032
                                                              22. Table 22: Rest of Asia Pacific Autonomous Systems Industry Revenue (Million) Forecast, by Application 2019 & 2032
                                                              23. Table 23: Global Autonomous Systems Industry Revenue Million Forecast, by Country 2019 & 2032
                                                              24. Table 24: Brazil Autonomous Systems Industry Revenue (Million) Forecast, by Application 2019 & 2032
                                                              25. Table 25: Rest of Latin America Autonomous Systems Industry Revenue (Million) Forecast, by Application 2019 & 2032
                                                              26. Table 26: Global Autonomous Systems Industry Revenue Million Forecast, by Country 2019 & 2032
                                                              27. Table 27: United Arab Emirates Autonomous Systems Industry Revenue (Million) Forecast, by Application 2019 & 2032
                                                              28. Table 28: Saudi Arabia Autonomous Systems Industry Revenue (Million) Forecast, by Application 2019 & 2032
                                                              29. Table 29: Rest of Middle East and Africa Autonomous Systems Industry Revenue (Million) Forecast, by Application 2019 & 2032
                                                              30. Table 30: Global Autonomous Systems Industry Revenue Million Forecast, by Production Analysis 2019 & 2032
                                                              31. Table 31: Global Autonomous Systems Industry Revenue Million Forecast, by Consumption Analysis 2019 & 2032
                                                              32. Table 32: Global Autonomous Systems Industry Revenue Million Forecast, by Import Market Analysis (Value & Volume) 2019 & 2032
                                                              33. Table 33: Global Autonomous Systems Industry Revenue Million Forecast, by Export Market Analysis (Value & Volume) 2019 & 2032
                                                              34. Table 34: Global Autonomous Systems Industry Revenue Million Forecast, by Price Trend Analysis 2019 & 2032
                                                              35. Table 35: Global Autonomous Systems Industry Revenue Million Forecast, by Country 2019 & 2032
                                                              36. Table 36: United States Autonomous Systems Industry Revenue (Million) Forecast, by Application 2019 & 2032
                                                              37. Table 37: Canada Autonomous Systems Industry Revenue (Million) Forecast, by Application 2019 & 2032
                                                              38. Table 38: Mexico Autonomous Systems Industry Revenue (Million) Forecast, by Application 2019 & 2032
                                                              39. Table 39: Global Autonomous Systems Industry Revenue Million Forecast, by Production Analysis 2019 & 2032
                                                              40. Table 40: Global Autonomous Systems Industry Revenue Million Forecast, by Consumption Analysis 2019 & 2032
                                                              41. Table 41: Global Autonomous Systems Industry Revenue Million Forecast, by Import Market Analysis (Value & Volume) 2019 & 2032
                                                              42. Table 42: Global Autonomous Systems Industry Revenue Million Forecast, by Export Market Analysis (Value & Volume) 2019 & 2032
                                                              43. Table 43: Global Autonomous Systems Industry Revenue Million Forecast, by Price Trend Analysis 2019 & 2032
                                                              44. Table 44: Global Autonomous Systems Industry Revenue Million Forecast, by Country 2019 & 2032
                                                              45. Table 45: Brazil Autonomous Systems Industry Revenue (Million) Forecast, by Application 2019 & 2032
                                                              46. Table 46: Argentina Autonomous Systems Industry Revenue (Million) Forecast, by Application 2019 & 2032
                                                              47. Table 47: Rest of South America Autonomous Systems Industry Revenue (Million) Forecast, by Application 2019 & 2032
                                                              48. Table 48: Global Autonomous Systems Industry Revenue Million Forecast, by Production Analysis 2019 & 2032
                                                              49. Table 49: Global Autonomous Systems Industry Revenue Million Forecast, by Consumption Analysis 2019 & 2032
                                                              50. Table 50: Global Autonomous Systems Industry Revenue Million Forecast, by Import Market Analysis (Value & Volume) 2019 & 2032
                                                              51. Table 51: Global Autonomous Systems Industry Revenue Million Forecast, by Export Market Analysis (Value & Volume) 2019 & 2032
                                                              52. Table 52: Global Autonomous Systems Industry Revenue Million Forecast, by Price Trend Analysis 2019 & 2032
                                                              53. Table 53: Global Autonomous Systems Industry Revenue Million Forecast, by Country 2019 & 2032
                                                              54. Table 54: United Kingdom Autonomous Systems Industry Revenue (Million) Forecast, by Application 2019 & 2032
                                                              55. Table 55: Germany Autonomous Systems Industry Revenue (Million) Forecast, by Application 2019 & 2032
                                                              56. Table 56: France Autonomous Systems Industry Revenue (Million) Forecast, by Application 2019 & 2032
                                                              57. Table 57: Italy Autonomous Systems Industry Revenue (Million) Forecast, by Application 2019 & 2032
                                                              58. Table 58: Spain Autonomous Systems Industry Revenue (Million) Forecast, by Application 2019 & 2032
                                                              59. Table 59: Russia Autonomous Systems Industry Revenue (Million) Forecast, by Application 2019 & 2032
                                                              60. Table 60: Benelux Autonomous Systems Industry Revenue (Million) Forecast, by Application 2019 & 2032
                                                              61. Table 61: Nordics Autonomous Systems Industry Revenue (Million) Forecast, by Application 2019 & 2032
                                                              62. Table 62: Rest of Europe Autonomous Systems Industry Revenue (Million) Forecast, by Application 2019 & 2032
                                                              63. Table 63: Global Autonomous Systems Industry Revenue Million Forecast, by Production Analysis 2019 & 2032
                                                              64. Table 64: Global Autonomous Systems Industry Revenue Million Forecast, by Consumption Analysis 2019 & 2032
                                                              65. Table 65: Global Autonomous Systems Industry Revenue Million Forecast, by Import Market Analysis (Value & Volume) 2019 & 2032
                                                              66. Table 66: Global Autonomous Systems Industry Revenue Million Forecast, by Export Market Analysis (Value & Volume) 2019 & 2032
                                                              67. Table 67: Global Autonomous Systems Industry Revenue Million Forecast, by Price Trend Analysis 2019 & 2032
                                                              68. Table 68: Global Autonomous Systems Industry Revenue Million Forecast, by Country 2019 & 2032
                                                              69. Table 69: Turkey Autonomous Systems Industry Revenue (Million) Forecast, by Application 2019 & 2032
                                                              70. Table 70: Israel Autonomous Systems Industry Revenue (Million) Forecast, by Application 2019 & 2032
                                                              71. Table 71: GCC Autonomous Systems Industry Revenue (Million) Forecast, by Application 2019 & 2032
                                                              72. Table 72: North Africa Autonomous Systems Industry Revenue (Million) Forecast, by Application 2019 & 2032
                                                              73. Table 73: South Africa Autonomous Systems Industry Revenue (Million) Forecast, by Application 2019 & 2032
                                                              74. Table 74: Rest of Middle East & Africa Autonomous Systems Industry Revenue (Million) Forecast, by Application 2019 & 2032
                                                              75. Table 75: Global Autonomous Systems Industry Revenue Million Forecast, by Production Analysis 2019 & 2032
                                                              76. Table 76: Global Autonomous Systems Industry Revenue Million Forecast, by Consumption Analysis 2019 & 2032
                                                              77. Table 77: Global Autonomous Systems Industry Revenue Million Forecast, by Import Market Analysis (Value & Volume) 2019 & 2032
                                                              78. Table 78: Global Autonomous Systems Industry Revenue Million Forecast, by Export Market Analysis (Value & Volume) 2019 & 2032
                                                              79. Table 79: Global Autonomous Systems Industry Revenue Million Forecast, by Price Trend Analysis 2019 & 2032
                                                              80. Table 80: Global Autonomous Systems Industry Revenue Million Forecast, by Country 2019 & 2032
                                                              81. Table 81: China Autonomous Systems Industry Revenue (Million) Forecast, by Application 2019 & 2032
                                                              82. Table 82: India Autonomous Systems Industry Revenue (Million) Forecast, by Application 2019 & 2032
                                                              83. Table 83: Japan Autonomous Systems Industry Revenue (Million) Forecast, by Application 2019 & 2032
                                                              84. Table 84: South Korea Autonomous Systems Industry Revenue (Million) Forecast, by Application 2019 & 2032
                                                              85. Table 85: ASEAN Autonomous Systems Industry Revenue (Million) Forecast, by Application 2019 & 2032
                                                              86. Table 86: Oceania Autonomous Systems Industry Revenue (Million) Forecast, by Application 2019 & 2032
                                                              87. Table 87: Rest of Asia Pacific Autonomous Systems Industry Revenue (Million) Forecast, by Application 2019 & 2032


                                                              Frequently Asked Questions

                                                              1. What is the projected Compound Annual Growth Rate (CAGR) of the Autonomous Systems Industry?

                                                              The projected CAGR is approximately 13.33%.

                                                              2. Which companies are prominent players in the Autonomous Systems Industry?

                                                              Key companies in the market include L3Harris Technologies Inc, General Dynamics Corporation, SZ DJI Technology Co Lt, Rheinmetall AG, Lockheed Martin Corporation, Elbit Systems Ltd, ECA Group, QinetiQ Group, BAE Systems PLC, Israel Aerospace Industries Ltd, Northrop Grumman Corporation, Saab AB, The Boeing Company, Teledyne FLIR LLC.

                                                              3. What are the main segments of the Autonomous Systems Industry?

                                                              The market segments include Production Analysis, Consumption Analysis, Import Market Analysis (Value & Volume), Export Market Analysis (Value & Volume), Price Trend Analysis.

                                                              4. Can you provide details about the market size?

                                                              The market size is estimated to be USD 22.07 Million as of 2022.

                                                              5. What are some drivers contributing to market growth?

                                                              ; Increasing Number Of Air Passengers; Use Of Portable Electronic Devices.

                                                              6. What are the notable trends driving market growth?

                                                              The Unmanned Aerial Vehicles Segment to Witness the Highest Growth During the Forecast Period.

                                                              7. Are there any restraints impacting market growth?

                                                              ; High Cost Of Connectivity Equipments.

                                                              8. Can you provide examples of recent developments in the market?

                                                              N/A

                                                              9. What pricing options are available for accessing the report?

                                                              Pricing options include single-user, multi-user, and enterprise licenses priced at USD 4750, USD 5250, and USD 8750 respectively.

                                                              10. Is the market size provided in terms of value or volume?

                                                              The market size is provided in terms of value, measured in Million.

                                                              11. Are there any specific market keywords associated with the report?

                                                              Yes, the market keyword associated with the report is "Autonomous Systems Industry," which aids in identifying and referencing the specific market segment covered.

                                                              12. How do I determine which pricing option suits my needs best?

                                                              The pricing options vary based on user requirements and access needs. Individual users may opt for single-user licenses, while businesses requiring broader access may choose multi-user or enterprise licenses for cost-effective access to the report.

                                                              13. Are there any additional resources or data provided in the Autonomous Systems Industry report?

                                                              While the report offers comprehensive insights, it's advisable to review the specific contents or supplementary materials provided to ascertain if additional resources or data are available.

                                                              14. How can I stay updated on further developments or reports in the Autonomous Systems Industry?

                                                              To stay informed about further developments, trends, and reports in the Autonomous Systems Industry, consider subscribing to industry newsletters, following relevant companies and organizations, or regularly checking reputable industry news sources and publications.


                                                              Methodology

                                                              Step 1 - Identification of Relevant Samples Size from Population Database

                                                              Step Chart
                                                              Bar Chart
                                                              Method Chart

                                                              Step 2 - Approaches for Defining Global Market Size (Value, Volume* & Price*)

                                                              Approach Chart
                                                              Top-down and bottom-up approaches are used to validate the global market size and estimate the market size for manufactures, regional segments, product, and application.

                                                              Note*: In applicable scenarios

                                                              Step 3 - Data Sources

                                                              Primary Research

                                                              • Web Analytics
                                                              • Survey Reports
                                                              • Research Institute
                                                              • Latest Research Reports
                                                              • Opinion Leaders

                                                              Secondary Research

                                                              • Annual Reports
                                                              • White Paper
                                                              • Latest Press Release
                                                              • Industry Association
                                                              • Paid Database
                                                              • Investor Presentations
                                                              Analyst Chart

                                                              Step 4 - Data Triangulation

                                                              Involves using different sources of information in order to increase the validity of a study

                                                              These sources are likely to be stakeholders in a program - participants, other researchers, program staff, other community members, and so on.

                                                              Then we put all data in single framework & apply various statistical tools to find out the dynamic on the market.

                                                              During the analysis stage, feedback from the stakeholder groups would be compared to determine areas of agreement as well as areas of divergence

                                                              Additionally, after gathering mixed and scattered data from a wide range of sources, data is triangulated and correlated to come up with estimated figures which are further validated through primary mediums or industry experts, opinion leaders.

                                                              About Research Axiom

                                                              Research Axiom delivers in-depth market research, industry analysis, and consulting for pharmaceuticals, automotive, IT, and consumer goods. Our reports provide the clarity you need to make informed decisions and drive innovation.

                                                              Our team combines primary research, advanced analytics, and sector expertise to deliver actionable intelligence. We offer syndicated reports, custom research, and consulting services tailored to your business needs.

                                                              At Research Axiom, we are committed to quality, transparency, and client satisfaction. Every report is rigorously validated to ensure accuracy and relevance. Our global perspective and local expertise help you understand both the big picture and the finer details of your market.

                                                              Stay informed with Research Axiom. Subscribe to our newsletter for the latest updates and research highlights, and follow us on social media for real-time insights. Research Axiom – Turning Data into Business Advantage.

                                                              artwork spiralartwork spiralRelated Reports
                                                              artwork underline

                                                              Drivers of Change in Construction Drone Industry Market 2025-2033

                                                              The construction drone market is booming, projected to reach $6.89B by 2033, with an 8.14% CAGR. This comprehensive analysis explores market drivers, trends, restraints, key players (DJI, AeroVironment), and regional growth (MEA, North America). Discover the latest insights on fixed-wing vs. rotary-wing drones and their applications in construction, agriculture, and more.

                                                              June 2025
                                                              Base Year: 2024
                                                              No Of Pages: 234
                                                              Price: $4750

                                                              Autonomous Systems Industry Analysis 2025-2033: Unlocking Competitive Opportunities

                                                              The Autonomous Systems market is booming, projected to reach \$22.07 billion by 2025, with a 13.33% CAGR. Discover key drivers, trends, and restraints shaping this rapidly evolving industry, including UAVs, UGVs, and unmanned sea systems across military, commercial, and law enforcement sectors. Explore market segmentation, leading companies, and regional growth projections for 2025-2033.

                                                              June 2025
                                                              Base Year: 2024
                                                              No Of Pages: 234
                                                              Price: $4750

                                                              Europe Military Unmanned Vehicles Industry Projected to Grow at XX CAGR: Insights and Forecasts 2025-2033

                                                              The European military unmanned vehicles market is booming, projected to exceed €X billion by 2033 with a CAGR of over 7%. This in-depth analysis explores market drivers, trends, restraints, key players (Airbus, Leonardo, BAE Systems), and regional growth, focusing on UAVs, UGVs, and unmanned maritime vehicles.

                                                              June 2025
                                                              Base Year: 2024
                                                              No Of Pages: 234
                                                              Price: $4750

                                                              North America Inspection Drones Industry Trends and Opportunities for Growth

                                                              Discover the booming North American inspection drone market! This report reveals a CAGR exceeding 12%, driven by increasing adoption across infrastructure, construction, and agriculture. Learn about key players, market trends, and future projections for this rapidly expanding sector. Get insights into market size, growth forecasts, and regional analysis.

                                                              June 2025
                                                              Base Year: 2024
                                                              No Of Pages: 234
                                                              Price: $4750

                                                              Business Address

                                                              Head Office

                                                              Office no. A 5010, fifth floor, Solitaire Business Hub, Near Phoenix mall, Pune, Maharashtra 411014

                                                              Contact Information

                                                              Craig Francis

                                                              Business Development Head

                                                              +17162654855

                                                              [email protected]

                                                              Connect With Us

                                                              Secure Payment Partners

                                                              payment image
                                                              RetailLogisticsPackagingAutomotiveHealthcareAgricultureEnergy & PowerFood & BeverageAerospace & DefenseChemicals & MaterialsHospitality and TourismAnimal Nutrition & WellnessConsumer Goods and ServicesReal Estate and ConstructionHome and Property ImprovementTechnology, Media and TelecomManufacturing Products and ServicesFinancial Services and Investment Intelligence

                                                              © 2025 All rights reserved


                                                              Privacy Policy
                                                              Terms and Conditions
                                                              FAQ
                                                              • Home
                                                              • About Us
                                                              • Industries
                                                                • Aerospace & Defense
                                                                • Agriculture
                                                                • Animal Nutrition & Wellness
                                                                • Automotive
                                                                • Chemicals & Materials
                                                                • Consumer Goods and Services
                                                                • Energy & Power
                                                                • Financial Services and Investment Intelligence
                                                                • Food & Beverage
                                                                • Home and Property Improvement
                                                                • Hospitality and Tourism
                                                                • Logistics
                                                                • Manufacturing Products and Services
                                                                • Packaging
                                                                • Professional and Commercial Services
                                                                • Real Estate and Construction
                                                                • Retail
                                                                • Technology, Media and Telecom
                                                                • Healthcare
                                                              • Services
                                                              • Contact
                                                              Main Logo
                                                              • Home
                                                              • About Us
                                                              • Industries
                                                                • Aerospace & Defense
                                                                • Agriculture
                                                                • Animal Nutrition & Wellness
                                                                • Automotive
                                                                • Chemicals & Materials
                                                                • Consumer Goods and Services
                                                                • Energy & Power
                                                                • Financial Services and Investment Intelligence
                                                                • Food & Beverage
                                                                • Home and Property Improvement
                                                                • Hospitality and Tourism
                                                                • Logistics
                                                                • Manufacturing Products and Services
                                                                • Packaging
                                                                • Professional and Commercial Services
                                                                • Real Estate and Construction
                                                                • Retail
                                                                • Technology, Media and Telecom
                                                                • Healthcare
                                                              • Services
                                                              • Contact
                                                              +17162654855
                                                              [email protected]

                                                              +17162654855

                                                              [email protected]