Key Insights
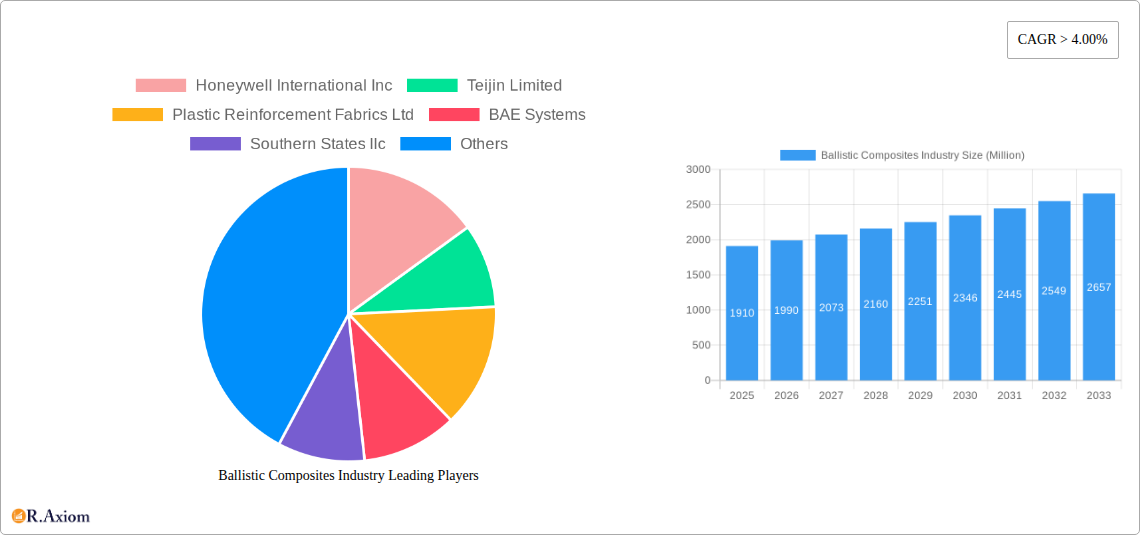
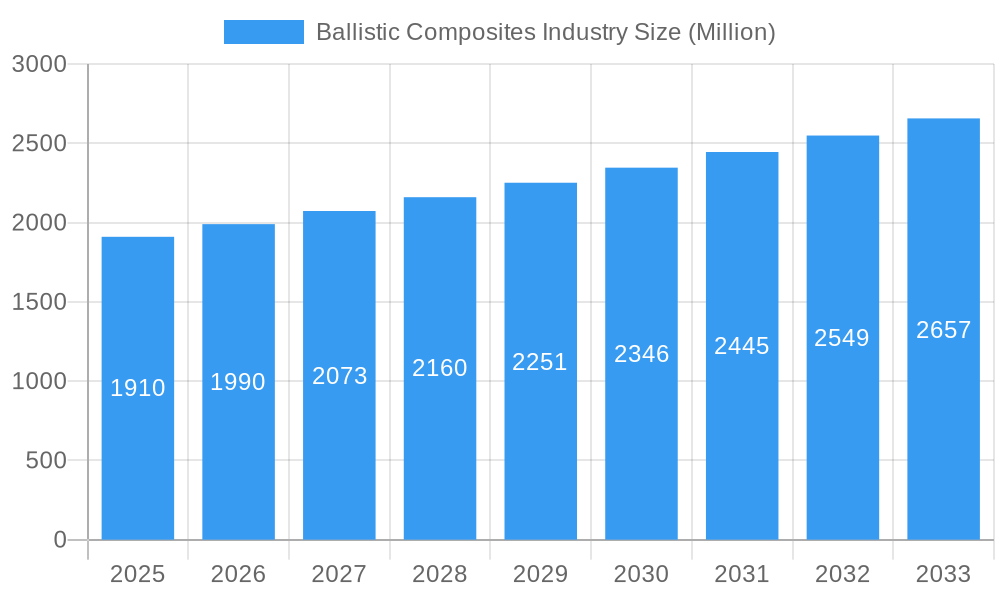
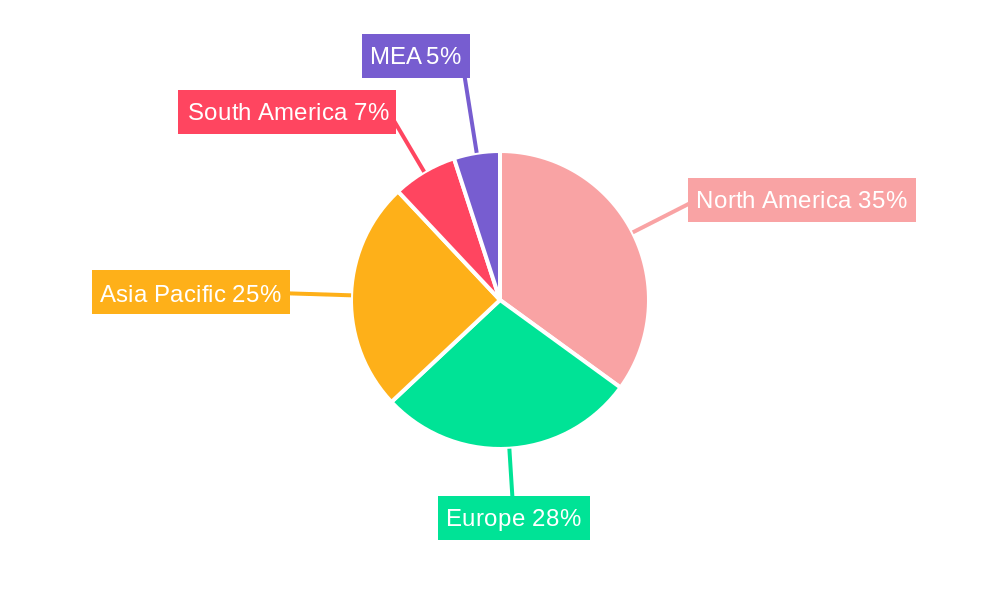
The ballistic composites market, valued at $1.91 billion in 2025, is projected to experience robust growth, driven by a Compound Annual Growth Rate (CAGR) exceeding 4% through 2033. This expansion is fueled by increasing demand for advanced protective solutions across diverse sectors. The rising prevalence of global conflicts and terrorism significantly boosts the demand for body armor and vehicle protection systems. Furthermore, the growing adoption of ballistic composites in high-performance sporting goods, such as helmets and protective gear, contributes to market expansion. Technological advancements in fiber types, like the development of stronger and lighter bio-based fibers and nanocomposites, are further driving innovation and market growth. The market is segmented by fiber type (aramids, UHMWPE, S-glass, others), matrix type (polymer, polymer-ceramic, metal), and application (vehicle armor, body armor, helmets, other applications). While advancements fuel growth, challenges such as the high cost of advanced materials and stringent regulatory requirements present potential restraints. The regional landscape shows a strong presence in North America and Europe, driven by established defense industries and robust research & development initiatives. However, the Asia-Pacific region is poised for significant growth due to increasing military expenditure and industrialization in key economies like China and India.
Ballistic Composites Industry Market Size (In Billion)
The competitive landscape is characterized by a mix of established players like Honeywell International Inc., Teijin Limited, and DuPont, alongside specialized manufacturers like MKU Limited and Gaffco Ballistics. These companies are focusing on product innovation, strategic partnerships, and geographic expansion to strengthen their market positions. Future growth will likely be influenced by government investments in defense technologies, technological breakthroughs in material science, and increasing awareness of personal safety and security. The market's growth trajectory reflects a confluence of geopolitical factors, technological advancements, and evolving consumer demands for superior protective equipment. The ongoing evolution of ballistic composites is set to shape the future of protective solutions across various industries for the foreseeable future.
Ballistic Composites Industry Company Market Share
Ballistic Composites Industry: A Comprehensive Market Report (2019-2033)
This comprehensive report provides a detailed analysis of the Ballistic Composites industry, encompassing market size, growth projections, segmentation, key players, and future trends. The study period covers 2019-2033, with 2025 as the base and estimated year. The report offers actionable insights for industry stakeholders, including manufacturers, suppliers, distributors, and investors. With a focus on innovation, market dynamics, and competitive landscape, this report is an essential resource for understanding and navigating this rapidly evolving market. The total market size in 2025 is estimated at $XX Million, projected to reach $XX Million by 2033, exhibiting a CAGR of XX%.
Ballistic Composites Industry Market Concentration & Innovation
The Ballistic Composites industry exhibits a moderately concentrated market structure, with a few major players holding significant market share. Honeywell International Inc., Teijin Limited, and DuPont are among the dominant players, collectively accounting for approximately XX% of the global market in 2025. However, several smaller companies and specialized manufacturers contribute significantly to specific segments.
- Market Share: Honeywell International Inc. (XX%), Teijin Limited (XX%), DuPont (XX%), Others (XX%).
- M&A Activity: The industry has witnessed moderate M&A activity in recent years, with deal values ranging from $XX Million to $XX Million. These activities are primarily driven by the need to expand product portfolios, enhance technological capabilities, and access new markets. (Specific M&A details available in the full report.)
- Innovation Drivers: Key drivers of innovation include advancements in fiber technology (e.g., bio-based fibers, nanocomposites), development of novel matrix materials (e.g., polymer-ceramic composites), and integration of advanced manufacturing techniques.
- Regulatory Frameworks: Stringent safety and performance standards, especially in defense and aerospace applications, significantly influence product development and market access. Compliance with these standards is a crucial factor for companies operating in this sector.
- Product Substitutes: While ballistic composites offer a unique combination of strength and lightweight properties, alternative materials like steel and ceramic are used in certain applications depending on specific requirements.
- End-User Trends: Increasing demand for lightweight, high-performance armor in defense, law enforcement, and other security sectors is a primary driver for market growth.
Ballistic Composites Industry Industry Trends & Insights
The Ballistic Composites market is characterized by robust growth, driven by increasing demand from diverse end-use sectors. The market is witnessing a shift towards lighter, more flexible, and comfortable ballistic protection solutions, particularly in body armor applications. Technological advancements in fiber types, matrix materials, and manufacturing processes are contributing to improvements in performance and cost-effectiveness.
The CAGR for the forecast period (2025-2033) is estimated at XX%, indicating a substantial expansion in market size. This growth is fueled by several factors, including rising global security concerns, technological innovations that enhance material properties, and increasing adoption of ballistic protection in various industries, from defense and law enforcement to civil infrastructure protection. Market penetration of advanced materials like UHMWPE is increasing gradually, replacing traditional materials in several applications. The competitive landscape is characterized by both intense competition among established players and entry of new companies with innovative solutions. Consumer preferences are increasingly focused on superior protection, comfort, and enhanced mobility.
Dominant Markets & Segments in Ballistic Composites Industry
The North American market currently holds the largest share of the global Ballistic Composites market, followed by Europe and Asia-Pacific. This dominance is largely attributed to high military spending, strong law enforcement presence, and a significant focus on homeland security.
Key Drivers:
- North America: High defense expenditure, strong law enforcement presence, and advanced manufacturing capabilities.
- Europe: Significant military spending, growing demand for civilian security solutions, and presence of key manufacturers.
- Asia-Pacific: Rapid economic growth, rising security concerns, and increasing military modernization efforts.
Dominant Segments:
- Fiber Type: Aramids currently hold the largest market share due to their high strength-to-weight ratio and cost-effectiveness. However, UHMWPE is witnessing rapid growth owing to its superior ballistic performance.
- Matrix Type: Polymer matrices dominate the market due to their ease of processing and versatility. However, the use of Polymer-ceramic and Metal matrix composites is increasing for specialized applications demanding higher levels of protection.
- Application: Body armor constitutes the largest segment, followed by vehicle armor and helmet/face protection. The "Other Applications" segment is also growing, driven by increasing demand from various sectors including aerospace, marine, and high-performance sporting goods.
Ballistic Composites Industry Product Developments
The forefront of innovation in the ballistic composites industry is dedicated to elevating both protective capabilities and user experience. Recent product developments are heavily concentrated on achieving superior ballistic performance through advanced material science and engineering. Simultaneously, significant emphasis is placed on enhancing comfort and flexibility, crucial for prolonged wear and dynamic operational environments. This includes the development of significantly lighter, more breathable composite designs, contributing to improved user endurance and operational effectiveness. Furthermore, breakthroughs in material science are facilitating the creation of composites that are not only stronger and more resilient but also offer novel protective characteristics. A notable trend is the exploration and integration of bio-based fibers, promising the development of environmentally sustainable ballistic composites without compromising on their high-performance attributes. To meet the diverse and evolving demands of various end-users and applications, manufacturers are increasingly prioritizing modular and customizable product designs, allowing for tailored solutions.
Report Scope & Segmentation Analysis
This comprehensive market report meticulously segments the Ballistic Composites market into distinct categories to provide granular insights. The segmentation is based on key differentiating factors including: Fiber Type (Aramids, Ultra-High Molecular Weight Polyethylene (UHMWPE), S-glass, and Others), Matrix Type (Polymer, Polymer-ceramic, and Metal), and Application Areas (Vehicle Armor, Body Armor, Helmet and Face Protection, and Other Specialized Applications). For each of these segments, detailed growth projections are furnished, underpinned by an analysis of critical market drivers such as ongoing technological advancements, evolving regulatory landscapes, and prevailing market trends. The competitive dynamics within each specific segment are thoroughly examined to pinpoint emerging opportunities and inherent challenges. Precise market size estimations and historical and projected growth rates for all delineated segments are readily available within the full report.
Key Drivers of Ballistic Composites Industry Growth
The growth of the Ballistic Composites industry is fueled by several key factors: the increasing demand for advanced protective equipment in military and law enforcement sectors, the rising need for personal safety and security, and technological advancements leading to lighter, stronger, and more cost-effective materials. Governmental investments in defense and security infrastructure are also playing a significant role.
Challenges in the Ballistic Composites Industry Sector
The Ballistic Composites industry operates within a landscape marked by several significant challenges. A primary concern is the inherently high cost associated with premium raw materials, particularly advanced reinforcing fibers, which can be a substantial barrier to wider adoption and profitability. Furthermore, the industry is susceptible to price volatility and fluctuations in the global supply of these essential raw materials. Stringent and evolving regulatory requirements across different regions necessitate continuous adaptation and investment in compliance. Intense market competition, both from established players and emerging innovators, exerts pressure on pricing and market share. The constant threat of evolving ballistic threats demands continuous research and development, posing a challenge to maintain a technological edge. Additionally, potential supply chain disruptions, whether geopolitical or logistical, can impact production timelines and availability. These multifaceted challenges collectively contribute to potential price volatility and can influence the overall growth trajectory of the market.
Emerging Opportunities in Ballistic Composites Industry
Emerging opportunities lie in the development and adoption of bio-based fibers, nanocomposites, and smart materials. Expanding applications into new sectors such as civil infrastructure protection and high-performance sports goods present significant growth potential. The customization of ballistic protection products to meet specific user requirements also represents a significant opportunity.
Leading Players in the Ballistic Composites Industry Market
- Honeywell International Inc
- Teijin Limited
- Plastic Reinforcement Fabrics Ltd
- BAE Systems
- Southern States llc
- Roihu Inc
- Barrday Inc
- TenCate Protective Fabrics
- MKU LIMITED
- Coherent Corp
- Integris
- Morgan Advanced Materials
- DSM
- DuPont
- Gaffco Ballistics
- Gurit Holding AG
- ArmorCore
Key Developments in Ballistic Composites Industry Industry
- November 2023: Integris Composites developed a new system of ballistic vest gear for law enforcement and military units and launched the company’s new Rapid Don/Doff body armor vests. This innovation reduces donning and doffing time by 50% or more, enhancing operational efficiency.
- November 2023: Integris Composites launched customizable ballistic shields and vests, "Stand 5 F009," at Milipol Paris, promoting a "make your own shield" concept. This highlights a trend toward personalized protective equipment.
Strategic Outlook for Ballistic Composites Industry Market
The Ballistic Composites industry is projected for a sustained period of robust growth, propelled by a confluence of factors including relentless technological innovation, escalating global demand for sophisticated protection solutions across defense, law enforcement, and civilian sectors, and the strategic expansion into novel and emerging applications. The future market landscape will be significantly shaped by the prevailing trend towards lightweight, ergonomically superior, and highly customizable composite products. Companies that proactively invest in cutting-edge research and development, champion sustainable manufacturing practices, and demonstrate agility in adapting to the dynamic needs of the evolving threat landscape and market demands, will be strategically positioned to capture market share and achieve long-term success.
Ballistic Composites Industry Segmentation
-
1. Fiber Type
- 1.1. Aramids
- 1.2. Ultra-high-molecular Weight Polyethylene (UHMWPE)
- 1.3. S-glass
- 1.4. Others F
-
2. Matrix Type
- 2.1. Polymer
- 2.2. Polymer-ceramic
- 2.3. Metal
-
3. Application
- 3.1. Vehicle Armor
- 3.2. Body Armor
- 3.3. Helmet and Face Protection
- 3.4. Other Ap
Ballistic Composites Industry Segmentation By Geography
-
1. Asia Pacific
- 1.1. China
- 1.2. India
- 1.3. Japan
- 1.4. South Korea
- 1.5. Rest of Asia Pacific
-
2. North America
- 2.1. United States
- 2.2. Canada
- 2.3. Mexico
-
3. Europe
- 3.1. Germany
- 3.2. United Kingdom
- 3.3. Italy
- 3.4. France
- 3.5. Spain
- 3.6. Rest of Europe
-
4. South America
- 4.1. Brazil
- 4.2. Argentina
- 4.3. Rest of South America
-
5. Middle East and Africa
- 5.1. Saudi Arabia
- 5.2. South Africa
- 5.3. Rest of Middle East and Africa
Ballistic Composites Industry Regional Market Share
Geographic Coverage of Ballistic Composites Industry
Ballistic Composites Industry REPORT HIGHLIGHTS
| Aspects | Details |
|---|---|
| Study Period | 2020-2034 |
| Base Year | 2025 |
| Estimated Year | 2026 |
| Forecast Period | 2026-2034 |
| Historical Period | 2020-2025 |
| Growth Rate | CAGR of > 4.00% from 2020-2034 |
| Segmentation |
|
Table of Contents
- 1. Introduction
- 1.1. Research Scope
- 1.2. Market Segmentation
- 1.3. Research Objective
- 1.4. Definitions and Assumptions
- 2. Executive Summary
- 2.1. Market Snapshot
- 3. Market Dynamics
- 3.1. Market Drivers
- 3.2. Market Restrains
- 3.3. Market Trends
- 3.4. Market Opportunities
- 4. Market Factor Analysis
- 4.1. Porters Five Forces
- 4.1.1. Bargaining Power of Suppliers
- 4.1.2. Bargaining Power of Buyers
- 4.1.3. Threat of New Entrants
- 4.1.4. Threat of Substitutes
- 4.1.5. Competitive Rivalry
- 4.2. PESTEL analysis
- 4.3. BCG Analysis
- 4.3.1. Stars (High Growth, High Market Share)
- 4.3.2. Cash Cows (Low Growth, High Market Share)
- 4.3.3. Question Mark (High Growth, Low Market Share)
- 4.3.4. Dogs (Low Growth, Low Market Share)
- 4.4. Ansoff Matrix Analysis
- 4.5. Supply Chain Analysis
- 4.6. Regulatory Landscape
- 4.7. Current Market Potential and Opportunity Assessment (TAM–SAM–SOM Framework)
- 4.8. RAX Analyst Note
- 4.1. Porters Five Forces
- 5. Market Analysis, Insights and Forecast 2021-2033
- 5.1. Market Analysis, Insights and Forecast - by Fiber Type
- 5.1.1. Aramids
- 5.1.2. Ultra-high-molecular Weight Polyethylene (UHMWPE)
- 5.1.3. S-glass
- 5.1.4. Others F
- 5.2. Market Analysis, Insights and Forecast - by Matrix Type
- 5.2.1. Polymer
- 5.2.2. Polymer-ceramic
- 5.2.3. Metal
- 5.3. Market Analysis, Insights and Forecast - by Application
- 5.3.1. Vehicle Armor
- 5.3.2. Body Armor
- 5.3.3. Helmet and Face Protection
- 5.3.4. Other Ap
- 5.4. Market Analysis, Insights and Forecast - by Region
- 5.4.1. Asia Pacific
- 5.4.2. North America
- 5.4.3. Europe
- 5.4.4. South America
- 5.4.5. Middle East and Africa
- 5.1. Market Analysis, Insights and Forecast - by Fiber Type
- 6. Global Ballistic Composites Industry Analysis, Insights and Forecast, 2021-2033
- 6.1. Market Analysis, Insights and Forecast - by Fiber Type
- 6.1.1. Aramids
- 6.1.2. Ultra-high-molecular Weight Polyethylene (UHMWPE)
- 6.1.3. S-glass
- 6.1.4. Others F
- 6.2. Market Analysis, Insights and Forecast - by Matrix Type
- 6.2.1. Polymer
- 6.2.2. Polymer-ceramic
- 6.2.3. Metal
- 6.3. Market Analysis, Insights and Forecast - by Application
- 6.3.1. Vehicle Armor
- 6.3.2. Body Armor
- 6.3.3. Helmet and Face Protection
- 6.3.4. Other Ap
- 6.1. Market Analysis, Insights and Forecast - by Fiber Type
- 7. Asia Pacific Ballistic Composites Industry Analysis, Insights and Forecast, 2020-2032
- 7.1. Market Analysis, Insights and Forecast - by Fiber Type
- 7.1.1. Aramids
- 7.1.2. Ultra-high-molecular Weight Polyethylene (UHMWPE)
- 7.1.3. S-glass
- 7.1.4. Others F
- 7.2. Market Analysis, Insights and Forecast - by Matrix Type
- 7.2.1. Polymer
- 7.2.2. Polymer-ceramic
- 7.2.3. Metal
- 7.3. Market Analysis, Insights and Forecast - by Application
- 7.3.1. Vehicle Armor
- 7.3.2. Body Armor
- 7.3.3. Helmet and Face Protection
- 7.3.4. Other Ap
- 7.1. Market Analysis, Insights and Forecast - by Fiber Type
- 8. North America Ballistic Composites Industry Analysis, Insights and Forecast, 2020-2032
- 8.1. Market Analysis, Insights and Forecast - by Fiber Type
- 8.1.1. Aramids
- 8.1.2. Ultra-high-molecular Weight Polyethylene (UHMWPE)
- 8.1.3. S-glass
- 8.1.4. Others F
- 8.2. Market Analysis, Insights and Forecast - by Matrix Type
- 8.2.1. Polymer
- 8.2.2. Polymer-ceramic
- 8.2.3. Metal
- 8.3. Market Analysis, Insights and Forecast - by Application
- 8.3.1. Vehicle Armor
- 8.3.2. Body Armor
- 8.3.3. Helmet and Face Protection
- 8.3.4. Other Ap
- 8.1. Market Analysis, Insights and Forecast - by Fiber Type
- 9. Europe Ballistic Composites Industry Analysis, Insights and Forecast, 2020-2032
- 9.1. Market Analysis, Insights and Forecast - by Fiber Type
- 9.1.1. Aramids
- 9.1.2. Ultra-high-molecular Weight Polyethylene (UHMWPE)
- 9.1.3. S-glass
- 9.1.4. Others F
- 9.2. Market Analysis, Insights and Forecast - by Matrix Type
- 9.2.1. Polymer
- 9.2.2. Polymer-ceramic
- 9.2.3. Metal
- 9.3. Market Analysis, Insights and Forecast - by Application
- 9.3.1. Vehicle Armor
- 9.3.2. Body Armor
- 9.3.3. Helmet and Face Protection
- 9.3.4. Other Ap
- 9.1. Market Analysis, Insights and Forecast - by Fiber Type
- 10. South America Ballistic Composites Industry Analysis, Insights and Forecast, 2020-2032
- 10.1. Market Analysis, Insights and Forecast - by Fiber Type
- 10.1.1. Aramids
- 10.1.2. Ultra-high-molecular Weight Polyethylene (UHMWPE)
- 10.1.3. S-glass
- 10.1.4. Others F
- 10.2. Market Analysis, Insights and Forecast - by Matrix Type
- 10.2.1. Polymer
- 10.2.2. Polymer-ceramic
- 10.2.3. Metal
- 10.3. Market Analysis, Insights and Forecast - by Application
- 10.3.1. Vehicle Armor
- 10.3.2. Body Armor
- 10.3.3. Helmet and Face Protection
- 10.3.4. Other Ap
- 10.1. Market Analysis, Insights and Forecast - by Fiber Type
- 11. Middle East and Africa Ballistic Composites Industry Analysis, Insights and Forecast, 2020-2032
- 11.1. Market Analysis, Insights and Forecast - by Fiber Type
- 11.1.1. Aramids
- 11.1.2. Ultra-high-molecular Weight Polyethylene (UHMWPE)
- 11.1.3. S-glass
- 11.1.4. Others F
- 11.2. Market Analysis, Insights and Forecast - by Matrix Type
- 11.2.1. Polymer
- 11.2.2. Polymer-ceramic
- 11.2.3. Metal
- 11.3. Market Analysis, Insights and Forecast - by Application
- 11.3.1. Vehicle Armor
- 11.3.2. Body Armor
- 11.3.3. Helmet and Face Protection
- 11.3.4. Other Ap
- 11.1. Market Analysis, Insights and Forecast - by Fiber Type
- 12. Competitive Analysis
- 12.1. Company Profiles
- 12.1.1 Honeywell International Inc
- 12.1.1.1. Company Overview
- 12.1.1.2. Products
- 12.1.1.3. Company Financials
- 12.1.1.4. SWOT Analysis
- 12.1.2 Teijin Limited
- 12.1.2.1. Company Overview
- 12.1.2.2. Products
- 12.1.2.3. Company Financials
- 12.1.2.4. SWOT Analysis
- 12.1.3 Plastic Reinforcement Fabrics Ltd
- 12.1.3.1. Company Overview
- 12.1.3.2. Products
- 12.1.3.3. Company Financials
- 12.1.3.4. SWOT Analysis
- 12.1.4 BAE Systems
- 12.1.4.1. Company Overview
- 12.1.4.2. Products
- 12.1.4.3. Company Financials
- 12.1.4.4. SWOT Analysis
- 12.1.5 Southern States llc
- 12.1.5.1. Company Overview
- 12.1.5.2. Products
- 12.1.5.3. Company Financials
- 12.1.5.4. SWOT Analysis
- 12.1.6 Roihu Inc
- 12.1.6.1. Company Overview
- 12.1.6.2. Products
- 12.1.6.3. Company Financials
- 12.1.6.4. SWOT Analysis
- 12.1.7 Barrday Inc
- 12.1.7.1. Company Overview
- 12.1.7.2. Products
- 12.1.7.3. Company Financials
- 12.1.7.4. SWOT Analysis
- 12.1.8 TenCate Protective Fabrics
- 12.1.8.1. Company Overview
- 12.1.8.2. Products
- 12.1.8.3. Company Financials
- 12.1.8.4. SWOT Analysis
- 12.1.9 MKU LIMITED
- 12.1.9.1. Company Overview
- 12.1.9.2. Products
- 12.1.9.3. Company Financials
- 12.1.9.4. SWOT Analysis
- 12.1.10 Coherent Corp
- 12.1.10.1. Company Overview
- 12.1.10.2. Products
- 12.1.10.3. Company Financials
- 12.1.10.4. SWOT Analysis
- 12.1.11 Integris
- 12.1.11.1. Company Overview
- 12.1.11.2. Products
- 12.1.11.3. Company Financials
- 12.1.11.4. SWOT Analysis
- 12.1.12 Morgan Advanced Materials
- 12.1.12.1. Company Overview
- 12.1.12.2. Products
- 12.1.12.3. Company Financials
- 12.1.12.4. SWOT Analysis
- 12.1.13 DSM
- 12.1.13.1. Company Overview
- 12.1.13.2. Products
- 12.1.13.3. Company Financials
- 12.1.13.4. SWOT Analysis
- 12.1.14 DuPont
- 12.1.14.1. Company Overview
- 12.1.14.2. Products
- 12.1.14.3. Company Financials
- 12.1.14.4. SWOT Analysis
- 12.1.15 Gaffco Ballistics
- 12.1.15.1. Company Overview
- 12.1.15.2. Products
- 12.1.15.3. Company Financials
- 12.1.15.4. SWOT Analysis
- 12.1.16 Gurit Holding AG
- 12.1.16.1. Company Overview
- 12.1.16.2. Products
- 12.1.16.3. Company Financials
- 12.1.16.4. SWOT Analysis
- 12.1.17 ArmorCore
- 12.1.17.1. Company Overview
- 12.1.17.2. Products
- 12.1.17.3. Company Financials
- 12.1.17.4. SWOT Analysis
- 12.1.1 Honeywell International Inc
- 12.2. Market Entropy
- 12.2.1 Company's Key Areas Served
- 12.2.2 Recent Developments
- 12.3. Company Market Share Analysis 2025
- 12.3.1 Top 5 Companies Market Share Analysis
- 12.3.2 Top 3 Companies Market Share Analysis
- 12.4. List of Potential Customers
- 13. Research Methodology
List of Figures
- Figure 1: Global Ballistic Composites Industry Revenue Breakdown (Million, %) by Region 2025 & 2033
- Figure 2: Global Ballistic Composites Industry Volume Breakdown (K Tons, %) by Region 2025 & 2033
- Figure 3: Asia Pacific Ballistic Composites Industry Revenue (Million), by Fiber Type 2025 & 2033
- Figure 4: Asia Pacific Ballistic Composites Industry Volume (K Tons), by Fiber Type 2025 & 2033
- Figure 5: Asia Pacific Ballistic Composites Industry Revenue Share (%), by Fiber Type 2025 & 2033
- Figure 6: Asia Pacific Ballistic Composites Industry Volume Share (%), by Fiber Type 2025 & 2033
- Figure 7: Asia Pacific Ballistic Composites Industry Revenue (Million), by Matrix Type 2025 & 2033
- Figure 8: Asia Pacific Ballistic Composites Industry Volume (K Tons), by Matrix Type 2025 & 2033
- Figure 9: Asia Pacific Ballistic Composites Industry Revenue Share (%), by Matrix Type 2025 & 2033
- Figure 10: Asia Pacific Ballistic Composites Industry Volume Share (%), by Matrix Type 2025 & 2033
- Figure 11: Asia Pacific Ballistic Composites Industry Revenue (Million), by Application 2025 & 2033
- Figure 12: Asia Pacific Ballistic Composites Industry Volume (K Tons), by Application 2025 & 2033
- Figure 13: Asia Pacific Ballistic Composites Industry Revenue Share (%), by Application 2025 & 2033
- Figure 14: Asia Pacific Ballistic Composites Industry Volume Share (%), by Application 2025 & 2033
- Figure 15: Asia Pacific Ballistic Composites Industry Revenue (Million), by Country 2025 & 2033
- Figure 16: Asia Pacific Ballistic Composites Industry Volume (K Tons), by Country 2025 & 2033
- Figure 17: Asia Pacific Ballistic Composites Industry Revenue Share (%), by Country 2025 & 2033
- Figure 18: Asia Pacific Ballistic Composites Industry Volume Share (%), by Country 2025 & 2033
- Figure 19: North America Ballistic Composites Industry Revenue (Million), by Fiber Type 2025 & 2033
- Figure 20: North America Ballistic Composites Industry Volume (K Tons), by Fiber Type 2025 & 2033
- Figure 21: North America Ballistic Composites Industry Revenue Share (%), by Fiber Type 2025 & 2033
- Figure 22: North America Ballistic Composites Industry Volume Share (%), by Fiber Type 2025 & 2033
- Figure 23: North America Ballistic Composites Industry Revenue (Million), by Matrix Type 2025 & 2033
- Figure 24: North America Ballistic Composites Industry Volume (K Tons), by Matrix Type 2025 & 2033
- Figure 25: North America Ballistic Composites Industry Revenue Share (%), by Matrix Type 2025 & 2033
- Figure 26: North America Ballistic Composites Industry Volume Share (%), by Matrix Type 2025 & 2033
- Figure 27: North America Ballistic Composites Industry Revenue (Million), by Application 2025 & 2033
- Figure 28: North America Ballistic Composites Industry Volume (K Tons), by Application 2025 & 2033
- Figure 29: North America Ballistic Composites Industry Revenue Share (%), by Application 2025 & 2033
- Figure 30: North America Ballistic Composites Industry Volume Share (%), by Application 2025 & 2033
- Figure 31: North America Ballistic Composites Industry Revenue (Million), by Country 2025 & 2033
- Figure 32: North America Ballistic Composites Industry Volume (K Tons), by Country 2025 & 2033
- Figure 33: North America Ballistic Composites Industry Revenue Share (%), by Country 2025 & 2033
- Figure 34: North America Ballistic Composites Industry Volume Share (%), by Country 2025 & 2033
- Figure 35: Europe Ballistic Composites Industry Revenue (Million), by Fiber Type 2025 & 2033
- Figure 36: Europe Ballistic Composites Industry Volume (K Tons), by Fiber Type 2025 & 2033
- Figure 37: Europe Ballistic Composites Industry Revenue Share (%), by Fiber Type 2025 & 2033
- Figure 38: Europe Ballistic Composites Industry Volume Share (%), by Fiber Type 2025 & 2033
- Figure 39: Europe Ballistic Composites Industry Revenue (Million), by Matrix Type 2025 & 2033
- Figure 40: Europe Ballistic Composites Industry Volume (K Tons), by Matrix Type 2025 & 2033
- Figure 41: Europe Ballistic Composites Industry Revenue Share (%), by Matrix Type 2025 & 2033
- Figure 42: Europe Ballistic Composites Industry Volume Share (%), by Matrix Type 2025 & 2033
- Figure 43: Europe Ballistic Composites Industry Revenue (Million), by Application 2025 & 2033
- Figure 44: Europe Ballistic Composites Industry Volume (K Tons), by Application 2025 & 2033
- Figure 45: Europe Ballistic Composites Industry Revenue Share (%), by Application 2025 & 2033
- Figure 46: Europe Ballistic Composites Industry Volume Share (%), by Application 2025 & 2033
- Figure 47: Europe Ballistic Composites Industry Revenue (Million), by Country 2025 & 2033
- Figure 48: Europe Ballistic Composites Industry Volume (K Tons), by Country 2025 & 2033
- Figure 49: Europe Ballistic Composites Industry Revenue Share (%), by Country 2025 & 2033
- Figure 50: Europe Ballistic Composites Industry Volume Share (%), by Country 2025 & 2033
- Figure 51: South America Ballistic Composites Industry Revenue (Million), by Fiber Type 2025 & 2033
- Figure 52: South America Ballistic Composites Industry Volume (K Tons), by Fiber Type 2025 & 2033
- Figure 53: South America Ballistic Composites Industry Revenue Share (%), by Fiber Type 2025 & 2033
- Figure 54: South America Ballistic Composites Industry Volume Share (%), by Fiber Type 2025 & 2033
- Figure 55: South America Ballistic Composites Industry Revenue (Million), by Matrix Type 2025 & 2033
- Figure 56: South America Ballistic Composites Industry Volume (K Tons), by Matrix Type 2025 & 2033
- Figure 57: South America Ballistic Composites Industry Revenue Share (%), by Matrix Type 2025 & 2033
- Figure 58: South America Ballistic Composites Industry Volume Share (%), by Matrix Type 2025 & 2033
- Figure 59: South America Ballistic Composites Industry Revenue (Million), by Application 2025 & 2033
- Figure 60: South America Ballistic Composites Industry Volume (K Tons), by Application 2025 & 2033
- Figure 61: South America Ballistic Composites Industry Revenue Share (%), by Application 2025 & 2033
- Figure 62: South America Ballistic Composites Industry Volume Share (%), by Application 2025 & 2033
- Figure 63: South America Ballistic Composites Industry Revenue (Million), by Country 2025 & 2033
- Figure 64: South America Ballistic Composites Industry Volume (K Tons), by Country 2025 & 2033
- Figure 65: South America Ballistic Composites Industry Revenue Share (%), by Country 2025 & 2033
- Figure 66: South America Ballistic Composites Industry Volume Share (%), by Country 2025 & 2033
- Figure 67: Middle East and Africa Ballistic Composites Industry Revenue (Million), by Fiber Type 2025 & 2033
- Figure 68: Middle East and Africa Ballistic Composites Industry Volume (K Tons), by Fiber Type 2025 & 2033
- Figure 69: Middle East and Africa Ballistic Composites Industry Revenue Share (%), by Fiber Type 2025 & 2033
- Figure 70: Middle East and Africa Ballistic Composites Industry Volume Share (%), by Fiber Type 2025 & 2033
- Figure 71: Middle East and Africa Ballistic Composites Industry Revenue (Million), by Matrix Type 2025 & 2033
- Figure 72: Middle East and Africa Ballistic Composites Industry Volume (K Tons), by Matrix Type 2025 & 2033
- Figure 73: Middle East and Africa Ballistic Composites Industry Revenue Share (%), by Matrix Type 2025 & 2033
- Figure 74: Middle East and Africa Ballistic Composites Industry Volume Share (%), by Matrix Type 2025 & 2033
- Figure 75: Middle East and Africa Ballistic Composites Industry Revenue (Million), by Application 2025 & 2033
- Figure 76: Middle East and Africa Ballistic Composites Industry Volume (K Tons), by Application 2025 & 2033
- Figure 77: Middle East and Africa Ballistic Composites Industry Revenue Share (%), by Application 2025 & 2033
- Figure 78: Middle East and Africa Ballistic Composites Industry Volume Share (%), by Application 2025 & 2033
- Figure 79: Middle East and Africa Ballistic Composites Industry Revenue (Million), by Country 2025 & 2033
- Figure 80: Middle East and Africa Ballistic Composites Industry Volume (K Tons), by Country 2025 & 2033
- Figure 81: Middle East and Africa Ballistic Composites Industry Revenue Share (%), by Country 2025 & 2033
- Figure 82: Middle East and Africa Ballistic Composites Industry Volume Share (%), by Country 2025 & 2033
List of Tables
- Table 1: Global Ballistic Composites Industry Revenue Million Forecast, by Fiber Type 2020 & 2033
- Table 2: Global Ballistic Composites Industry Volume K Tons Forecast, by Fiber Type 2020 & 2033
- Table 3: Global Ballistic Composites Industry Revenue Million Forecast, by Matrix Type 2020 & 2033
- Table 4: Global Ballistic Composites Industry Volume K Tons Forecast, by Matrix Type 2020 & 2033
- Table 5: Global Ballistic Composites Industry Revenue Million Forecast, by Application 2020 & 2033
- Table 6: Global Ballistic Composites Industry Volume K Tons Forecast, by Application 2020 & 2033
- Table 7: Global Ballistic Composites Industry Revenue Million Forecast, by Region 2020 & 2033
- Table 8: Global Ballistic Composites Industry Volume K Tons Forecast, by Region 2020 & 2033
- Table 9: Global Ballistic Composites Industry Revenue Million Forecast, by Fiber Type 2020 & 2033
- Table 10: Global Ballistic Composites Industry Volume K Tons Forecast, by Fiber Type 2020 & 2033
- Table 11: Global Ballistic Composites Industry Revenue Million Forecast, by Matrix Type 2020 & 2033
- Table 12: Global Ballistic Composites Industry Volume K Tons Forecast, by Matrix Type 2020 & 2033
- Table 13: Global Ballistic Composites Industry Revenue Million Forecast, by Application 2020 & 2033
- Table 14: Global Ballistic Composites Industry Volume K Tons Forecast, by Application 2020 & 2033
- Table 15: Global Ballistic Composites Industry Revenue Million Forecast, by Country 2020 & 2033
- Table 16: Global Ballistic Composites Industry Volume K Tons Forecast, by Country 2020 & 2033
- Table 17: China Ballistic Composites Industry Revenue (Million) Forecast, by Application 2020 & 2033
- Table 18: China Ballistic Composites Industry Volume (K Tons) Forecast, by Application 2020 & 2033
- Table 19: India Ballistic Composites Industry Revenue (Million) Forecast, by Application 2020 & 2033
- Table 20: India Ballistic Composites Industry Volume (K Tons) Forecast, by Application 2020 & 2033
- Table 21: Japan Ballistic Composites Industry Revenue (Million) Forecast, by Application 2020 & 2033
- Table 22: Japan Ballistic Composites Industry Volume (K Tons) Forecast, by Application 2020 & 2033
- Table 23: South Korea Ballistic Composites Industry Revenue (Million) Forecast, by Application 2020 & 2033
- Table 24: South Korea Ballistic Composites Industry Volume (K Tons) Forecast, by Application 2020 & 2033
- Table 25: Rest of Asia Pacific Ballistic Composites Industry Revenue (Million) Forecast, by Application 2020 & 2033
- Table 26: Rest of Asia Pacific Ballistic Composites Industry Volume (K Tons) Forecast, by Application 2020 & 2033
- Table 27: Global Ballistic Composites Industry Revenue Million Forecast, by Fiber Type 2020 & 2033
- Table 28: Global Ballistic Composites Industry Volume K Tons Forecast, by Fiber Type 2020 & 2033
- Table 29: Global Ballistic Composites Industry Revenue Million Forecast, by Matrix Type 2020 & 2033
- Table 30: Global Ballistic Composites Industry Volume K Tons Forecast, by Matrix Type 2020 & 2033
- Table 31: Global Ballistic Composites Industry Revenue Million Forecast, by Application 2020 & 2033
- Table 32: Global Ballistic Composites Industry Volume K Tons Forecast, by Application 2020 & 2033
- Table 33: Global Ballistic Composites Industry Revenue Million Forecast, by Country 2020 & 2033
- Table 34: Global Ballistic Composites Industry Volume K Tons Forecast, by Country 2020 & 2033
- Table 35: United States Ballistic Composites Industry Revenue (Million) Forecast, by Application 2020 & 2033
- Table 36: United States Ballistic Composites Industry Volume (K Tons) Forecast, by Application 2020 & 2033
- Table 37: Canada Ballistic Composites Industry Revenue (Million) Forecast, by Application 2020 & 2033
- Table 38: Canada Ballistic Composites Industry Volume (K Tons) Forecast, by Application 2020 & 2033
- Table 39: Mexico Ballistic Composites Industry Revenue (Million) Forecast, by Application 2020 & 2033
- Table 40: Mexico Ballistic Composites Industry Volume (K Tons) Forecast, by Application 2020 & 2033
- Table 41: Global Ballistic Composites Industry Revenue Million Forecast, by Fiber Type 2020 & 2033
- Table 42: Global Ballistic Composites Industry Volume K Tons Forecast, by Fiber Type 2020 & 2033
- Table 43: Global Ballistic Composites Industry Revenue Million Forecast, by Matrix Type 2020 & 2033
- Table 44: Global Ballistic Composites Industry Volume K Tons Forecast, by Matrix Type 2020 & 2033
- Table 45: Global Ballistic Composites Industry Revenue Million Forecast, by Application 2020 & 2033
- Table 46: Global Ballistic Composites Industry Volume K Tons Forecast, by Application 2020 & 2033
- Table 47: Global Ballistic Composites Industry Revenue Million Forecast, by Country 2020 & 2033
- Table 48: Global Ballistic Composites Industry Volume K Tons Forecast, by Country 2020 & 2033
- Table 49: Germany Ballistic Composites Industry Revenue (Million) Forecast, by Application 2020 & 2033
- Table 50: Germany Ballistic Composites Industry Volume (K Tons) Forecast, by Application 2020 & 2033
- Table 51: United Kingdom Ballistic Composites Industry Revenue (Million) Forecast, by Application 2020 & 2033
- Table 52: United Kingdom Ballistic Composites Industry Volume (K Tons) Forecast, by Application 2020 & 2033
- Table 53: Italy Ballistic Composites Industry Revenue (Million) Forecast, by Application 2020 & 2033
- Table 54: Italy Ballistic Composites Industry Volume (K Tons) Forecast, by Application 2020 & 2033
- Table 55: France Ballistic Composites Industry Revenue (Million) Forecast, by Application 2020 & 2033
- Table 56: France Ballistic Composites Industry Volume (K Tons) Forecast, by Application 2020 & 2033
- Table 57: Spain Ballistic Composites Industry Revenue (Million) Forecast, by Application 2020 & 2033
- Table 58: Spain Ballistic Composites Industry Volume (K Tons) Forecast, by Application 2020 & 2033
- Table 59: Rest of Europe Ballistic Composites Industry Revenue (Million) Forecast, by Application 2020 & 2033
- Table 60: Rest of Europe Ballistic Composites Industry Volume (K Tons) Forecast, by Application 2020 & 2033
- Table 61: Global Ballistic Composites Industry Revenue Million Forecast, by Fiber Type 2020 & 2033
- Table 62: Global Ballistic Composites Industry Volume K Tons Forecast, by Fiber Type 2020 & 2033
- Table 63: Global Ballistic Composites Industry Revenue Million Forecast, by Matrix Type 2020 & 2033
- Table 64: Global Ballistic Composites Industry Volume K Tons Forecast, by Matrix Type 2020 & 2033
- Table 65: Global Ballistic Composites Industry Revenue Million Forecast, by Application 2020 & 2033
- Table 66: Global Ballistic Composites Industry Volume K Tons Forecast, by Application 2020 & 2033
- Table 67: Global Ballistic Composites Industry Revenue Million Forecast, by Country 2020 & 2033
- Table 68: Global Ballistic Composites Industry Volume K Tons Forecast, by Country 2020 & 2033
- Table 69: Brazil Ballistic Composites Industry Revenue (Million) Forecast, by Application 2020 & 2033
- Table 70: Brazil Ballistic Composites Industry Volume (K Tons) Forecast, by Application 2020 & 2033
- Table 71: Argentina Ballistic Composites Industry Revenue (Million) Forecast, by Application 2020 & 2033
- Table 72: Argentina Ballistic Composites Industry Volume (K Tons) Forecast, by Application 2020 & 2033
- Table 73: Rest of South America Ballistic Composites Industry Revenue (Million) Forecast, by Application 2020 & 2033
- Table 74: Rest of South America Ballistic Composites Industry Volume (K Tons) Forecast, by Application 2020 & 2033
- Table 75: Global Ballistic Composites Industry Revenue Million Forecast, by Fiber Type 2020 & 2033
- Table 76: Global Ballistic Composites Industry Volume K Tons Forecast, by Fiber Type 2020 & 2033
- Table 77: Global Ballistic Composites Industry Revenue Million Forecast, by Matrix Type 2020 & 2033
- Table 78: Global Ballistic Composites Industry Volume K Tons Forecast, by Matrix Type 2020 & 2033
- Table 79: Global Ballistic Composites Industry Revenue Million Forecast, by Application 2020 & 2033
- Table 80: Global Ballistic Composites Industry Volume K Tons Forecast, by Application 2020 & 2033
- Table 81: Global Ballistic Composites Industry Revenue Million Forecast, by Country 2020 & 2033
- Table 82: Global Ballistic Composites Industry Volume K Tons Forecast, by Country 2020 & 2033
- Table 83: Saudi Arabia Ballistic Composites Industry Revenue (Million) Forecast, by Application 2020 & 2033
- Table 84: Saudi Arabia Ballistic Composites Industry Volume (K Tons) Forecast, by Application 2020 & 2033
- Table 85: South Africa Ballistic Composites Industry Revenue (Million) Forecast, by Application 2020 & 2033
- Table 86: South Africa Ballistic Composites Industry Volume (K Tons) Forecast, by Application 2020 & 2033
- Table 87: Rest of Middle East and Africa Ballistic Composites Industry Revenue (Million) Forecast, by Application 2020 & 2033
- Table 88: Rest of Middle East and Africa Ballistic Composites Industry Volume (K Tons) Forecast, by Application 2020 & 2033
Frequently Asked Questions
1. What is the projected Compound Annual Growth Rate (CAGR) of the Ballistic Composites Industry?
The projected CAGR is approximately > 4.00%.
2. Which companies are prominent players in the Ballistic Composites Industry?
Key companies in the market include Honeywell International Inc, Teijin Limited, Plastic Reinforcement Fabrics Ltd, BAE Systems, Southern States llc, Roihu Inc, Barrday Inc, TenCate Protective Fabrics, MKU LIMITED, Coherent Corp, Integris, Morgan Advanced Materials, DSM, DuPont, Gaffco Ballistics, Gurit Holding AG, ArmorCore.
3. What are the main segments of the Ballistic Composites Industry?
The market segments include Fiber Type, Matrix Type, Application.
4. Can you provide details about the market size?
The market size is estimated to be USD 1.91 Million as of 2022.
5. What are some drivers contributing to market growth?
Rise in Defense Expenditure; Increasing Demand for Lightweight Materials in the Aerospace and Defense Industry; Other Drivers.
6. What are the notable trends driving market growth?
Increasing Demand for Vehicle Armors.
7. Are there any restraints impacting market growth?
High Processing and Manufacturing Costs; Volatile Raw Material Supply.
8. Can you provide examples of recent developments in the market?
November 2023: Integris Composites developed a new system of ballistic vest gear for law enforcement and military units and launched the company’s new Rapid Don/Doff body armor vests. It is an equipment that dramatically reduces the time for donning and doffing one’s body armor rig—by 50% or more.
9. What pricing options are available for accessing the report?
Pricing options include single-user, multi-user, and enterprise licenses priced at USD 4750, USD 5250, and USD 8750 respectively.
10. Is the market size provided in terms of value or volume?
The market size is provided in terms of value, measured in Million and volume, measured in K Tons.
11. Are there any specific market keywords associated with the report?
Yes, the market keyword associated with the report is "Ballistic Composites Industry," which aids in identifying and referencing the specific market segment covered.
12. How do I determine which pricing option suits my needs best?
The pricing options vary based on user requirements and access needs. Individual users may opt for single-user licenses, while businesses requiring broader access may choose multi-user or enterprise licenses for cost-effective access to the report.
13. Are there any additional resources or data provided in the Ballistic Composites Industry report?
While the report offers comprehensive insights, it's advisable to review the specific contents or supplementary materials provided to ascertain if additional resources or data are available.
14. How can I stay updated on further developments or reports in the Ballistic Composites Industry?
To stay informed about further developments, trends, and reports in the Ballistic Composites Industry, consider subscribing to industry newsletters, following relevant companies and organizations, or regularly checking reputable industry news sources and publications.
Methodology
Step 1 - Identification of Relevant Samples Size from Population Database


Step 2 - Approaches for Defining Global Market Size (Value, Volume* & Price*)

Note*: In applicable scenarios
Step 3 - Data Sources
Primary Research
- Web Analytics
- Survey Reports
- Research Institute
- Latest Research Reports
- Opinion Leaders
Secondary Research
- Annual Reports
- White Paper
- Latest Press Release
- Industry Association
- Paid Database
- Investor Presentations

Step 4 - Data Triangulation
Involves using different sources of information in order to increase the validity of a study
These sources are likely to be stakeholders in a program - participants, other researchers, program staff, other community members, and so on.
Then we put all data in single framework & apply various statistical tools to find out the dynamic on the market.
During the analysis stage, feedback from the stakeholder groups would be compared to determine areas of agreement as well as areas of divergence

