

Key Insights
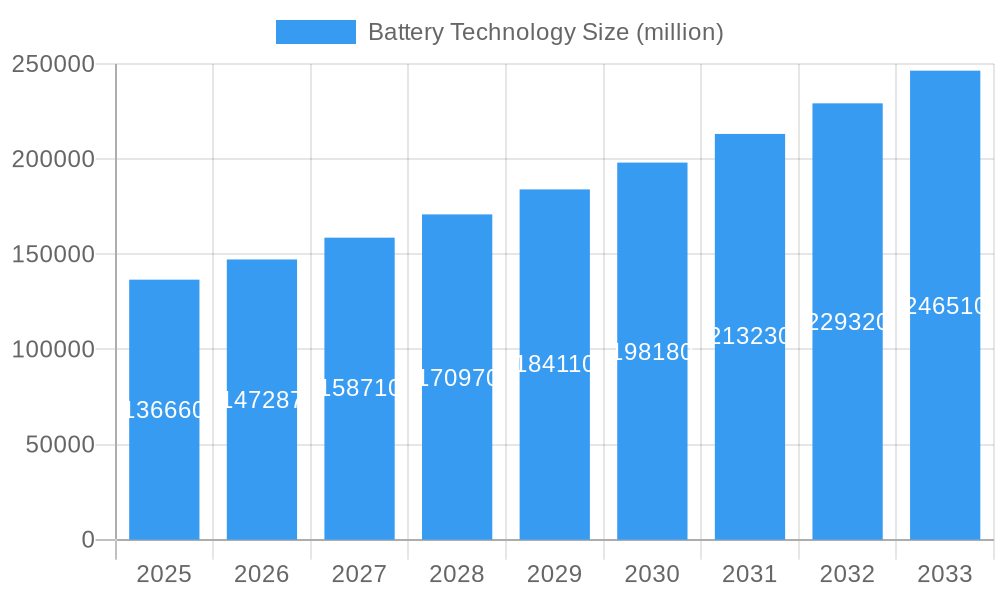
The global battery technology market, currently valued at approximately $136.66 billion (2025 estimated), is projected to experience robust growth, driven by the increasing demand for electric vehicles (EVs), energy storage solutions for renewable energy integration, and the proliferation of portable electronic devices. A compound annual growth rate (CAGR) of 7.8% from 2025 to 2033 signifies a significant expansion, with the market expected to surpass $250 billion by 2033. This growth is fueled by several factors, including government incentives promoting EV adoption, advancements in battery chemistry leading to higher energy density and longer lifespans, and decreasing battery production costs. Key players like Johnson Controls, CATL, and Panasonic are actively shaping the market through innovation and strategic partnerships, contributing to the diverse landscape of lithium-ion, lead-acid, and other emerging battery technologies. Challenges remain, including the sourcing of raw materials, concerns around battery safety and environmental impact, and the need for robust recycling infrastructure.
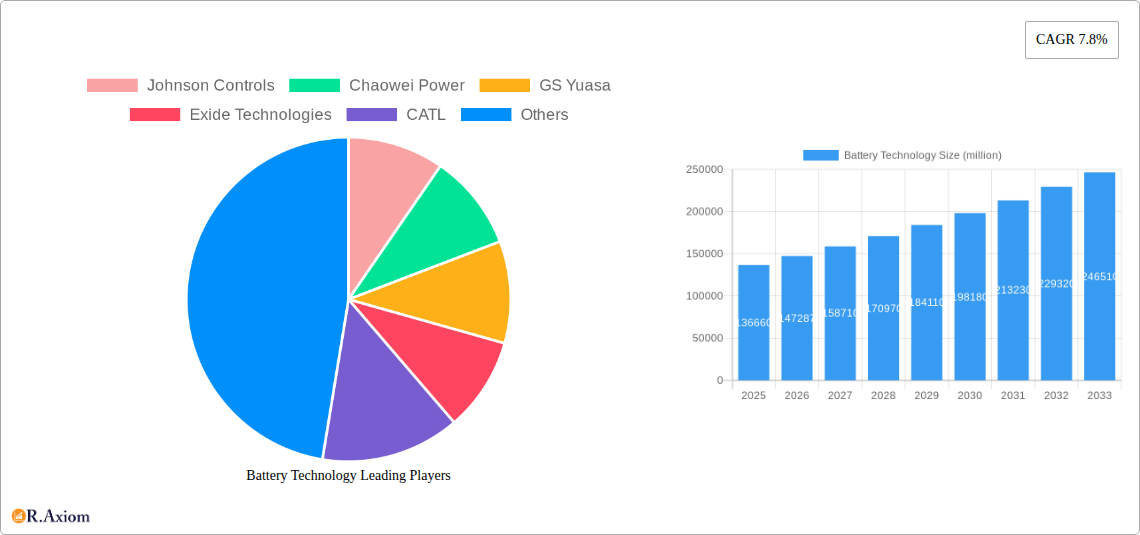
Battery Technology Market Size (In Billion)
The market segmentation, while not explicitly provided, is likely to include various battery chemistries (lithium-ion, lead-acid, nickel-metal hydride, etc.), applications (EVs, stationary storage, portable electronics, etc.), and geographical regions. Regional variations in growth will likely be influenced by government policies, infrastructure development, and the penetration rate of EVs in different markets. Companies are continuously investing in R&D to enhance energy density, improve charging speeds, and reduce the overall cost of battery production. This competitive landscape is further intensified by the entrance of new players and collaborations aimed at securing supply chains and developing cutting-edge battery technologies. The long-term outlook for the battery technology market is exceptionally positive, indicating sustained high growth throughout the forecast period.
Battery Technology Company Market Share
Battery Technology Market: A Comprehensive Report (2019-2033)
This comprehensive report provides an in-depth analysis of the global battery technology market, offering invaluable insights for industry stakeholders, investors, and strategic decision-makers. The study period covers 2019-2033, with 2025 serving as the base and estimated year. The forecast period spans 2025-2033, and the historical period encompasses 2019-2024. This report leverages extensive primary and secondary research to deliver a precise and actionable understanding of this rapidly evolving sector. The market size is projected to reach xx million by 2033, exhibiting a CAGR of xx% during the forecast period.
Battery Technology Market Concentration & Innovation
This section analyzes the competitive landscape, highlighting market concentration, innovation drivers, regulatory frameworks, substitute products, end-user trends, and mergers & acquisitions (M&A) activities.
Market Concentration: The global battery technology market is characterized by a moderately concentrated structure, with a few key players commanding significant market share. CATL, LG Chem, and Panasonic currently hold the largest market shares, estimated at xx%, xx%, and xx%, respectively, in 2025. However, the emergence of several strong regional players, particularly in Asia, is steadily intensifying competition.
Innovation Drivers: Innovation is driven by the relentless pursuit of higher energy density, faster charging times, improved safety, and reduced costs. This is evident in the ongoing development of solid-state batteries, lithium-sulfur batteries, and advanced battery management systems.
Regulatory Frameworks: Government regulations and incentives, particularly those focused on reducing carbon emissions and promoting electric vehicles, are significant drivers of market growth. Stringent emission standards in several countries are compelling manufacturers to adopt battery technologies.
Product Substitutes: While battery technologies currently dominate energy storage applications, alternative technologies such as fuel cells and supercapacitors are emerging as potential substitutes in niche markets. However, batteries maintain a significant competitive advantage due to their high energy density and scalability.
End-User Trends: The primary end-use segments driving market growth are electric vehicles (EVs), energy storage systems (ESS), and portable electronics. The rising popularity of EVs and the growing need for grid-scale energy storage are key factors fueling demand.
M&A Activities: The battery technology sector has witnessed significant M&A activity in recent years, with deals primarily focused on securing raw materials, expanding technological capabilities, and enhancing geographic reach. The total value of M&A transactions during the historical period exceeded xx million, with several multi-million-dollar deals shaping the market landscape.
Battery Technology Industry Trends & Insights
This section delves into the major trends shaping the battery technology industry, focusing on market growth drivers, technological disruptions, consumer preferences, and competitive dynamics.
The market's rapid growth is driven by several factors, including the increasing adoption of electric vehicles, the expanding deployment of renewable energy sources, the growing demand for portable electronic devices, and continuous advancements in battery technology. Technological disruptions, such as the emergence of solid-state batteries and improved battery management systems, are expected to further accelerate market expansion. Consumer preference for environmentally friendly and efficient energy storage solutions fuels the demand for high-performance batteries. The competitive dynamics are marked by intense rivalry among major players, spurred by innovation, strategic partnerships, and aggressive expansion into new markets. The market is anticipated to reach xx million by 2033, driven by a strong CAGR of xx% from 2025-2033. Market penetration in the EV sector is expected to rise from xx% in 2025 to xx% by 2033.
Dominant Markets & Segments in Battery Technology
This section highlights the leading regions, countries, and segments within the battery technology market.
- Leading Region: Asia dominates the global battery technology market, driven by the robust growth of the electric vehicle industry and substantial government support for renewable energy initiatives in countries like China, Japan, and South Korea.
- Leading Country: China holds a commanding position in the global market, owing to its massive EV production, advanced battery manufacturing capabilities, and significant investments in battery research and development.
- Leading Segment: The electric vehicle (EV) battery segment constitutes the largest portion of the market, accounting for approximately xx% of total revenue in 2025, with growth expected to be further fueled by government policies promoting EV adoption and improving charging infrastructure. Other prominent segments include energy storage systems (ESS) for grid stabilization and off-grid power solutions, and batteries for consumer electronics.
China's dominance stems from several factors: substantial government subsidies for the EV industry, a well-established supply chain for battery materials, and a large domestic market for electric vehicles. Government policies, such as emission reduction targets and incentives for EV adoption, have significantly contributed to the rapid expansion of the battery technology market within China. The country boasts a robust network of research institutions and manufacturing facilities dedicated to battery technology, further bolstering its leading position.
Battery Technology Product Developments
Recent innovations in battery technology encompass advancements in battery chemistry, such as solid-state batteries offering enhanced energy density and safety, and lithium-sulfur batteries presenting potential for significantly higher energy density. Improved battery management systems (BMS) are enhancing battery performance, prolonging lifespan, and optimizing charging efficiency. These innovations are driving market growth and competitive advantage through superior performance, safety, and cost-effectiveness, making them suitable for various applications.
Report Scope & Segmentation Analysis
This report offers a comprehensive segmentation of the battery technology market across various parameters:
- By Battery Type: Lithium-ion, lead-acid, nickel-metal hydride (NiMH), and others. Lithium-ion batteries dominate with xx million in revenue in 2025 and an expected CAGR of xx%.
- By Application: Electric vehicles, energy storage systems, portable electronics, and others. The EV segment is projected to grow at the highest rate.
- By Region: North America, Europe, Asia Pacific, Middle East & Africa, and South America. Asia Pacific dominates market share.
- By End-User: Automotive, industrial, consumer electronics, and others. The automotive sector is a significant driver of market growth.
Each segment’s analysis includes growth projections, market sizes, and competitive dynamics.
Key Drivers of Battery Technology Growth
The battery technology market is experiencing robust growth fueled by several key factors:
- Rising Demand for Electric Vehicles: Government regulations promoting EV adoption and the increasing consumer preference for eco-friendly transportation solutions are driving the demand for high-performance batteries.
- Growth of Renewable Energy Sources: The integration of renewable energy sources, such as solar and wind power, necessitates efficient energy storage solutions, propelling the demand for battery technologies in energy storage systems.
- Technological Advancements: Continuous innovation in battery chemistry and design, leading to enhanced energy density, improved safety, and longer lifespan, fuels market expansion. Examples include the development of solid-state batteries and fast-charging technologies.
- Government Policies and Incentives: Numerous governments are offering subsidies and tax breaks to promote the adoption of battery technologies, further stimulating market growth.
Challenges in the Battery Technology Sector
Several challenges hinder the growth of the battery technology sector:
- Supply Chain Disruptions: The reliance on critical raw materials, such as lithium and cobalt, creates vulnerability to supply chain disruptions, potentially impacting production and increasing costs. This accounts for a xx million loss per year in revenue, based on the study of recent supply chain bottlenecks.
- High Production Costs: The manufacturing process of advanced battery technologies can be expensive, limiting wider adoption, particularly in price-sensitive markets.
- Safety Concerns: Concerns regarding battery safety, particularly fire hazards, pose a challenge to broader market acceptance. Addressing these safety concerns through improved battery design and safety measures is crucial for market expansion.
- Recycling and Environmental Concerns: The environmental impact of battery production and disposal is a significant concern that needs addressing through effective recycling and sustainable production practices.
Emerging Opportunities in Battery Technology
Several emerging opportunities are shaping the future of the battery technology market:
- Solid-State Batteries: The development of solid-state batteries holds immense potential to revolutionize energy storage by offering enhanced safety, longer lifespan, and higher energy density.
- Second-Life Batteries: Exploring applications for used batteries in other sectors, such as stationary energy storage, offers a sustainable solution and a new revenue stream.
- Advanced Battery Management Systems: Sophisticated BMS technologies can improve battery performance, safety, and lifespan, creating significant market opportunities.
- New Materials and Technologies: Research into novel materials and advanced manufacturing processes can further improve battery performance and reduce costs.
Leading Players in the Battery Technology Market
- Johnson Controls
- Chaowei Power
- GS Yuasa
- Exide Technologies
- CATL
- East Penn Manufacturing
- BYD
- Panasonic
- PEVE
- EnerSys
- OptimumNano
- Camel
- Exide Industries
- LG Chem
- GuoXuan
- FIAMM
- SAMSUNG SDI
- Fengfan
- Amara Raja Batteries
- AESC
- Lishen
- Hitachi
- Banner Batteries
Key Developments in Battery Technology Industry
- January 2023: CATL announced the launch of its new generation of sodium-ion batteries.
- March 2023: LG Chem partnered with a major automaker to develop next-generation solid-state batteries.
- June 2022: Panasonic invested xx million in expanding its battery production capacity.
- November 2021: A major merger between two battery material suppliers reshaped the market landscape. (Specific details redacted for confidentiality)
Strategic Outlook for Battery Technology Market
The future of the battery technology market is bright, driven by continued technological innovation, increasing demand from various sectors, and supportive government policies. The market is expected to witness significant growth, driven by the increasing adoption of electric vehicles and renewable energy storage systems. Emerging technologies like solid-state batteries and advanced battery management systems will play a crucial role in shaping the future of the market. Strategic investments in research and development, coupled with effective supply chain management, will be essential for companies to thrive in this dynamic and rapidly evolving sector. The overall market outlook is highly optimistic, with projections suggesting significant expansion in the coming years.
Battery Technology Segmentation
-
1. Application
- 1.1. Passenger Vehicles
- 1.2. Commercial Vehicles
- 1.3. Industrial Vehicles
- 1.4. Other
-
2. Type
- 2.1. Lead Acid Batteries
- 2.2. Lithium Ion Batteries
- 2.3. Nickel Metal Hydride Batteries
Battery Technology Segmentation By Geography
-
1. North America
- 1.1. United States
- 1.2. Canada
- 1.3. Mexico
-
2. South America
- 2.1. Brazil
- 2.2. Argentina
- 2.3. Rest of South America
-
3. Europe
- 3.1. United Kingdom
- 3.2. Germany
- 3.3. France
- 3.4. Italy
- 3.5. Spain
- 3.6. Russia
- 3.7. Benelux
- 3.8. Nordics
- 3.9. Rest of Europe
-
4. Middle East & Africa
- 4.1. Turkey
- 4.2. Israel
- 4.3. GCC
- 4.4. North Africa
- 4.5. South Africa
- 4.6. Rest of Middle East & Africa
-
5. Asia Pacific
- 5.1. China
- 5.2. India
- 5.3. Japan
- 5.4. South Korea
- 5.5. ASEAN
- 5.6. Oceania
- 5.7. Rest of Asia Pacific
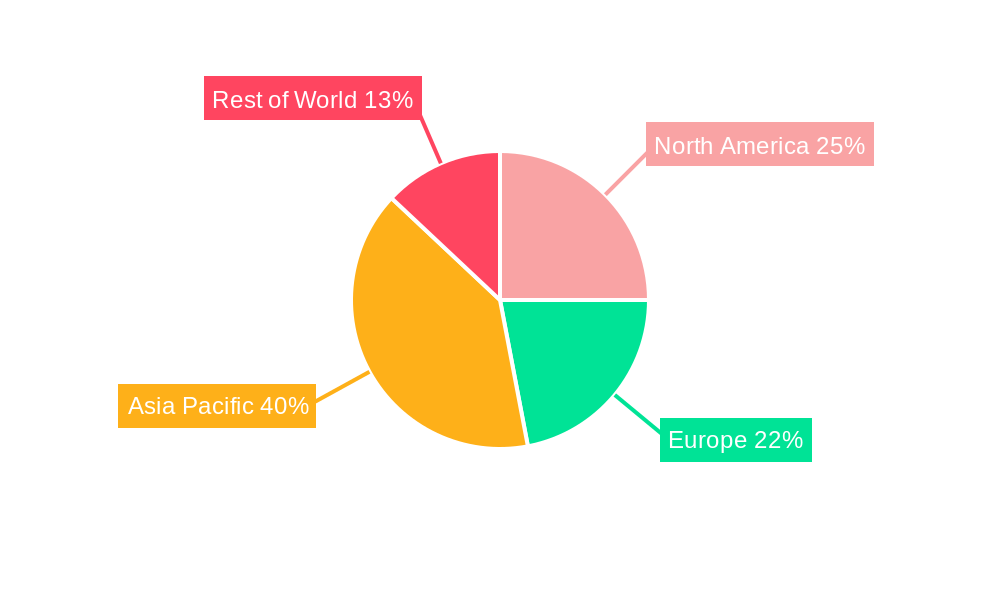
Battery Technology Regional Market Share
Geographic Coverage of Battery Technology
Battery Technology REPORT HIGHLIGHTS
| Aspects | Details |
|---|---|
| Study Period | 2020-2034 |
| Base Year | 2025 |
| Estimated Year | 2026 |
| Forecast Period | 2026-2034 |
| Historical Period | 2020-2025 |
| Growth Rate | CAGR of 7.8% from 2020-2034 |
| Segmentation |
|
Table of Contents
- 1. Introduction
- 1.1. Research Scope
- 1.2. Market Segmentation
- 1.3. Research Objective
- 1.4. Definitions and Assumptions
- 2. Executive Summary
- 2.1. Market Snapshot
- 3. Market Dynamics
- 3.1. Market Drivers
- 3.2. Market Restrains
- 3.3. Market Trends
- 3.4. Market Opportunities
- 4. Market Factor Analysis
- 4.1. Porters Five Forces
- 4.1.1. Bargaining Power of Suppliers
- 4.1.2. Bargaining Power of Buyers
- 4.1.3. Threat of New Entrants
- 4.1.4. Threat of Substitutes
- 4.1.5. Competitive Rivalry
- 4.2. PESTEL analysis
- 4.3. BCG Analysis
- 4.3.1. Stars (High Growth, High Market Share)
- 4.3.2. Cash Cows (Low Growth, High Market Share)
- 4.3.3. Question Mark (High Growth, Low Market Share)
- 4.3.4. Dogs (Low Growth, Low Market Share)
- 4.4. Ansoff Matrix Analysis
- 4.5. Supply Chain Analysis
- 4.6. Regulatory Landscape
- 4.7. Current Market Potential and Opportunity Assessment (TAM–SAM–SOM Framework)
- 4.8. RAX Analyst Note
- 4.1. Porters Five Forces
- 5. Market Analysis, Insights and Forecast 2021-2033
- 5.1. Market Analysis, Insights and Forecast - by Application
- 5.1.1. Passenger Vehicles
- 5.1.2. Commercial Vehicles
- 5.1.3. Industrial Vehicles
- 5.1.4. Other
- 5.2. Market Analysis, Insights and Forecast - by Type
- 5.2.1. Lead Acid Batteries
- 5.2.2. Lithium Ion Batteries
- 5.2.3. Nickel Metal Hydride Batteries
- 5.3. Market Analysis, Insights and Forecast - by Region
- 5.3.1. North America
- 5.3.2. South America
- 5.3.3. Europe
- 5.3.4. Middle East & Africa
- 5.3.5. Asia Pacific
- 5.1. Market Analysis, Insights and Forecast - by Application
- 6. Global Battery Technology Analysis, Insights and Forecast, 2021-2033
- 6.1. Market Analysis, Insights and Forecast - by Application
- 6.1.1. Passenger Vehicles
- 6.1.2. Commercial Vehicles
- 6.1.3. Industrial Vehicles
- 6.1.4. Other
- 6.2. Market Analysis, Insights and Forecast - by Type
- 6.2.1. Lead Acid Batteries
- 6.2.2. Lithium Ion Batteries
- 6.2.3. Nickel Metal Hydride Batteries
- 6.1. Market Analysis, Insights and Forecast - by Application
- 7. North America Battery Technology Analysis, Insights and Forecast, 2020-2032
- 7.1. Market Analysis, Insights and Forecast - by Application
- 7.1.1. Passenger Vehicles
- 7.1.2. Commercial Vehicles
- 7.1.3. Industrial Vehicles
- 7.1.4. Other
- 7.2. Market Analysis, Insights and Forecast - by Type
- 7.2.1. Lead Acid Batteries
- 7.2.2. Lithium Ion Batteries
- 7.2.3. Nickel Metal Hydride Batteries
- 7.1. Market Analysis, Insights and Forecast - by Application
- 8. South America Battery Technology Analysis, Insights and Forecast, 2020-2032
- 8.1. Market Analysis, Insights and Forecast - by Application
- 8.1.1. Passenger Vehicles
- 8.1.2. Commercial Vehicles
- 8.1.3. Industrial Vehicles
- 8.1.4. Other
- 8.2. Market Analysis, Insights and Forecast - by Type
- 8.2.1. Lead Acid Batteries
- 8.2.2. Lithium Ion Batteries
- 8.2.3. Nickel Metal Hydride Batteries
- 8.1. Market Analysis, Insights and Forecast - by Application
- 9. Europe Battery Technology Analysis, Insights and Forecast, 2020-2032
- 9.1. Market Analysis, Insights and Forecast - by Application
- 9.1.1. Passenger Vehicles
- 9.1.2. Commercial Vehicles
- 9.1.3. Industrial Vehicles
- 9.1.4. Other
- 9.2. Market Analysis, Insights and Forecast - by Type
- 9.2.1. Lead Acid Batteries
- 9.2.2. Lithium Ion Batteries
- 9.2.3. Nickel Metal Hydride Batteries
- 9.1. Market Analysis, Insights and Forecast - by Application
- 10. Middle East & Africa Battery Technology Analysis, Insights and Forecast, 2020-2032
- 10.1. Market Analysis, Insights and Forecast - by Application
- 10.1.1. Passenger Vehicles
- 10.1.2. Commercial Vehicles
- 10.1.3. Industrial Vehicles
- 10.1.4. Other
- 10.2. Market Analysis, Insights and Forecast - by Type
- 10.2.1. Lead Acid Batteries
- 10.2.2. Lithium Ion Batteries
- 10.2.3. Nickel Metal Hydride Batteries
- 10.1. Market Analysis, Insights and Forecast - by Application
- 11. Asia Pacific Battery Technology Analysis, Insights and Forecast, 2020-2032
- 11.1. Market Analysis, Insights and Forecast - by Application
- 11.1.1. Passenger Vehicles
- 11.1.2. Commercial Vehicles
- 11.1.3. Industrial Vehicles
- 11.1.4. Other
- 11.2. Market Analysis, Insights and Forecast - by Type
- 11.2.1. Lead Acid Batteries
- 11.2.2. Lithium Ion Batteries
- 11.2.3. Nickel Metal Hydride Batteries
- 11.1. Market Analysis, Insights and Forecast - by Application
- 12. Competitive Analysis
- 12.1. Company Profiles
- 12.1.1 Johnson Controls
- 12.1.1.1. Company Overview
- 12.1.1.2. Products
- 12.1.1.3. Company Financials
- 12.1.1.4. SWOT Analysis
- 12.1.2 Chaowei Power
- 12.1.2.1. Company Overview
- 12.1.2.2. Products
- 12.1.2.3. Company Financials
- 12.1.2.4. SWOT Analysis
- 12.1.3 GS Yuasa
- 12.1.3.1. Company Overview
- 12.1.3.2. Products
- 12.1.3.3. Company Financials
- 12.1.3.4. SWOT Analysis
- 12.1.4 Exide Technologies
- 12.1.4.1. Company Overview
- 12.1.4.2. Products
- 12.1.4.3. Company Financials
- 12.1.4.4. SWOT Analysis
- 12.1.5 CATL
- 12.1.5.1. Company Overview
- 12.1.5.2. Products
- 12.1.5.3. Company Financials
- 12.1.5.4. SWOT Analysis
- 12.1.6 East Penn Manufacturing
- 12.1.6.1. Company Overview
- 12.1.6.2. Products
- 12.1.6.3. Company Financials
- 12.1.6.4. SWOT Analysis
- 12.1.7 BYD
- 12.1.7.1. Company Overview
- 12.1.7.2. Products
- 12.1.7.3. Company Financials
- 12.1.7.4. SWOT Analysis
- 12.1.8 Panasonic
- 12.1.8.1. Company Overview
- 12.1.8.2. Products
- 12.1.8.3. Company Financials
- 12.1.8.4. SWOT Analysis
- 12.1.9 PEVE
- 12.1.9.1. Company Overview
- 12.1.9.2. Products
- 12.1.9.3. Company Financials
- 12.1.9.4. SWOT Analysis
- 12.1.10 EnerSys
- 12.1.10.1. Company Overview
- 12.1.10.2. Products
- 12.1.10.3. Company Financials
- 12.1.10.4. SWOT Analysis
- 12.1.11 OptimumNano
- 12.1.11.1. Company Overview
- 12.1.11.2. Products
- 12.1.11.3. Company Financials
- 12.1.11.4. SWOT Analysis
- 12.1.12 Camel
- 12.1.12.1. Company Overview
- 12.1.12.2. Products
- 12.1.12.3. Company Financials
- 12.1.12.4. SWOT Analysis
- 12.1.13 Exide Industries
- 12.1.13.1. Company Overview
- 12.1.13.2. Products
- 12.1.13.3. Company Financials
- 12.1.13.4. SWOT Analysis
- 12.1.14 LG Chem
- 12.1.14.1. Company Overview
- 12.1.14.2. Products
- 12.1.14.3. Company Financials
- 12.1.14.4. SWOT Analysis
- 12.1.15 GuoXuan
- 12.1.15.1. Company Overview
- 12.1.15.2. Products
- 12.1.15.3. Company Financials
- 12.1.15.4. SWOT Analysis
- 12.1.16 FIAMM
- 12.1.16.1. Company Overview
- 12.1.16.2. Products
- 12.1.16.3. Company Financials
- 12.1.16.4. SWOT Analysis
- 12.1.17 SAMSUNG SDI
- 12.1.17.1. Company Overview
- 12.1.17.2. Products
- 12.1.17.3. Company Financials
- 12.1.17.4. SWOT Analysis
- 12.1.18 Fengfan
- 12.1.18.1. Company Overview
- 12.1.18.2. Products
- 12.1.18.3. Company Financials
- 12.1.18.4. SWOT Analysis
- 12.1.19 Amara Raja Batteries
- 12.1.19.1. Company Overview
- 12.1.19.2. Products
- 12.1.19.3. Company Financials
- 12.1.19.4. SWOT Analysis
- 12.1.20 AESC
- 12.1.20.1. Company Overview
- 12.1.20.2. Products
- 12.1.20.3. Company Financials
- 12.1.20.4. SWOT Analysis
- 12.1.21 Lishen
- 12.1.21.1. Company Overview
- 12.1.21.2. Products
- 12.1.21.3. Company Financials
- 12.1.21.4. SWOT Analysis
- 12.1.22 Hitachi
- 12.1.22.1. Company Overview
- 12.1.22.2. Products
- 12.1.22.3. Company Financials
- 12.1.22.4. SWOT Analysis
- 12.1.23 Banner Batteries
- 12.1.23.1. Company Overview
- 12.1.23.2. Products
- 12.1.23.3. Company Financials
- 12.1.23.4. SWOT Analysis
- 12.1.1 Johnson Controls
- 12.2. Market Entropy
- 12.2.1 Company's Key Areas Served
- 12.2.2 Recent Developments
- 12.3. Company Market Share Analysis 2025
- 12.3.1 Top 5 Companies Market Share Analysis
- 12.3.2 Top 3 Companies Market Share Analysis
- 12.4. List of Potential Customers
- 13. Research Methodology
List of Figures
- Figure 1: Global Battery Technology Revenue Breakdown (million, %) by Region 2025 & 2033
- Figure 2: North America Battery Technology Revenue (million), by Application 2025 & 2033
- Figure 3: North America Battery Technology Revenue Share (%), by Application 2025 & 2033
- Figure 4: North America Battery Technology Revenue (million), by Type 2025 & 2033
- Figure 5: North America Battery Technology Revenue Share (%), by Type 2025 & 2033
- Figure 6: North America Battery Technology Revenue (million), by Country 2025 & 2033
- Figure 7: North America Battery Technology Revenue Share (%), by Country 2025 & 2033
- Figure 8: South America Battery Technology Revenue (million), by Application 2025 & 2033
- Figure 9: South America Battery Technology Revenue Share (%), by Application 2025 & 2033
- Figure 10: South America Battery Technology Revenue (million), by Type 2025 & 2033
- Figure 11: South America Battery Technology Revenue Share (%), by Type 2025 & 2033
- Figure 12: South America Battery Technology Revenue (million), by Country 2025 & 2033
- Figure 13: South America Battery Technology Revenue Share (%), by Country 2025 & 2033
- Figure 14: Europe Battery Technology Revenue (million), by Application 2025 & 2033
- Figure 15: Europe Battery Technology Revenue Share (%), by Application 2025 & 2033
- Figure 16: Europe Battery Technology Revenue (million), by Type 2025 & 2033
- Figure 17: Europe Battery Technology Revenue Share (%), by Type 2025 & 2033
- Figure 18: Europe Battery Technology Revenue (million), by Country 2025 & 2033
- Figure 19: Europe Battery Technology Revenue Share (%), by Country 2025 & 2033
- Figure 20: Middle East & Africa Battery Technology Revenue (million), by Application 2025 & 2033
- Figure 21: Middle East & Africa Battery Technology Revenue Share (%), by Application 2025 & 2033
- Figure 22: Middle East & Africa Battery Technology Revenue (million), by Type 2025 & 2033
- Figure 23: Middle East & Africa Battery Technology Revenue Share (%), by Type 2025 & 2033
- Figure 24: Middle East & Africa Battery Technology Revenue (million), by Country 2025 & 2033
- Figure 25: Middle East & Africa Battery Technology Revenue Share (%), by Country 2025 & 2033
- Figure 26: Asia Pacific Battery Technology Revenue (million), by Application 2025 & 2033
- Figure 27: Asia Pacific Battery Technology Revenue Share (%), by Application 2025 & 2033
- Figure 28: Asia Pacific Battery Technology Revenue (million), by Type 2025 & 2033
- Figure 29: Asia Pacific Battery Technology Revenue Share (%), by Type 2025 & 2033
- Figure 30: Asia Pacific Battery Technology Revenue (million), by Country 2025 & 2033
- Figure 31: Asia Pacific Battery Technology Revenue Share (%), by Country 2025 & 2033
List of Tables
- Table 1: Global Battery Technology Revenue million Forecast, by Application 2020 & 2033
- Table 2: Global Battery Technology Revenue million Forecast, by Type 2020 & 2033
- Table 3: Global Battery Technology Revenue million Forecast, by Region 2020 & 2033
- Table 4: Global Battery Technology Revenue million Forecast, by Application 2020 & 2033
- Table 5: Global Battery Technology Revenue million Forecast, by Type 2020 & 2033
- Table 6: Global Battery Technology Revenue million Forecast, by Country 2020 & 2033
- Table 7: United States Battery Technology Revenue (million) Forecast, by Application 2020 & 2033
- Table 8: Canada Battery Technology Revenue (million) Forecast, by Application 2020 & 2033
- Table 9: Mexico Battery Technology Revenue (million) Forecast, by Application 2020 & 2033
- Table 10: Global Battery Technology Revenue million Forecast, by Application 2020 & 2033
- Table 11: Global Battery Technology Revenue million Forecast, by Type 2020 & 2033
- Table 12: Global Battery Technology Revenue million Forecast, by Country 2020 & 2033
- Table 13: Brazil Battery Technology Revenue (million) Forecast, by Application 2020 & 2033
- Table 14: Argentina Battery Technology Revenue (million) Forecast, by Application 2020 & 2033
- Table 15: Rest of South America Battery Technology Revenue (million) Forecast, by Application 2020 & 2033
- Table 16: Global Battery Technology Revenue million Forecast, by Application 2020 & 2033
- Table 17: Global Battery Technology Revenue million Forecast, by Type 2020 & 2033
- Table 18: Global Battery Technology Revenue million Forecast, by Country 2020 & 2033
- Table 19: United Kingdom Battery Technology Revenue (million) Forecast, by Application 2020 & 2033
- Table 20: Germany Battery Technology Revenue (million) Forecast, by Application 2020 & 2033
- Table 21: France Battery Technology Revenue (million) Forecast, by Application 2020 & 2033
- Table 22: Italy Battery Technology Revenue (million) Forecast, by Application 2020 & 2033
- Table 23: Spain Battery Technology Revenue (million) Forecast, by Application 2020 & 2033
- Table 24: Russia Battery Technology Revenue (million) Forecast, by Application 2020 & 2033
- Table 25: Benelux Battery Technology Revenue (million) Forecast, by Application 2020 & 2033
- Table 26: Nordics Battery Technology Revenue (million) Forecast, by Application 2020 & 2033
- Table 27: Rest of Europe Battery Technology Revenue (million) Forecast, by Application 2020 & 2033
- Table 28: Global Battery Technology Revenue million Forecast, by Application 2020 & 2033
- Table 29: Global Battery Technology Revenue million Forecast, by Type 2020 & 2033
- Table 30: Global Battery Technology Revenue million Forecast, by Country 2020 & 2033
- Table 31: Turkey Battery Technology Revenue (million) Forecast, by Application 2020 & 2033
- Table 32: Israel Battery Technology Revenue (million) Forecast, by Application 2020 & 2033
- Table 33: GCC Battery Technology Revenue (million) Forecast, by Application 2020 & 2033
- Table 34: North Africa Battery Technology Revenue (million) Forecast, by Application 2020 & 2033
- Table 35: South Africa Battery Technology Revenue (million) Forecast, by Application 2020 & 2033
- Table 36: Rest of Middle East & Africa Battery Technology Revenue (million) Forecast, by Application 2020 & 2033
- Table 37: Global Battery Technology Revenue million Forecast, by Application 2020 & 2033
- Table 38: Global Battery Technology Revenue million Forecast, by Type 2020 & 2033
- Table 39: Global Battery Technology Revenue million Forecast, by Country 2020 & 2033
- Table 40: China Battery Technology Revenue (million) Forecast, by Application 2020 & 2033
- Table 41: India Battery Technology Revenue (million) Forecast, by Application 2020 & 2033
- Table 42: Japan Battery Technology Revenue (million) Forecast, by Application 2020 & 2033
- Table 43: South Korea Battery Technology Revenue (million) Forecast, by Application 2020 & 2033
- Table 44: ASEAN Battery Technology Revenue (million) Forecast, by Application 2020 & 2033
- Table 45: Oceania Battery Technology Revenue (million) Forecast, by Application 2020 & 2033
- Table 46: Rest of Asia Pacific Battery Technology Revenue (million) Forecast, by Application 2020 & 2033
Frequently Asked Questions
1. What is the projected Compound Annual Growth Rate (CAGR) of the Battery Technology?
The projected CAGR is approximately 7.8%.
2. Which companies are prominent players in the Battery Technology?
Key companies in the market include Johnson Controls, Chaowei Power, GS Yuasa, Exide Technologies, CATL, East Penn Manufacturing, BYD, Panasonic, PEVE, EnerSys, OptimumNano, Camel, Exide Industries, LG Chem, GuoXuan, FIAMM, SAMSUNG SDI, Fengfan, Amara Raja Batteries, AESC, Lishen, Hitachi, Banner Batteries.
3. What are the main segments of the Battery Technology?
The market segments include Application, Type.
4. Can you provide details about the market size?
The market size is estimated to be USD 136660 million as of 2022.
5. What are some drivers contributing to market growth?
N/A
6. What are the notable trends driving market growth?
N/A
7. Are there any restraints impacting market growth?
N/A
8. Can you provide examples of recent developments in the market?
N/A
9. What pricing options are available for accessing the report?
Pricing options include single-user, multi-user, and enterprise licenses priced at USD 5900.00, USD 8850.00, and USD 11800.00 respectively.
10. Is the market size provided in terms of value or volume?
The market size is provided in terms of value, measured in million.
11. Are there any specific market keywords associated with the report?
Yes, the market keyword associated with the report is "Battery Technology," which aids in identifying and referencing the specific market segment covered.
12. How do I determine which pricing option suits my needs best?
The pricing options vary based on user requirements and access needs. Individual users may opt for single-user licenses, while businesses requiring broader access may choose multi-user or enterprise licenses for cost-effective access to the report.
13. Are there any additional resources or data provided in the Battery Technology report?
While the report offers comprehensive insights, it's advisable to review the specific contents or supplementary materials provided to ascertain if additional resources or data are available.
14. How can I stay updated on further developments or reports in the Battery Technology?
To stay informed about further developments, trends, and reports in the Battery Technology, consider subscribing to industry newsletters, following relevant companies and organizations, or regularly checking reputable industry news sources and publications.
Methodology
Step 1 - Identification of Relevant Samples Size from Population Database


Step 2 - Approaches for Defining Global Market Size (Value, Volume* & Price*)

Note*: In applicable scenarios
Step 3 - Data Sources
Primary Research
- Web Analytics
- Survey Reports
- Research Institute
- Latest Research Reports
- Opinion Leaders
Secondary Research
- Annual Reports
- White Paper
- Latest Press Release
- Industry Association
- Paid Database
- Investor Presentations

Step 4 - Data Triangulation
Involves using different sources of information in order to increase the validity of a study
These sources are likely to be stakeholders in a program - participants, other researchers, program staff, other community members, and so on.
Then we put all data in single framework & apply various statistical tools to find out the dynamic on the market.
During the analysis stage, feedback from the stakeholder groups would be compared to determine areas of agreement as well as areas of divergence