Key Insights
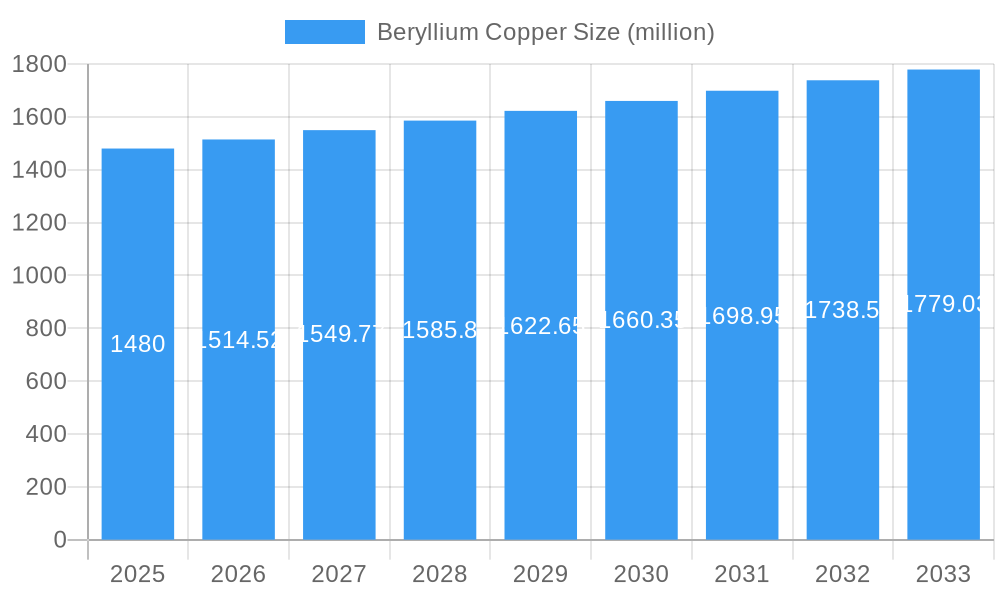
The global Beryllium Copper market is poised for steady expansion, projected to reach a significant valuation driven by its unique properties and diverse industrial applications. With an estimated market size of $1480 million in the base year of 2025, the market is expected to grow at a Compound Annual Growth Rate (CAGR) of 2.3% through 2033. This sustained growth underscores the increasing demand for high-performance materials in critical sectors. Beryllium copper's exceptional strength, conductivity, and non-magnetic properties make it indispensable in the manufacturing of telecommunications equipment, consumer electronics, and industrial machinery. As these industries continue to innovate and expand, particularly in areas like 5G infrastructure and advanced consumer devices, the demand for beryllium copper is set to rise. Furthermore, its application in the automotive sector, especially for electrical connectors and components in electric vehicles (EVs), represents a significant growth avenue. The inherent properties of beryllium copper contribute to enhanced performance, reliability, and miniaturization, aligning perfectly with the evolving needs of these dynamic markets.
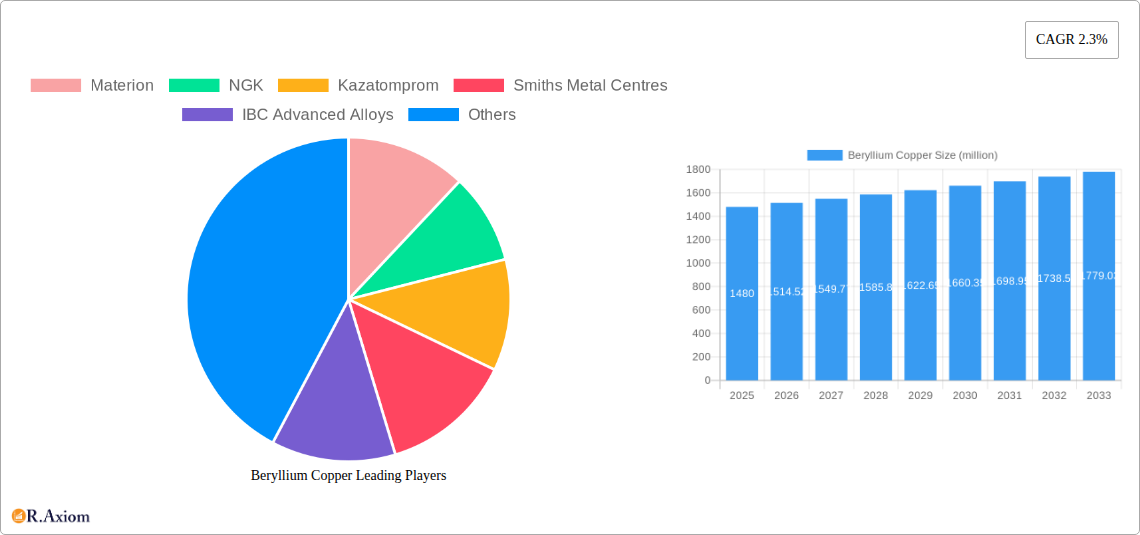
Beryllium Copper Market Size (In Billion)
The market landscape for beryllium copper is characterized by distinct trends and influencing factors. Key growth drivers include the relentless pursuit of miniaturization and higher performance in electronics, the expanding adoption of electric vehicles, and the ongoing development of advanced industrial and aerospace technologies. Emerging trends indicate a growing preference for specialized beryllium copper alloys tailored to specific application requirements, alongside increasing investments in research and development to enhance material properties and manufacturing efficiency. However, the market also faces certain restraints. Regulatory scrutiny and environmental concerns surrounding beryllium are a significant factor, necessitating stringent handling and disposal protocols, which can add to production costs and influence material selection. Additionally, the availability and price volatility of raw beryllium, coupled with the complexity of its processing, present ongoing challenges for manufacturers. Despite these headwinds, the unique performance advantages offered by beryllium copper ensure its continued relevance and demand across a spectrum of high-tech and critical industries.
Beryllium Copper Company Market Share
Here is your SEO-optimized, detailed report description for Beryllium Copper, ready for immediate use:
Beryllium Copper Market Concentration & Innovation
The global beryllium copper market exhibits a moderate concentration, with key players like Materion, NGK, and Kazatomprom holding significant market shares. Innovation is a critical driver, fueled by advancements in material science leading to enhanced alloy properties, such as improved conductivity, strength, and corrosion resistance. These innovations are particularly crucial for high-demand applications in Telecommunications Equipment and Aerospace. Regulatory frameworks, especially concerning beryllium handling and disposal, continue to shape market dynamics, influencing production processes and material choices. While direct product substitutes with identical performance characteristics are limited, high-strength aluminum alloys and specialized copper alloys are considered indirect alternatives in certain less demanding applications. End-user trends are steering demand towards lighter, more durable, and highly conductive materials. Mergers and Acquisitions (M&A) activity is expected to continue, with strategic consolidations aimed at expanding market reach and technological capabilities. For instance, potential M&A deal values in the sector are estimated to reach over xx million. Market share analysis indicates that Telecommunications Equipment currently accounts for approximately xx% of the total market.
Beryllium Copper Industry Trends & Insights
The beryllium copper industry is poised for robust growth, driven by increasing demand from rapidly expanding sectors such as Telecommunications Equipment, Consumer Electronics, and the Automotive industry. The projected Compound Annual Growth Rate (CAGR) for the forecast period 2025–2033 is an estimated xx%, signaling a healthy upward trajectory. Technological disruptions, including advancements in additive manufacturing (3D printing) of beryllium copper alloys, are opening new avenues for complex component design and production, particularly in Aerospace applications. Consumer preferences are evolving towards miniaturization and enhanced performance in electronic devices, directly benefiting the use of beryllium copper for its superior electrical and thermal conductivity and mechanical strength. Competitive dynamics are characterized by a focus on product quality, supply chain reliability, and meeting stringent industry specifications. Market penetration is steadily increasing across various segments, with North America and Asia-Pacific leading the adoption rates due to significant investments in infrastructure and manufacturing. The historical period of 2019–2024 saw a market valuation of approximately xx million, with steady year-on-year growth. Future market penetration in niche applications like high-performance connectors is projected to reach xx% by 2033.
Dominant Markets & Segments in Beryllium Copper
The dominant market for beryllium copper is projected to remain in Asia-Pacific, driven by its status as a global manufacturing hub and the substantial growth in its Telecommunications Equipment and Consumer Electronics sectors. Within this region, China stands out as a leading country, supported by its extensive industrial base and significant investments in technological advancements.
Application Dominance:
- Telecommunications Equipment: This segment is expected to maintain its leading position due to the ongoing 5G rollout and the increasing demand for high-performance connectors, switches, and components that require beryllium copper's exceptional conductivity and reliability. Economic policies promoting digital infrastructure development are key drivers here.
- Consumer Electronics: The miniaturization and increasing functionality of electronic devices necessitate materials offering superior performance. Beryllium copper is crucial for components in smartphones, laptops, and gaming consoles, where space is limited and heat dissipation is critical.
- Industrial Equipment: Applications in heavy machinery, power distribution, and automation rely on beryllium copper for its durability, corrosion resistance, and electrical properties, especially in harsh environments. Infrastructure development plays a vital role in sustaining this segment's growth.
- Automobile: With the rise of electric vehicles (EVs) and advanced driver-assistance systems (ADAS), the demand for high-performance electrical connectors and battery components made from beryllium copper is surging. Stringent safety and performance standards are pushing adoption.
- Aerospace: This high-value segment utilizes beryllium copper for its lightweight yet strong properties, critical in aircraft components, connectors, and engine parts where reliability under extreme conditions is paramount. Government defense spending and commercial aviation growth are key drivers.
Type Dominance:
- Rod & Bar: This form factor is dominant due to its versatility in manufacturing a wide range of components, from connectors to fasteners, for all major applications.
- Plate & Strip: Crucial for stamping and forming intricate parts used in electronic connectors, switches, and automotive components, this type is seeing consistent demand.
- Wire: Essential for specialized applications in electronics and telecommunications requiring high conductivity and flexibility.
Beryllium Copper Product Developments
Recent product developments in the beryllium copper market are focused on creating specialized alloys with tailored properties. Innovations include enhanced high-temperature performance alloys for demanding automotive and aerospace applications, and new formulations offering improved machinability for complex consumer electronics components. Competitive advantages are being derived from increased tensile strength and superior electrical conductivity, enabling the development of smaller, more efficient devices. The market fit for these advanced materials is exceptionally strong in sectors prioritizing miniaturization, thermal management, and long-term reliability.
Report Scope & Segmentation Analysis
This report meticulously segments the beryllium copper market by application and product type.
- Telecommunications Equipment: This segment, valued at an estimated xx million in 2025, is projected to grow at a CAGR of xx% through 2033, driven by global 5G infrastructure expansion and the need for high-speed data transmission components.
- Consumer Electronics: Valued at approximately xx million in 2025, this segment is expected to witness a CAGR of xx%, fueled by the demand for advanced smartphones, wearables, and other portable devices requiring compact and high-performance materials.
- Industrial Equipment: With an estimated market size of xx million in 2025, this segment will likely grow at a CAGR of xx%, driven by industrial automation, power generation, and the need for durable, reliable components.
- Automobile: This segment, projected at xx million in 2025, is set for a robust CAGR of xx%, propelled by the increasing adoption of electric vehicles and advanced electronic systems in conventional vehicles.
- Aerospace: Valued at xx million in 2025, the aerospace segment is anticipated to grow at a CAGR of xx%, driven by stringent safety standards and the demand for lightweight, high-strength alloys in aircraft manufacturing.
- Rod & Bar: This type, with a projected market value of xx million in 2025, is expected to grow at a CAGR of xx%, owing to its widespread use in various manufacturing processes.
- Plate & Strip: Estimated at xx million in 2025, this type is forecasted to expand at a CAGR of xx%, serving the needs of intricate component manufacturing.
- Wire: Valued at xx million in 2025, the wire segment is projected to grow at a CAGR of xx%, catering to specialized electrical and telecommunication applications.
- Billet: With a market size of xx million in 2025, billet is expected to grow at a CAGR of xx%, serving as a precursor for various beryllium copper products.
- Others: This segment, estimated at xx million in 2025, will grow at a CAGR of xx%, encompassing niche applications and emerging uses.
Key Drivers of Beryllium Copper Growth
The growth of the beryllium copper market is primarily propelled by several key factors. Technologically, the indispensable properties of beryllium copper, such as exceptional electrical and thermal conductivity, high strength, and corrosion resistance, make it critical for advanced applications in Telecommunications Equipment and Aerospace. Economically, the global expansion of 5G networks, the proliferation of electric vehicles, and the increasing demand for sophisticated consumer electronics are creating a strong pull for these high-performance alloys. Regulatory drivers, while sometimes posing challenges, also encourage the development of safer handling practices and more environmentally conscious production methods, indirectly fostering innovation. Specific examples include the need for beryllium copper in high-frequency connectors for 5G base stations and in robust battery management systems for EVs.
Challenges in the Beryllium Copper Sector
Despite its advantageous properties, the beryllium copper sector faces significant challenges. Regulatory hurdles, particularly concerning the health risks associated with beryllium dust inhalation, lead to stringent handling protocols and increased compliance costs for manufacturers. Supply chain disruptions, as seen with the concentration of raw material sources and geopolitical factors impacting availability, can lead to price volatility and extended lead times. Furthermore, intense competitive pressures from alternative materials that offer comparable, albeit not identical, performance at lower price points, especially in less critical applications, pose a constant threat. The perceived toxicity of beryllium also creates a barrier for wider adoption in certain consumer-facing products, requiring significant investment in public perception and education. The global market size for beryllium ore is estimated to be around xx million.
Emerging Opportunities in Beryllium Copper
Emerging opportunities in the beryllium copper market are diverse and promising. The burgeoning electric vehicle (EV) market presents a significant avenue, with beryllium copper being crucial for high-performance connectors, battery components, and thermal management systems due to its excellent conductivity and mechanical integrity. Advancements in additive manufacturing (3D printing) are opening doors for the creation of complex, lightweight beryllium copper parts for aerospace and medical devices, reducing manufacturing complexity and cost. The continuous expansion of 5G infrastructure globally necessitates reliable and high-performance components, a direct demand driver for beryllium copper. Furthermore, the increasing focus on renewable energy technologies, such as advanced solar panels and wind turbines, requires durable and conductive materials, offering new application frontiers. The growing demand for high-performance computing and data centers also fuels the need for specialized beryllium copper connectors.
Leading Players in the Beryllium Copper Market
- Materion
- NGK
- Kazatomprom
- Smiths Metal Centres
- IBC Advanced Alloys
- Belmont Metals
- CNMC
- XJNM
- Jinfeng Metal
- Zhuhai Dahua
Key Developments in Beryllium Copper Industry
- 2023 January: Materion launches a new high-performance beryllium copper alloy for advanced telecommunications applications, enhancing signal integrity.
- 2022 August: NGK announces significant investment in expanding its beryllium copper production capacity to meet growing automotive demand.
- 2021 December: Smiths Metal Centres strengthens its distribution network in Europe for beryllium copper products, improving accessibility for industrial clients.
- 2020 September: IBC Advanced Alloys showcases advancements in additive manufacturing of beryllium copper for aerospace components.
- 2019 November: Belmont Metals introduces a new eco-friendly smelting process for beryllium copper, reducing environmental impact.
Strategic Outlook for Beryllium Copper Market
The strategic outlook for the beryllium copper market is highly positive, driven by persistent demand from critical growth sectors. The ongoing global transition towards electric mobility and the continuous expansion of telecommunications infrastructure, particularly 5G, will remain primary growth catalysts. Innovations in material science, enabling the development of alloys with even higher performance characteristics, will further solidify beryllium copper's position in high-value applications. Strategic collaborations and potential mergers and acquisitions among key players are anticipated to optimize supply chains and expand market reach. Addressing regulatory challenges through continued investment in safe handling practices and research will be crucial for sustained growth. The market's future hinges on its ability to adapt to evolving technological demands and capitalize on emerging opportunities in advanced manufacturing and sustainable energy solutions.
Beryllium Copper Segmentation
-
1. Application
- 1.1. Telecommunications Equipment
- 1.2. Consumer Electronics
- 1.3. Industrial Equipment
- 1.4. Automobile
- 1.5. Aerospace
- 1.6. Other
-
2. Type
- 2.1. Rod & Bar
- 2.2. Plate & Strip
- 2.3. Wire
- 2.4. Billet
- 2.5. Others
Beryllium Copper Segmentation By Geography
-
1. North America
- 1.1. United States
- 1.2. Canada
- 1.3. Mexico
-
2. South America
- 2.1. Brazil
- 2.2. Argentina
- 2.3. Rest of South America
-
3. Europe
- 3.1. United Kingdom
- 3.2. Germany
- 3.3. France
- 3.4. Italy
- 3.5. Spain
- 3.6. Russia
- 3.7. Benelux
- 3.8. Nordics
- 3.9. Rest of Europe
-
4. Middle East & Africa
- 4.1. Turkey
- 4.2. Israel
- 4.3. GCC
- 4.4. North Africa
- 4.5. South Africa
- 4.6. Rest of Middle East & Africa
-
5. Asia Pacific
- 5.1. China
- 5.2. India
- 5.3. Japan
- 5.4. South Korea
- 5.5. ASEAN
- 5.6. Oceania
- 5.7. Rest of Asia Pacific
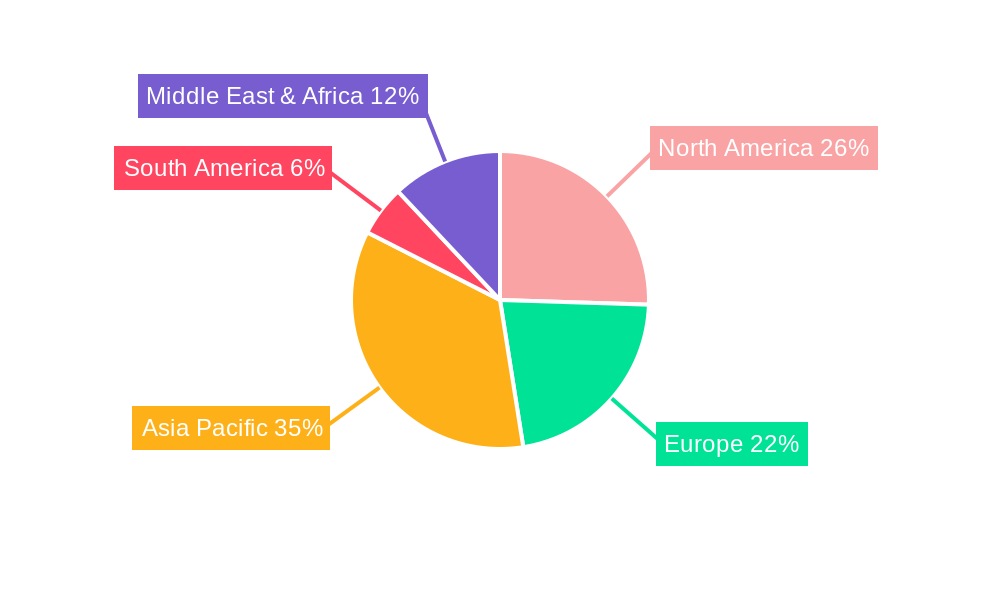
Beryllium Copper Regional Market Share
Geographic Coverage of Beryllium Copper
Beryllium Copper REPORT HIGHLIGHTS
| Aspects | Details |
|---|---|
| Study Period | 2020-2034 |
| Base Year | 2025 |
| Estimated Year | 2026 |
| Forecast Period | 2026-2034 |
| Historical Period | 2020-2025 |
| Growth Rate | CAGR of 2.3% from 2020-2034 |
| Segmentation |
|
Table of Contents
- 1. Introduction
- 1.1. Research Scope
- 1.2. Market Segmentation
- 1.3. Research Objective
- 1.4. Definitions and Assumptions
- 2. Executive Summary
- 2.1. Market Snapshot
- 3. Market Dynamics
- 3.1. Market Drivers
- 3.2. Market Restrains
- 3.3. Market Trends
- 3.4. Market Opportunities
- 4. Market Factor Analysis
- 4.1. Porters Five Forces
- 4.1.1. Bargaining Power of Suppliers
- 4.1.2. Bargaining Power of Buyers
- 4.1.3. Threat of New Entrants
- 4.1.4. Threat of Substitutes
- 4.1.5. Competitive Rivalry
- 4.2. PESTEL analysis
- 4.3. BCG Analysis
- 4.3.1. Stars (High Growth, High Market Share)
- 4.3.2. Cash Cows (Low Growth, High Market Share)
- 4.3.3. Question Mark (High Growth, Low Market Share)
- 4.3.4. Dogs (Low Growth, Low Market Share)
- 4.4. Ansoff Matrix Analysis
- 4.5. Supply Chain Analysis
- 4.6. Regulatory Landscape
- 4.7. Current Market Potential and Opportunity Assessment (TAM–SAM–SOM Framework)
- 4.8. RAX Analyst Note
- 4.1. Porters Five Forces
- 5. Market Analysis, Insights and Forecast 2021-2033
- 5.1. Market Analysis, Insights and Forecast - by Application
- 5.1.1. Telecommunications Equipment
- 5.1.2. Consumer Electronics
- 5.1.3. Industrial Equipment
- 5.1.4. Automobile
- 5.1.5. Aerospace
- 5.1.6. Other
- 5.2. Market Analysis, Insights and Forecast - by Type
- 5.2.1. Rod & Bar
- 5.2.2. Plate & Strip
- 5.2.3. Wire
- 5.2.4. Billet
- 5.2.5. Others
- 5.3. Market Analysis, Insights and Forecast - by Region
- 5.3.1. North America
- 5.3.2. South America
- 5.3.3. Europe
- 5.3.4. Middle East & Africa
- 5.3.5. Asia Pacific
- 5.1. Market Analysis, Insights and Forecast - by Application
- 6. Global Beryllium Copper Analysis, Insights and Forecast, 2021-2033
- 6.1. Market Analysis, Insights and Forecast - by Application
- 6.1.1. Telecommunications Equipment
- 6.1.2. Consumer Electronics
- 6.1.3. Industrial Equipment
- 6.1.4. Automobile
- 6.1.5. Aerospace
- 6.1.6. Other
- 6.2. Market Analysis, Insights and Forecast - by Type
- 6.2.1. Rod & Bar
- 6.2.2. Plate & Strip
- 6.2.3. Wire
- 6.2.4. Billet
- 6.2.5. Others
- 6.1. Market Analysis, Insights and Forecast - by Application
- 7. North America Beryllium Copper Analysis, Insights and Forecast, 2020-2032
- 7.1. Market Analysis, Insights and Forecast - by Application
- 7.1.1. Telecommunications Equipment
- 7.1.2. Consumer Electronics
- 7.1.3. Industrial Equipment
- 7.1.4. Automobile
- 7.1.5. Aerospace
- 7.1.6. Other
- 7.2. Market Analysis, Insights and Forecast - by Type
- 7.2.1. Rod & Bar
- 7.2.2. Plate & Strip
- 7.2.3. Wire
- 7.2.4. Billet
- 7.2.5. Others
- 7.1. Market Analysis, Insights and Forecast - by Application
- 8. South America Beryllium Copper Analysis, Insights and Forecast, 2020-2032
- 8.1. Market Analysis, Insights and Forecast - by Application
- 8.1.1. Telecommunications Equipment
- 8.1.2. Consumer Electronics
- 8.1.3. Industrial Equipment
- 8.1.4. Automobile
- 8.1.5. Aerospace
- 8.1.6. Other
- 8.2. Market Analysis, Insights and Forecast - by Type
- 8.2.1. Rod & Bar
- 8.2.2. Plate & Strip
- 8.2.3. Wire
- 8.2.4. Billet
- 8.2.5. Others
- 8.1. Market Analysis, Insights and Forecast - by Application
- 9. Europe Beryllium Copper Analysis, Insights and Forecast, 2020-2032
- 9.1. Market Analysis, Insights and Forecast - by Application
- 9.1.1. Telecommunications Equipment
- 9.1.2. Consumer Electronics
- 9.1.3. Industrial Equipment
- 9.1.4. Automobile
- 9.1.5. Aerospace
- 9.1.6. Other
- 9.2. Market Analysis, Insights and Forecast - by Type
- 9.2.1. Rod & Bar
- 9.2.2. Plate & Strip
- 9.2.3. Wire
- 9.2.4. Billet
- 9.2.5. Others
- 9.1. Market Analysis, Insights and Forecast - by Application
- 10. Middle East & Africa Beryllium Copper Analysis, Insights and Forecast, 2020-2032
- 10.1. Market Analysis, Insights and Forecast - by Application
- 10.1.1. Telecommunications Equipment
- 10.1.2. Consumer Electronics
- 10.1.3. Industrial Equipment
- 10.1.4. Automobile
- 10.1.5. Aerospace
- 10.1.6. Other
- 10.2. Market Analysis, Insights and Forecast - by Type
- 10.2.1. Rod & Bar
- 10.2.2. Plate & Strip
- 10.2.3. Wire
- 10.2.4. Billet
- 10.2.5. Others
- 10.1. Market Analysis, Insights and Forecast - by Application
- 11. Asia Pacific Beryllium Copper Analysis, Insights and Forecast, 2020-2032
- 11.1. Market Analysis, Insights and Forecast - by Application
- 11.1.1. Telecommunications Equipment
- 11.1.2. Consumer Electronics
- 11.1.3. Industrial Equipment
- 11.1.4. Automobile
- 11.1.5. Aerospace
- 11.1.6. Other
- 11.2. Market Analysis, Insights and Forecast - by Type
- 11.2.1. Rod & Bar
- 11.2.2. Plate & Strip
- 11.2.3. Wire
- 11.2.4. Billet
- 11.2.5. Others
- 11.1. Market Analysis, Insights and Forecast - by Application
- 12. Competitive Analysis
- 12.1. Company Profiles
- 12.1.1 Materion
- 12.1.1.1. Company Overview
- 12.1.1.2. Products
- 12.1.1.3. Company Financials
- 12.1.1.4. SWOT Analysis
- 12.1.2 NGK
- 12.1.2.1. Company Overview
- 12.1.2.2. Products
- 12.1.2.3. Company Financials
- 12.1.2.4. SWOT Analysis
- 12.1.3 Kazatomprom
- 12.1.3.1. Company Overview
- 12.1.3.2. Products
- 12.1.3.3. Company Financials
- 12.1.3.4. SWOT Analysis
- 12.1.4 Smiths Metal Centres
- 12.1.4.1. Company Overview
- 12.1.4.2. Products
- 12.1.4.3. Company Financials
- 12.1.4.4. SWOT Analysis
- 12.1.5 IBC Advanced Alloys
- 12.1.5.1. Company Overview
- 12.1.5.2. Products
- 12.1.5.3. Company Financials
- 12.1.5.4. SWOT Analysis
- 12.1.6 Belmont Metals
- 12.1.6.1. Company Overview
- 12.1.6.2. Products
- 12.1.6.3. Company Financials
- 12.1.6.4. SWOT Analysis
- 12.1.7 CNMC
- 12.1.7.1. Company Overview
- 12.1.7.2. Products
- 12.1.7.3. Company Financials
- 12.1.7.4. SWOT Analysis
- 12.1.8 XJNM
- 12.1.8.1. Company Overview
- 12.1.8.2. Products
- 12.1.8.3. Company Financials
- 12.1.8.4. SWOT Analysis
- 12.1.9 Jinfeng Metal
- 12.1.9.1. Company Overview
- 12.1.9.2. Products
- 12.1.9.3. Company Financials
- 12.1.9.4. SWOT Analysis
- 12.1.10 Zhuhai Dahua
- 12.1.10.1. Company Overview
- 12.1.10.2. Products
- 12.1.10.3. Company Financials
- 12.1.10.4. SWOT Analysis
- 12.1.1 Materion
- 12.2. Market Entropy
- 12.2.1 Company's Key Areas Served
- 12.2.2 Recent Developments
- 12.3. Company Market Share Analysis 2025
- 12.3.1 Top 5 Companies Market Share Analysis
- 12.3.2 Top 3 Companies Market Share Analysis
- 12.4. List of Potential Customers
- 13. Research Methodology
List of Figures
- Figure 1: Global Beryllium Copper Revenue Breakdown (million, %) by Region 2025 & 2033
- Figure 2: Global Beryllium Copper Volume Breakdown (K, %) by Region 2025 & 2033
- Figure 3: North America Beryllium Copper Revenue (million), by Application 2025 & 2033
- Figure 4: North America Beryllium Copper Volume (K), by Application 2025 & 2033
- Figure 5: North America Beryllium Copper Revenue Share (%), by Application 2025 & 2033
- Figure 6: North America Beryllium Copper Volume Share (%), by Application 2025 & 2033
- Figure 7: North America Beryllium Copper Revenue (million), by Type 2025 & 2033
- Figure 8: North America Beryllium Copper Volume (K), by Type 2025 & 2033
- Figure 9: North America Beryllium Copper Revenue Share (%), by Type 2025 & 2033
- Figure 10: North America Beryllium Copper Volume Share (%), by Type 2025 & 2033
- Figure 11: North America Beryllium Copper Revenue (million), by Country 2025 & 2033
- Figure 12: North America Beryllium Copper Volume (K), by Country 2025 & 2033
- Figure 13: North America Beryllium Copper Revenue Share (%), by Country 2025 & 2033
- Figure 14: North America Beryllium Copper Volume Share (%), by Country 2025 & 2033
- Figure 15: South America Beryllium Copper Revenue (million), by Application 2025 & 2033
- Figure 16: South America Beryllium Copper Volume (K), by Application 2025 & 2033
- Figure 17: South America Beryllium Copper Revenue Share (%), by Application 2025 & 2033
- Figure 18: South America Beryllium Copper Volume Share (%), by Application 2025 & 2033
- Figure 19: South America Beryllium Copper Revenue (million), by Type 2025 & 2033
- Figure 20: South America Beryllium Copper Volume (K), by Type 2025 & 2033
- Figure 21: South America Beryllium Copper Revenue Share (%), by Type 2025 & 2033
- Figure 22: South America Beryllium Copper Volume Share (%), by Type 2025 & 2033
- Figure 23: South America Beryllium Copper Revenue (million), by Country 2025 & 2033
- Figure 24: South America Beryllium Copper Volume (K), by Country 2025 & 2033
- Figure 25: South America Beryllium Copper Revenue Share (%), by Country 2025 & 2033
- Figure 26: South America Beryllium Copper Volume Share (%), by Country 2025 & 2033
- Figure 27: Europe Beryllium Copper Revenue (million), by Application 2025 & 2033
- Figure 28: Europe Beryllium Copper Volume (K), by Application 2025 & 2033
- Figure 29: Europe Beryllium Copper Revenue Share (%), by Application 2025 & 2033
- Figure 30: Europe Beryllium Copper Volume Share (%), by Application 2025 & 2033
- Figure 31: Europe Beryllium Copper Revenue (million), by Type 2025 & 2033
- Figure 32: Europe Beryllium Copper Volume (K), by Type 2025 & 2033
- Figure 33: Europe Beryllium Copper Revenue Share (%), by Type 2025 & 2033
- Figure 34: Europe Beryllium Copper Volume Share (%), by Type 2025 & 2033
- Figure 35: Europe Beryllium Copper Revenue (million), by Country 2025 & 2033
- Figure 36: Europe Beryllium Copper Volume (K), by Country 2025 & 2033
- Figure 37: Europe Beryllium Copper Revenue Share (%), by Country 2025 & 2033
- Figure 38: Europe Beryllium Copper Volume Share (%), by Country 2025 & 2033
- Figure 39: Middle East & Africa Beryllium Copper Revenue (million), by Application 2025 & 2033
- Figure 40: Middle East & Africa Beryllium Copper Volume (K), by Application 2025 & 2033
- Figure 41: Middle East & Africa Beryllium Copper Revenue Share (%), by Application 2025 & 2033
- Figure 42: Middle East & Africa Beryllium Copper Volume Share (%), by Application 2025 & 2033
- Figure 43: Middle East & Africa Beryllium Copper Revenue (million), by Type 2025 & 2033
- Figure 44: Middle East & Africa Beryllium Copper Volume (K), by Type 2025 & 2033
- Figure 45: Middle East & Africa Beryllium Copper Revenue Share (%), by Type 2025 & 2033
- Figure 46: Middle East & Africa Beryllium Copper Volume Share (%), by Type 2025 & 2033
- Figure 47: Middle East & Africa Beryllium Copper Revenue (million), by Country 2025 & 2033
- Figure 48: Middle East & Africa Beryllium Copper Volume (K), by Country 2025 & 2033
- Figure 49: Middle East & Africa Beryllium Copper Revenue Share (%), by Country 2025 & 2033
- Figure 50: Middle East & Africa Beryllium Copper Volume Share (%), by Country 2025 & 2033
- Figure 51: Asia Pacific Beryllium Copper Revenue (million), by Application 2025 & 2033
- Figure 52: Asia Pacific Beryllium Copper Volume (K), by Application 2025 & 2033
- Figure 53: Asia Pacific Beryllium Copper Revenue Share (%), by Application 2025 & 2033
- Figure 54: Asia Pacific Beryllium Copper Volume Share (%), by Application 2025 & 2033
- Figure 55: Asia Pacific Beryllium Copper Revenue (million), by Type 2025 & 2033
- Figure 56: Asia Pacific Beryllium Copper Volume (K), by Type 2025 & 2033
- Figure 57: Asia Pacific Beryllium Copper Revenue Share (%), by Type 2025 & 2033
- Figure 58: Asia Pacific Beryllium Copper Volume Share (%), by Type 2025 & 2033
- Figure 59: Asia Pacific Beryllium Copper Revenue (million), by Country 2025 & 2033
- Figure 60: Asia Pacific Beryllium Copper Volume (K), by Country 2025 & 2033
- Figure 61: Asia Pacific Beryllium Copper Revenue Share (%), by Country 2025 & 2033
- Figure 62: Asia Pacific Beryllium Copper Volume Share (%), by Country 2025 & 2033
List of Tables
- Table 1: Global Beryllium Copper Revenue million Forecast, by Application 2020 & 2033
- Table 2: Global Beryllium Copper Volume K Forecast, by Application 2020 & 2033
- Table 3: Global Beryllium Copper Revenue million Forecast, by Type 2020 & 2033
- Table 4: Global Beryllium Copper Volume K Forecast, by Type 2020 & 2033
- Table 5: Global Beryllium Copper Revenue million Forecast, by Region 2020 & 2033
- Table 6: Global Beryllium Copper Volume K Forecast, by Region 2020 & 2033
- Table 7: Global Beryllium Copper Revenue million Forecast, by Application 2020 & 2033
- Table 8: Global Beryllium Copper Volume K Forecast, by Application 2020 & 2033
- Table 9: Global Beryllium Copper Revenue million Forecast, by Type 2020 & 2033
- Table 10: Global Beryllium Copper Volume K Forecast, by Type 2020 & 2033
- Table 11: Global Beryllium Copper Revenue million Forecast, by Country 2020 & 2033
- Table 12: Global Beryllium Copper Volume K Forecast, by Country 2020 & 2033
- Table 13: United States Beryllium Copper Revenue (million) Forecast, by Application 2020 & 2033
- Table 14: United States Beryllium Copper Volume (K) Forecast, by Application 2020 & 2033
- Table 15: Canada Beryllium Copper Revenue (million) Forecast, by Application 2020 & 2033
- Table 16: Canada Beryllium Copper Volume (K) Forecast, by Application 2020 & 2033
- Table 17: Mexico Beryllium Copper Revenue (million) Forecast, by Application 2020 & 2033
- Table 18: Mexico Beryllium Copper Volume (K) Forecast, by Application 2020 & 2033
- Table 19: Global Beryllium Copper Revenue million Forecast, by Application 2020 & 2033
- Table 20: Global Beryllium Copper Volume K Forecast, by Application 2020 & 2033
- Table 21: Global Beryllium Copper Revenue million Forecast, by Type 2020 & 2033
- Table 22: Global Beryllium Copper Volume K Forecast, by Type 2020 & 2033
- Table 23: Global Beryllium Copper Revenue million Forecast, by Country 2020 & 2033
- Table 24: Global Beryllium Copper Volume K Forecast, by Country 2020 & 2033
- Table 25: Brazil Beryllium Copper Revenue (million) Forecast, by Application 2020 & 2033
- Table 26: Brazil Beryllium Copper Volume (K) Forecast, by Application 2020 & 2033
- Table 27: Argentina Beryllium Copper Revenue (million) Forecast, by Application 2020 & 2033
- Table 28: Argentina Beryllium Copper Volume (K) Forecast, by Application 2020 & 2033
- Table 29: Rest of South America Beryllium Copper Revenue (million) Forecast, by Application 2020 & 2033
- Table 30: Rest of South America Beryllium Copper Volume (K) Forecast, by Application 2020 & 2033
- Table 31: Global Beryllium Copper Revenue million Forecast, by Application 2020 & 2033
- Table 32: Global Beryllium Copper Volume K Forecast, by Application 2020 & 2033
- Table 33: Global Beryllium Copper Revenue million Forecast, by Type 2020 & 2033
- Table 34: Global Beryllium Copper Volume K Forecast, by Type 2020 & 2033
- Table 35: Global Beryllium Copper Revenue million Forecast, by Country 2020 & 2033
- Table 36: Global Beryllium Copper Volume K Forecast, by Country 2020 & 2033
- Table 37: United Kingdom Beryllium Copper Revenue (million) Forecast, by Application 2020 & 2033
- Table 38: United Kingdom Beryllium Copper Volume (K) Forecast, by Application 2020 & 2033
- Table 39: Germany Beryllium Copper Revenue (million) Forecast, by Application 2020 & 2033
- Table 40: Germany Beryllium Copper Volume (K) Forecast, by Application 2020 & 2033
- Table 41: France Beryllium Copper Revenue (million) Forecast, by Application 2020 & 2033
- Table 42: France Beryllium Copper Volume (K) Forecast, by Application 2020 & 2033
- Table 43: Italy Beryllium Copper Revenue (million) Forecast, by Application 2020 & 2033
- Table 44: Italy Beryllium Copper Volume (K) Forecast, by Application 2020 & 2033
- Table 45: Spain Beryllium Copper Revenue (million) Forecast, by Application 2020 & 2033
- Table 46: Spain Beryllium Copper Volume (K) Forecast, by Application 2020 & 2033
- Table 47: Russia Beryllium Copper Revenue (million) Forecast, by Application 2020 & 2033
- Table 48: Russia Beryllium Copper Volume (K) Forecast, by Application 2020 & 2033
- Table 49: Benelux Beryllium Copper Revenue (million) Forecast, by Application 2020 & 2033
- Table 50: Benelux Beryllium Copper Volume (K) Forecast, by Application 2020 & 2033
- Table 51: Nordics Beryllium Copper Revenue (million) Forecast, by Application 2020 & 2033
- Table 52: Nordics Beryllium Copper Volume (K) Forecast, by Application 2020 & 2033
- Table 53: Rest of Europe Beryllium Copper Revenue (million) Forecast, by Application 2020 & 2033
- Table 54: Rest of Europe Beryllium Copper Volume (K) Forecast, by Application 2020 & 2033
- Table 55: Global Beryllium Copper Revenue million Forecast, by Application 2020 & 2033
- Table 56: Global Beryllium Copper Volume K Forecast, by Application 2020 & 2033
- Table 57: Global Beryllium Copper Revenue million Forecast, by Type 2020 & 2033
- Table 58: Global Beryllium Copper Volume K Forecast, by Type 2020 & 2033
- Table 59: Global Beryllium Copper Revenue million Forecast, by Country 2020 & 2033
- Table 60: Global Beryllium Copper Volume K Forecast, by Country 2020 & 2033
- Table 61: Turkey Beryllium Copper Revenue (million) Forecast, by Application 2020 & 2033
- Table 62: Turkey Beryllium Copper Volume (K) Forecast, by Application 2020 & 2033
- Table 63: Israel Beryllium Copper Revenue (million) Forecast, by Application 2020 & 2033
- Table 64: Israel Beryllium Copper Volume (K) Forecast, by Application 2020 & 2033
- Table 65: GCC Beryllium Copper Revenue (million) Forecast, by Application 2020 & 2033
- Table 66: GCC Beryllium Copper Volume (K) Forecast, by Application 2020 & 2033
- Table 67: North Africa Beryllium Copper Revenue (million) Forecast, by Application 2020 & 2033
- Table 68: North Africa Beryllium Copper Volume (K) Forecast, by Application 2020 & 2033
- Table 69: South Africa Beryllium Copper Revenue (million) Forecast, by Application 2020 & 2033
- Table 70: South Africa Beryllium Copper Volume (K) Forecast, by Application 2020 & 2033
- Table 71: Rest of Middle East & Africa Beryllium Copper Revenue (million) Forecast, by Application 2020 & 2033
- Table 72: Rest of Middle East & Africa Beryllium Copper Volume (K) Forecast, by Application 2020 & 2033
- Table 73: Global Beryllium Copper Revenue million Forecast, by Application 2020 & 2033
- Table 74: Global Beryllium Copper Volume K Forecast, by Application 2020 & 2033
- Table 75: Global Beryllium Copper Revenue million Forecast, by Type 2020 & 2033
- Table 76: Global Beryllium Copper Volume K Forecast, by Type 2020 & 2033
- Table 77: Global Beryllium Copper Revenue million Forecast, by Country 2020 & 2033
- Table 78: Global Beryllium Copper Volume K Forecast, by Country 2020 & 2033
- Table 79: China Beryllium Copper Revenue (million) Forecast, by Application 2020 & 2033
- Table 80: China Beryllium Copper Volume (K) Forecast, by Application 2020 & 2033
- Table 81: India Beryllium Copper Revenue (million) Forecast, by Application 2020 & 2033
- Table 82: India Beryllium Copper Volume (K) Forecast, by Application 2020 & 2033
- Table 83: Japan Beryllium Copper Revenue (million) Forecast, by Application 2020 & 2033
- Table 84: Japan Beryllium Copper Volume (K) Forecast, by Application 2020 & 2033
- Table 85: South Korea Beryllium Copper Revenue (million) Forecast, by Application 2020 & 2033
- Table 86: South Korea Beryllium Copper Volume (K) Forecast, by Application 2020 & 2033
- Table 87: ASEAN Beryllium Copper Revenue (million) Forecast, by Application 2020 & 2033
- Table 88: ASEAN Beryllium Copper Volume (K) Forecast, by Application 2020 & 2033
- Table 89: Oceania Beryllium Copper Revenue (million) Forecast, by Application 2020 & 2033
- Table 90: Oceania Beryllium Copper Volume (K) Forecast, by Application 2020 & 2033
- Table 91: Rest of Asia Pacific Beryllium Copper Revenue (million) Forecast, by Application 2020 & 2033
- Table 92: Rest of Asia Pacific Beryllium Copper Volume (K) Forecast, by Application 2020 & 2033
Frequently Asked Questions
1. What is the projected Compound Annual Growth Rate (CAGR) of the Beryllium Copper?
The projected CAGR is approximately 2.3%.
2. Which companies are prominent players in the Beryllium Copper?
Key companies in the market include Materion, NGK, Kazatomprom, Smiths Metal Centres, IBC Advanced Alloys, Belmont Metals, CNMC, XJNM, Jinfeng Metal, Zhuhai Dahua.
3. What are the main segments of the Beryllium Copper?
The market segments include Application, Type.
4. Can you provide details about the market size?
The market size is estimated to be USD 1480 million as of 2022.
5. What are some drivers contributing to market growth?
N/A
6. What are the notable trends driving market growth?
N/A
7. Are there any restraints impacting market growth?
N/A
8. Can you provide examples of recent developments in the market?
N/A
9. What pricing options are available for accessing the report?
Pricing options include single-user, multi-user, and enterprise licenses priced at USD 3950.00, USD 5925.00, and USD 7900.00 respectively.
10. Is the market size provided in terms of value or volume?
The market size is provided in terms of value, measured in million and volume, measured in K.
11. Are there any specific market keywords associated with the report?
Yes, the market keyword associated with the report is "Beryllium Copper," which aids in identifying and referencing the specific market segment covered.
12. How do I determine which pricing option suits my needs best?
The pricing options vary based on user requirements and access needs. Individual users may opt for single-user licenses, while businesses requiring broader access may choose multi-user or enterprise licenses for cost-effective access to the report.
13. Are there any additional resources or data provided in the Beryllium Copper report?
While the report offers comprehensive insights, it's advisable to review the specific contents or supplementary materials provided to ascertain if additional resources or data are available.
14. How can I stay updated on further developments or reports in the Beryllium Copper?
To stay informed about further developments, trends, and reports in the Beryllium Copper, consider subscribing to industry newsletters, following relevant companies and organizations, or regularly checking reputable industry news sources and publications.
Methodology
Step 1 - Identification of Relevant Samples Size from Population Database


Step 2 - Approaches for Defining Global Market Size (Value, Volume* & Price*)

Note*: In applicable scenarios
Step 3 - Data Sources
Primary Research
- Web Analytics
- Survey Reports
- Research Institute
- Latest Research Reports
- Opinion Leaders
Secondary Research
- Annual Reports
- White Paper
- Latest Press Release
- Industry Association
- Paid Database
- Investor Presentations

Step 4 - Data Triangulation
Involves using different sources of information in order to increase the validity of a study
These sources are likely to be stakeholders in a program - participants, other researchers, program staff, other community members, and so on.
Then we put all data in single framework & apply various statistical tools to find out the dynamic on the market.
During the analysis stage, feedback from the stakeholder groups would be compared to determine areas of agreement as well as areas of divergence

