

Key Insights
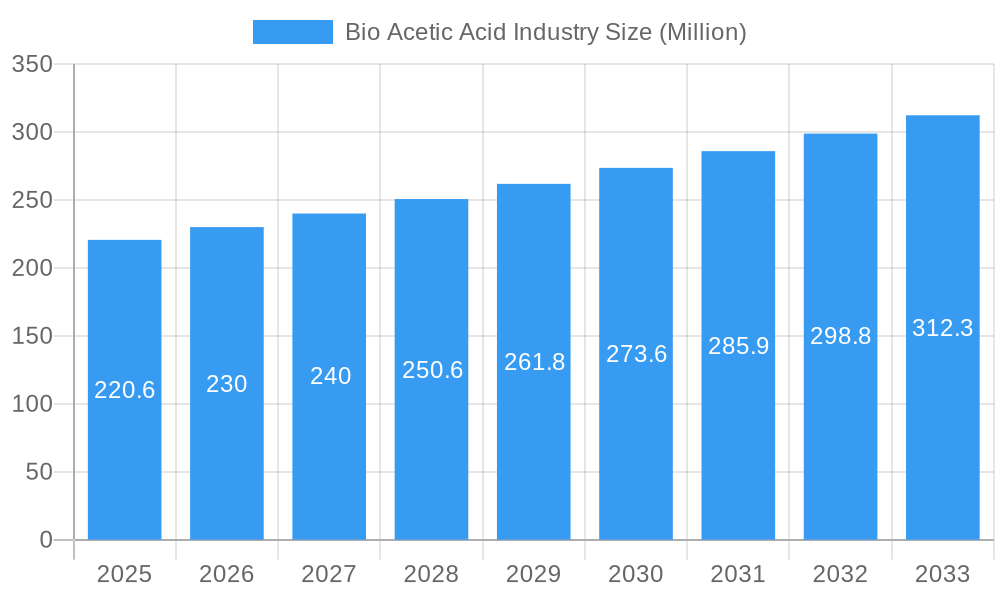
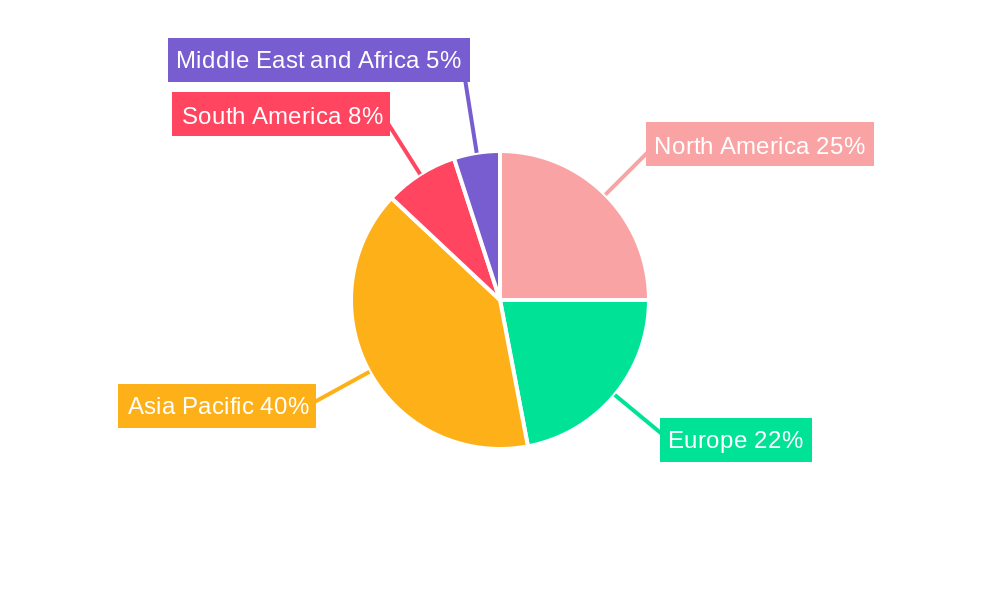
The bio-acetic acid market, valued at $220.6 million in 2025, is projected for robust growth, exhibiting a Compound Annual Growth Rate (CAGR) exceeding 4.00% from 2025 to 2033. This expansion is driven by the increasing demand for sustainable and bio-based chemicals across diverse applications. Key drivers include the growing awareness of environmental concerns surrounding petroleum-based acetic acid production, coupled with stringent government regulations promoting bio-based alternatives. The rising popularity of bioplastics and biofuels is further bolstering market demand. Significant advancements in bio-fermentation technologies, enabling more efficient and cost-effective production of bio-acetic acid, also contribute to the market's positive trajectory. Major applications like Vinyl Acetate Monomer (VAM), acetate esters, and Purified Terephthalic Acid (PTA) are major consumers of bio-acetic acid, fueling market expansion. The Asia-Pacific region, particularly China and India, is anticipated to witness substantial growth due to its burgeoning chemical industry and increasing adoption of sustainable practices.
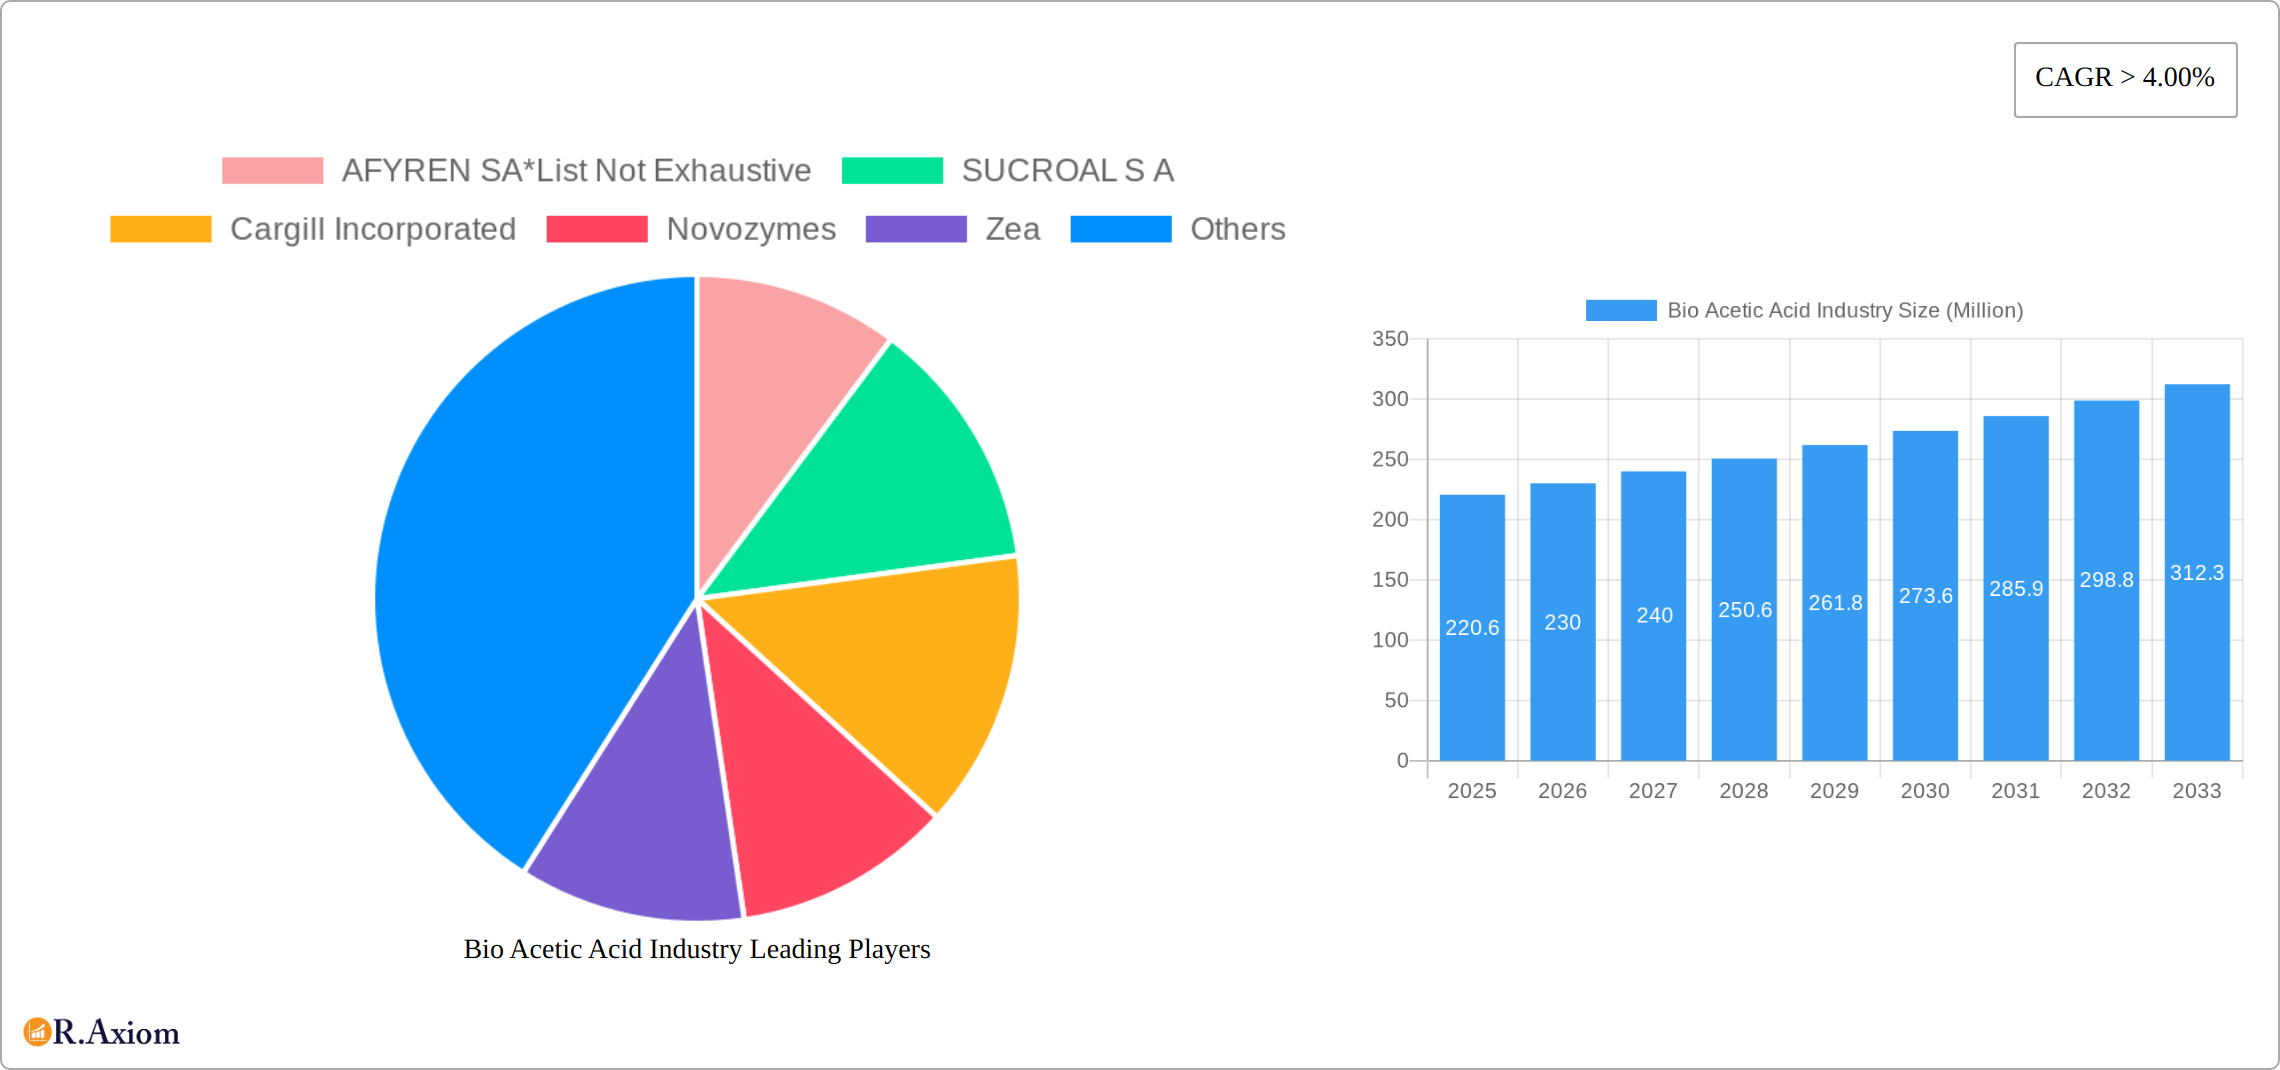
Bio Acetic Acid Industry Market Size (In Million)
Market segmentation reveals a diverse raw material base including biomass, corn, maize, and sugar, reflecting the versatility of bio-acetic acid production. While competition exists among established players like Cargill Incorporated, Novozymes, and BASF SE, along with emerging companies like AFYREN SA and LanzaTech, the market presents significant opportunities for innovation and expansion. Potential restraints include the relatively higher production costs compared to petrochemical-based acetic acid, and the fluctuating prices of raw materials. However, ongoing research and development efforts focusing on cost reduction and process optimization are mitigating these challenges. The long-term outlook remains positive, with continued growth projected through 2033, driven by sustained demand and technological advancements within the bio-based chemicals sector. The market's success hinges on further technological breakthroughs leading to greater cost competitiveness and wider adoption across various industries.
Bio Acetic Acid Industry Company Market Share
Bio Acetic Acid Industry: A Comprehensive Market Report (2019-2033)
This comprehensive report provides an in-depth analysis of the Bio Acetic Acid industry, covering market size, growth drivers, challenges, and future opportunities from 2019 to 2033. The study period encompasses the historical period (2019-2024), the base year (2025), and the forecast period (2025-2033), offering invaluable insights for stakeholders across the value chain. The report utilizes data-driven analysis, including CAGR projections and market penetration rates, to present a clear and actionable understanding of this dynamic sector. Key players like AFYREN SA, SUCRORAL S A, Cargill Incorporated, Novozymes, Zea, LanzaTech, GODAVARI BIOREFINERIES LTD, btgbioliquids, Airedale Chemical Company Limited, and BASF SE are analyzed, offering a detailed competitive landscape. The report is crucial for businesses, investors, and researchers looking to navigate the complexities of the bio acetic acid market and capitalize on emerging trends.
Bio Acetic Acid Industry Market Concentration & Innovation
This section analyzes the competitive landscape of the bio acetic acid industry, examining market concentration, innovation drivers, regulatory frameworks, and M&A activities. The global bio acetic acid market is moderately concentrated, with xx Million in market value held by the top five players in 2025. Market share data for individual companies is included in the full report. Key innovation drivers include advancements in fermentation technologies, the development of high-yield microbial strains, and the exploration of novel feedstocks. Regulatory frameworks, such as environmental regulations and biofuel mandates, significantly influence market dynamics. The report also details M&A activity, including deal values (xx Million in total M&A deal value estimated for 2025) and their impact on market structure. Substitute products, such as petrochemically derived acetic acid, and their competitive implications are also explored. End-user trends, focusing on increasing demand for bio-based materials in various applications, are examined. This section provides actionable insights into the competitive dynamics and innovative landscape within the bio acetic acid market.
- Market Share Analysis (Top 5 Players in 2025)
- M&A Deal Values (2019-2025)
- Analysis of Regulatory Frameworks
- Impact of Substitute Products
- End-User Trends and their Influence on Demand
Bio Acetic Acid Industry Trends & Insights
The bio acetic acid market is experiencing substantial growth, driven by increasing demand for sustainable alternatives to petrochemical-based products. The CAGR is estimated at xx% from 2025 to 2033, fueled by factors such as stringent environmental regulations, rising consumer awareness of sustainable products, and technological advancements. Technological disruptions in fermentation processes and genetic engineering are enhancing production efficiency and reducing costs. Consumer preferences are shifting towards bio-based products, further supporting market expansion. Competitive dynamics are shaped by technological innovation, cost efficiency, and the ability to secure sustainable feedstock sources. The report provides a detailed analysis of market growth drivers, technological advancements, and competitive dynamics, presenting an accurate picture of this rapidly evolving market.
Dominant Markets & Segments in Bio Acetic Acid Industry
The bio-acetic acid market is experiencing dynamic growth, driven by a confluence of factors including heightened consumer demand for sustainable products and supportive regulatory landscapes. This section delves into the key geographic regions and application segments that are shaping the industry's trajectory. While precise market share dominance can fluctuate based on specific raw materials and applications, a comprehensive analysis within the full report provides a detailed breakdown of regional and segmental performance.
Key Raw Material Sources:
- Biomass: The abundance of biomass resources, coupled with government incentives promoting their utilization and continuous improvements in pretreatment and conversion technologies, significantly fuels bio-acetic acid production. Specific biomass types and their regional availability are critical factors influencing production costs and market competitiveness.
- Corn/Maize/Sugar: While these traditional feedstocks benefit from established supply chains and infrastructure, their long-term sustainability is increasingly scrutinized. Concerns surrounding land use, water consumption, and potential conflicts with food production are prompting a shift towards alternative feedstock options.
- Waste Streams & Lignocellulosic Materials: The utilization of waste streams and lignocellulosic materials represents a significant opportunity for enhancing the sustainability and cost-effectiveness of bio-acetic acid production. This area is experiencing rapid innovation, with ongoing research focused on optimizing conversion processes and minimizing environmental impact.
Major Application Areas:
- Vinyl Acetate Monomer (VAM): Strong demand from the adhesives, coatings, and textiles industries remains a key driver for VAM production. However, competition from petrochemically-derived VAM necessitates ongoing innovation to improve cost-competitiveness and sustainability.
- Acetate Esters: Growth in the solvent and chemical intermediate markets directly influences the demand for acetate esters. Expansion within these downstream sectors is a critical factor in driving market growth for bio-acetic acid.
- Purified Terephthalic Acid (PTA): Bio-based PTA production presents substantial market potential, though scaling up production to meet industrial demands remains a significant challenge.
- Acetic Anhydride: The established dominance of petroleum-based acetic anhydride presents a considerable hurdle for bio-based alternatives. Overcoming this challenge requires breakthroughs in both production efficiency and cost reduction.
- Other Applications (Food, Pharma, Specialty Chemicals): A diverse range of niche applications, including food additives, pharmaceuticals, and specialty chemicals, contribute to the overall market demand for bio-acetic acid, offering opportunities for specialized producers.
This detailed market segmentation analysis highlights the key factors driving growth and the challenges that need to be addressed in each segment, providing a comprehensive understanding of the bio-acetic acid market landscape.
Bio Acetic Acid Industry Product Developments
Recent product innovations focus on enhancing fermentation efficiency, expanding the range of usable feedstocks, and developing higher-purity products. Technological trends include advancements in metabolic engineering, process optimization, and the use of advanced analytics. These innovations are improving the cost-competitiveness and sustainability of bio-acetic acid, enabling it to better compete with petrochemical-based alternatives, and creating new applications in diverse markets.
Report Scope & Segmentation Analysis
This report segments the bio acetic acid market based on raw material type (Biomass, Corn, Maize, Sugar, Other Raw Materials) and application (Vinyl Acetate Monomer (VAM), Acetate Esters, Purified Terephthalic Acid (PTA), Acetic Anhydride, Other Applications). Each segment's growth projections, market size, and competitive dynamics are individually assessed. The report provides a detailed market overview for the period 2019-2033, with projections up to 2033 based on 2025 estimations. The analysis offers a comprehensive understanding of the market structure and the trajectory of each segment.
Key Drivers of Bio Acetic Acid Industry Growth
Several factors drive the growth of the bio acetic acid industry. These include technological advancements that improve production efficiency and reduce costs; increasing government support and incentives for sustainable alternatives; growing consumer demand for eco-friendly products; and expansion into new applications across various industries. Furthermore, favorable regulatory policies and initiatives promoting bio-based materials are contributing to market expansion.
Challenges in the Bio Acetic Acid Industry Sector
The bio-acetic acid industry faces several key challenges that impact its growth trajectory. These include: the currently higher production costs compared to petrochemical alternatives; the necessity for enhanced scalability and production efficiency; ensuring a reliable and sustainable supply chain for feedstocks; overcoming the entrenched dominance of petroleum-based products; and navigating complex and often regionally-varying regulatory frameworks. Addressing these challenges strategically is crucial for sustainable market growth and wider adoption of bio-acetic acid.
Emerging Opportunities in Bio Acetic Acid Industry
Despite the challenges, the bio-acetic acid industry presents significant emerging opportunities for growth and innovation. These include the development of novel and more cost-effective feedstocks; expansion into high-growth sectors such as biodegradable plastics and biofuels; and the implementation of innovative fermentation technologies to enhance efficiency and reduce production costs. Furthermore, the increasing consumer preference for environmentally friendly and sustainable products is a potent force driving market expansion and creating favorable conditions for bio-acetic acid adoption.
Key Developments in Bio Acetic Acid Industry Industry
- July 2022: Novozymes launched Innova Apex and Innova Turbo, advanced yeast solutions enhancing ethanol production efficiency and tolerance to lactic and acetic acid. This improves the overall bio-process efficiency and reduces production costs.
- February 2022: The Indian government proposed reducing customs duty on critical chemicals including acetic acid. This policy change stimulates domestic production and reduces reliance on imports.
Strategic Outlook for Bio Acetic Acid Industry Market
The future of the bio-acetic acid market is promising. Favorable regulatory policies, rising consumer demand for sustainable solutions, and continuous technological improvements are converging to create a robust growth trajectory. The positive market outlook, supported by detailed projections within the full report, underscores the significant potential for future expansion and presents attractive opportunities for various stakeholders to participate in this rapidly developing sector. Strategic investments in research and development, sustainable feedstock sourcing, and efficient production processes will be key to unlocking the full potential of this promising industry.
Bio Acetic Acid Industry Segmentation
-
1. Raw Material
- 1.1. Biomass
- 1.2. Corn
- 1.3. Maize
- 1.4. Sugar
- 1.5. Other Raw Materials
-
2. Application
- 2.1. Vinyl Acetate Monomer (VAM)
- 2.2. Acetate Esters
- 2.3. Purified Terephthalic Acid (PTA)
- 2.4. Acetic Anhydride
- 2.5. Other Applications
Bio Acetic Acid Industry Segmentation By Geography
-
1. Asia Pacific
- 1.1. China
- 1.2. India
- 1.3. Japan
- 1.4. South Korea
- 1.5. Malaysia
- 1.6. Thailand
- 1.7. Indonesia
- 1.8. Vietnam
- 1.9. Rest of Asia Pacific
-
2. North America
- 2.1. United States
- 2.2. Canada
- 2.3. Mexico
-
3. Europe
- 3.1. Germany
- 3.2. United Kingdom
- 3.3. Italy
- 3.4. France
- 3.5. Spain
- 3.6. NORDIC Countries
- 3.7. Turkey
- 3.8. Russia
- 3.9. Rest of Europe
-
4. South America
- 4.1. Brazil
- 4.2. Argentina
- 4.3. Colombia
- 4.4. Rest of South America
-
5. Middle East and Africa
- 5.1. Qatar
- 5.2. United Arab Emirates
- 5.3. Nigeria
- 5.4. Egypt
- 5.5. South Africa
- 5.6. Rest of Middle East and Africa
-
6. Middle East and Africa
- 6.1. Saudi Arabia
- 6.2. South Africa
- 6.3. Rest of Middle East and Africa
Bio Acetic Acid Industry Regional Market Share
Geographic Coverage of Bio Acetic Acid Industry
Bio Acetic Acid Industry REPORT HIGHLIGHTS
| Aspects | Details |
|---|---|
| Study Period | 2020-2034 |
| Base Year | 2025 |
| Estimated Year | 2026 |
| Forecast Period | 2026-2034 |
| Historical Period | 2020-2025 |
| Growth Rate | CAGR of > 4.00% from 2020-2034 |
| Segmentation |
|
Table of Contents
- 1. Introduction
- 1.1. Research Scope
- 1.2. Market Segmentation
- 1.3. Research Objective
- 1.4. Definitions and Assumptions
- 2. Executive Summary
- 2.1. Market Snapshot
- 3. Market Dynamics
- 3.1. Market Drivers
- 3.2. Market Restrains
- 3.3. Market Trends
- 3.4. Market Opportunities
- 4. Market Factor Analysis
- 4.1. Porters Five Forces
- 4.1.1. Bargaining Power of Suppliers
- 4.1.2. Bargaining Power of Buyers
- 4.1.3. Threat of New Entrants
- 4.1.4. Threat of Substitutes
- 4.1.5. Competitive Rivalry
- 4.2. PESTEL analysis
- 4.3. BCG Analysis
- 4.3.1. Stars (High Growth, High Market Share)
- 4.3.2. Cash Cows (Low Growth, High Market Share)
- 4.3.3. Question Mark (High Growth, Low Market Share)
- 4.3.4. Dogs (Low Growth, Low Market Share)
- 4.4. Ansoff Matrix Analysis
- 4.5. Supply Chain Analysis
- 4.6. Regulatory Landscape
- 4.7. Current Market Potential and Opportunity Assessment (TAM–SAM–SOM Framework)
- 4.8. RAX Analyst Note
- 4.1. Porters Five Forces
- 5. Market Analysis, Insights and Forecast 2021-2033
- 5.1. Market Analysis, Insights and Forecast - by Raw Material
- 5.1.1. Biomass
- 5.1.2. Corn
- 5.1.3. Maize
- 5.1.4. Sugar
- 5.1.5. Other Raw Materials
- 5.2. Market Analysis, Insights and Forecast - by Application
- 5.2.1. Vinyl Acetate Monomer (VAM)
- 5.2.2. Acetate Esters
- 5.2.3. Purified Terephthalic Acid (PTA)
- 5.2.4. Acetic Anhydride
- 5.2.5. Other Applications
- 5.3. Market Analysis, Insights and Forecast - by Region
- 5.3.1. Asia Pacific
- 5.3.2. North America
- 5.3.3. Europe
- 5.3.4. South America
- 5.3.5. Middle East and Africa
- 5.3.6. Middle East and Africa
- 5.1. Market Analysis, Insights and Forecast - by Raw Material
- 6. Global Bio Acetic Acid Industry Analysis, Insights and Forecast, 2021-2033
- 6.1. Market Analysis, Insights and Forecast - by Raw Material
- 6.1.1. Biomass
- 6.1.2. Corn
- 6.1.3. Maize
- 6.1.4. Sugar
- 6.1.5. Other Raw Materials
- 6.2. Market Analysis, Insights and Forecast - by Application
- 6.2.1. Vinyl Acetate Monomer (VAM)
- 6.2.2. Acetate Esters
- 6.2.3. Purified Terephthalic Acid (PTA)
- 6.2.4. Acetic Anhydride
- 6.2.5. Other Applications
- 6.1. Market Analysis, Insights and Forecast - by Raw Material
- 7. Asia Pacific Bio Acetic Acid Industry Analysis, Insights and Forecast, 2020-2032
- 7.1. Market Analysis, Insights and Forecast - by Raw Material
- 7.1.1. Biomass
- 7.1.2. Corn
- 7.1.3. Maize
- 7.1.4. Sugar
- 7.1.5. Other Raw Materials
- 7.2. Market Analysis, Insights and Forecast - by Application
- 7.2.1. Vinyl Acetate Monomer (VAM)
- 7.2.2. Acetate Esters
- 7.2.3. Purified Terephthalic Acid (PTA)
- 7.2.4. Acetic Anhydride
- 7.2.5. Other Applications
- 7.1. Market Analysis, Insights and Forecast - by Raw Material
- 8. North America Bio Acetic Acid Industry Analysis, Insights and Forecast, 2020-2032
- 8.1. Market Analysis, Insights and Forecast - by Raw Material
- 8.1.1. Biomass
- 8.1.2. Corn
- 8.1.3. Maize
- 8.1.4. Sugar
- 8.1.5. Other Raw Materials
- 8.2. Market Analysis, Insights and Forecast - by Application
- 8.2.1. Vinyl Acetate Monomer (VAM)
- 8.2.2. Acetate Esters
- 8.2.3. Purified Terephthalic Acid (PTA)
- 8.2.4. Acetic Anhydride
- 8.2.5. Other Applications
- 8.1. Market Analysis, Insights and Forecast - by Raw Material
- 9. Europe Bio Acetic Acid Industry Analysis, Insights and Forecast, 2020-2032
- 9.1. Market Analysis, Insights and Forecast - by Raw Material
- 9.1.1. Biomass
- 9.1.2. Corn
- 9.1.3. Maize
- 9.1.4. Sugar
- 9.1.5. Other Raw Materials
- 9.2. Market Analysis, Insights and Forecast - by Application
- 9.2.1. Vinyl Acetate Monomer (VAM)
- 9.2.2. Acetate Esters
- 9.2.3. Purified Terephthalic Acid (PTA)
- 9.2.4. Acetic Anhydride
- 9.2.5. Other Applications
- 9.1. Market Analysis, Insights and Forecast - by Raw Material
- 10. South America Bio Acetic Acid Industry Analysis, Insights and Forecast, 2020-2032
- 10.1. Market Analysis, Insights and Forecast - by Raw Material
- 10.1.1. Biomass
- 10.1.2. Corn
- 10.1.3. Maize
- 10.1.4. Sugar
- 10.1.5. Other Raw Materials
- 10.2. Market Analysis, Insights and Forecast - by Application
- 10.2.1. Vinyl Acetate Monomer (VAM)
- 10.2.2. Acetate Esters
- 10.2.3. Purified Terephthalic Acid (PTA)
- 10.2.4. Acetic Anhydride
- 10.2.5. Other Applications
- 10.1. Market Analysis, Insights and Forecast - by Raw Material
- 11. Middle East and Africa Bio Acetic Acid Industry Analysis, Insights and Forecast, 2020-2032
- 11.1. Market Analysis, Insights and Forecast - by Raw Material
- 11.1.1. Biomass
- 11.1.2. Corn
- 11.1.3. Maize
- 11.1.4. Sugar
- 11.1.5. Other Raw Materials
- 11.2. Market Analysis, Insights and Forecast - by Application
- 11.2.1. Vinyl Acetate Monomer (VAM)
- 11.2.2. Acetate Esters
- 11.2.3. Purified Terephthalic Acid (PTA)
- 11.2.4. Acetic Anhydride
- 11.2.5. Other Applications
- 11.1. Market Analysis, Insights and Forecast - by Raw Material
- 12. Middle East and Africa Bio Acetic Acid Industry Analysis, Insights and Forecast, 2020-2032
- 12.1. Market Analysis, Insights and Forecast - by Raw Material
- 12.1.1. Biomass
- 12.1.2. Corn
- 12.1.3. Maize
- 12.1.4. Sugar
- 12.1.5. Other Raw Materials
- 12.2. Market Analysis, Insights and Forecast - by Application
- 12.2.1. Vinyl Acetate Monomer (VAM)
- 12.2.2. Acetate Esters
- 12.2.3. Purified Terephthalic Acid (PTA)
- 12.2.4. Acetic Anhydride
- 12.2.5. Other Applications
- 12.1. Market Analysis, Insights and Forecast - by Raw Material
- 13. Competitive Analysis
- 13.1. Company Profiles
- 13.1.1 AFYREN SA*List Not Exhaustive
- 13.1.1.1. Company Overview
- 13.1.1.2. Products
- 13.1.1.3. Company Financials
- 13.1.1.4. SWOT Analysis
- 13.1.2 SUCROAL S A
- 13.1.2.1. Company Overview
- 13.1.2.2. Products
- 13.1.2.3. Company Financials
- 13.1.2.4. SWOT Analysis
- 13.1.3 Cargill Incorporated
- 13.1.3.1. Company Overview
- 13.1.3.2. Products
- 13.1.3.3. Company Financials
- 13.1.3.4. SWOT Analysis
- 13.1.4 Novozymes
- 13.1.4.1. Company Overview
- 13.1.4.2. Products
- 13.1.4.3. Company Financials
- 13.1.4.4. SWOT Analysis
- 13.1.5 Zea
- 13.1.5.1. Company Overview
- 13.1.5.2. Products
- 13.1.5.3. Company Financials
- 13.1.5.4. SWOT Analysis
- 13.1.6 LanzaTech
- 13.1.6.1. Company Overview
- 13.1.6.2. Products
- 13.1.6.3. Company Financials
- 13.1.6.4. SWOT Analysis
- 13.1.7 GODAVARI BIOREFINERIES LTD
- 13.1.7.1. Company Overview
- 13.1.7.2. Products
- 13.1.7.3. Company Financials
- 13.1.7.4. SWOT Analysis
- 13.1.8 btgbioliquids
- 13.1.8.1. Company Overview
- 13.1.8.2. Products
- 13.1.8.3. Company Financials
- 13.1.8.4. SWOT Analysis
- 13.1.9 Airedale Chemical Company Limited
- 13.1.9.1. Company Overview
- 13.1.9.2. Products
- 13.1.9.3. Company Financials
- 13.1.9.4. SWOT Analysis
- 13.1.10 BASF SE
- 13.1.10.1. Company Overview
- 13.1.10.2. Products
- 13.1.10.3. Company Financials
- 13.1.10.4. SWOT Analysis
- 13.1.1 AFYREN SA*List Not Exhaustive
- 13.2. Market Entropy
- 13.2.1 Company's Key Areas Served
- 13.2.2 Recent Developments
- 13.3. Company Market Share Analysis 2025
- 13.3.1 Top 5 Companies Market Share Analysis
- 13.3.2 Top 3 Companies Market Share Analysis
- 13.4. List of Potential Customers
- 14. Research Methodology
List of Figures
- Figure 1: Global Bio Acetic Acid Industry Revenue Breakdown (Million, %) by Region 2025 & 2033
- Figure 2: Global Bio Acetic Acid Industry Volume Breakdown (K Tons, %) by Region 2025 & 2033
- Figure 3: Asia Pacific Bio Acetic Acid Industry Revenue (Million), by Raw Material 2025 & 2033
- Figure 4: Asia Pacific Bio Acetic Acid Industry Volume (K Tons), by Raw Material 2025 & 2033
- Figure 5: Asia Pacific Bio Acetic Acid Industry Revenue Share (%), by Raw Material 2025 & 2033
- Figure 6: Asia Pacific Bio Acetic Acid Industry Volume Share (%), by Raw Material 2025 & 2033
- Figure 7: Asia Pacific Bio Acetic Acid Industry Revenue (Million), by Application 2025 & 2033
- Figure 8: Asia Pacific Bio Acetic Acid Industry Volume (K Tons), by Application 2025 & 2033
- Figure 9: Asia Pacific Bio Acetic Acid Industry Revenue Share (%), by Application 2025 & 2033
- Figure 10: Asia Pacific Bio Acetic Acid Industry Volume Share (%), by Application 2025 & 2033
- Figure 11: Asia Pacific Bio Acetic Acid Industry Revenue (Million), by Country 2025 & 2033
- Figure 12: Asia Pacific Bio Acetic Acid Industry Volume (K Tons), by Country 2025 & 2033
- Figure 13: Asia Pacific Bio Acetic Acid Industry Revenue Share (%), by Country 2025 & 2033
- Figure 14: Asia Pacific Bio Acetic Acid Industry Volume Share (%), by Country 2025 & 2033
- Figure 15: North America Bio Acetic Acid Industry Revenue (Million), by Raw Material 2025 & 2033
- Figure 16: North America Bio Acetic Acid Industry Volume (K Tons), by Raw Material 2025 & 2033
- Figure 17: North America Bio Acetic Acid Industry Revenue Share (%), by Raw Material 2025 & 2033
- Figure 18: North America Bio Acetic Acid Industry Volume Share (%), by Raw Material 2025 & 2033
- Figure 19: North America Bio Acetic Acid Industry Revenue (Million), by Application 2025 & 2033
- Figure 20: North America Bio Acetic Acid Industry Volume (K Tons), by Application 2025 & 2033
- Figure 21: North America Bio Acetic Acid Industry Revenue Share (%), by Application 2025 & 2033
- Figure 22: North America Bio Acetic Acid Industry Volume Share (%), by Application 2025 & 2033
- Figure 23: North America Bio Acetic Acid Industry Revenue (Million), by Country 2025 & 2033
- Figure 24: North America Bio Acetic Acid Industry Volume (K Tons), by Country 2025 & 2033
- Figure 25: North America Bio Acetic Acid Industry Revenue Share (%), by Country 2025 & 2033
- Figure 26: North America Bio Acetic Acid Industry Volume Share (%), by Country 2025 & 2033
- Figure 27: Europe Bio Acetic Acid Industry Revenue (Million), by Raw Material 2025 & 2033
- Figure 28: Europe Bio Acetic Acid Industry Volume (K Tons), by Raw Material 2025 & 2033
- Figure 29: Europe Bio Acetic Acid Industry Revenue Share (%), by Raw Material 2025 & 2033
- Figure 30: Europe Bio Acetic Acid Industry Volume Share (%), by Raw Material 2025 & 2033
- Figure 31: Europe Bio Acetic Acid Industry Revenue (Million), by Application 2025 & 2033
- Figure 32: Europe Bio Acetic Acid Industry Volume (K Tons), by Application 2025 & 2033
- Figure 33: Europe Bio Acetic Acid Industry Revenue Share (%), by Application 2025 & 2033
- Figure 34: Europe Bio Acetic Acid Industry Volume Share (%), by Application 2025 & 2033
- Figure 35: Europe Bio Acetic Acid Industry Revenue (Million), by Country 2025 & 2033
- Figure 36: Europe Bio Acetic Acid Industry Volume (K Tons), by Country 2025 & 2033
- Figure 37: Europe Bio Acetic Acid Industry Revenue Share (%), by Country 2025 & 2033
- Figure 38: Europe Bio Acetic Acid Industry Volume Share (%), by Country 2025 & 2033
- Figure 39: South America Bio Acetic Acid Industry Revenue (Million), by Raw Material 2025 & 2033
- Figure 40: South America Bio Acetic Acid Industry Volume (K Tons), by Raw Material 2025 & 2033
- Figure 41: South America Bio Acetic Acid Industry Revenue Share (%), by Raw Material 2025 & 2033
- Figure 42: South America Bio Acetic Acid Industry Volume Share (%), by Raw Material 2025 & 2033
- Figure 43: South America Bio Acetic Acid Industry Revenue (Million), by Application 2025 & 2033
- Figure 44: South America Bio Acetic Acid Industry Volume (K Tons), by Application 2025 & 2033
- Figure 45: South America Bio Acetic Acid Industry Revenue Share (%), by Application 2025 & 2033
- Figure 46: South America Bio Acetic Acid Industry Volume Share (%), by Application 2025 & 2033
- Figure 47: South America Bio Acetic Acid Industry Revenue (Million), by Country 2025 & 2033
- Figure 48: South America Bio Acetic Acid Industry Volume (K Tons), by Country 2025 & 2033
- Figure 49: South America Bio Acetic Acid Industry Revenue Share (%), by Country 2025 & 2033
- Figure 50: South America Bio Acetic Acid Industry Volume Share (%), by Country 2025 & 2033
- Figure 51: Middle East and Africa Bio Acetic Acid Industry Revenue (Million), by Raw Material 2025 & 2033
- Figure 52: Middle East and Africa Bio Acetic Acid Industry Volume (K Tons), by Raw Material 2025 & 2033
- Figure 53: Middle East and Africa Bio Acetic Acid Industry Revenue Share (%), by Raw Material 2025 & 2033
- Figure 54: Middle East and Africa Bio Acetic Acid Industry Volume Share (%), by Raw Material 2025 & 2033
- Figure 55: Middle East and Africa Bio Acetic Acid Industry Revenue (Million), by Application 2025 & 2033
- Figure 56: Middle East and Africa Bio Acetic Acid Industry Volume (K Tons), by Application 2025 & 2033
- Figure 57: Middle East and Africa Bio Acetic Acid Industry Revenue Share (%), by Application 2025 & 2033
- Figure 58: Middle East and Africa Bio Acetic Acid Industry Volume Share (%), by Application 2025 & 2033
- Figure 59: Middle East and Africa Bio Acetic Acid Industry Revenue (Million), by Country 2025 & 2033
- Figure 60: Middle East and Africa Bio Acetic Acid Industry Volume (K Tons), by Country 2025 & 2033
- Figure 61: Middle East and Africa Bio Acetic Acid Industry Revenue Share (%), by Country 2025 & 2033
- Figure 62: Middle East and Africa Bio Acetic Acid Industry Volume Share (%), by Country 2025 & 2033
- Figure 63: Middle East and Africa Bio Acetic Acid Industry Revenue (Million), by Raw Material 2025 & 2033
- Figure 64: Middle East and Africa Bio Acetic Acid Industry Volume (K Tons), by Raw Material 2025 & 2033
- Figure 65: Middle East and Africa Bio Acetic Acid Industry Revenue Share (%), by Raw Material 2025 & 2033
- Figure 66: Middle East and Africa Bio Acetic Acid Industry Volume Share (%), by Raw Material 2025 & 2033
- Figure 67: Middle East and Africa Bio Acetic Acid Industry Revenue (Million), by Application 2025 & 2033
- Figure 68: Middle East and Africa Bio Acetic Acid Industry Volume (K Tons), by Application 2025 & 2033
- Figure 69: Middle East and Africa Bio Acetic Acid Industry Revenue Share (%), by Application 2025 & 2033
- Figure 70: Middle East and Africa Bio Acetic Acid Industry Volume Share (%), by Application 2025 & 2033
- Figure 71: Middle East and Africa Bio Acetic Acid Industry Revenue (Million), by Country 2025 & 2033
- Figure 72: Middle East and Africa Bio Acetic Acid Industry Volume (K Tons), by Country 2025 & 2033
- Figure 73: Middle East and Africa Bio Acetic Acid Industry Revenue Share (%), by Country 2025 & 2033
- Figure 74: Middle East and Africa Bio Acetic Acid Industry Volume Share (%), by Country 2025 & 2033
List of Tables
- Table 1: Global Bio Acetic Acid Industry Revenue Million Forecast, by Raw Material 2020 & 2033
- Table 2: Global Bio Acetic Acid Industry Volume K Tons Forecast, by Raw Material 2020 & 2033
- Table 3: Global Bio Acetic Acid Industry Revenue Million Forecast, by Application 2020 & 2033
- Table 4: Global Bio Acetic Acid Industry Volume K Tons Forecast, by Application 2020 & 2033
- Table 5: Global Bio Acetic Acid Industry Revenue Million Forecast, by Region 2020 & 2033
- Table 6: Global Bio Acetic Acid Industry Volume K Tons Forecast, by Region 2020 & 2033
- Table 7: Global Bio Acetic Acid Industry Revenue Million Forecast, by Raw Material 2020 & 2033
- Table 8: Global Bio Acetic Acid Industry Volume K Tons Forecast, by Raw Material 2020 & 2033
- Table 9: Global Bio Acetic Acid Industry Revenue Million Forecast, by Application 2020 & 2033
- Table 10: Global Bio Acetic Acid Industry Volume K Tons Forecast, by Application 2020 & 2033
- Table 11: Global Bio Acetic Acid Industry Revenue Million Forecast, by Country 2020 & 2033
- Table 12: Global Bio Acetic Acid Industry Volume K Tons Forecast, by Country 2020 & 2033
- Table 13: China Bio Acetic Acid Industry Revenue (Million) Forecast, by Application 2020 & 2033
- Table 14: China Bio Acetic Acid Industry Volume (K Tons) Forecast, by Application 2020 & 2033
- Table 15: India Bio Acetic Acid Industry Revenue (Million) Forecast, by Application 2020 & 2033
- Table 16: India Bio Acetic Acid Industry Volume (K Tons) Forecast, by Application 2020 & 2033
- Table 17: Japan Bio Acetic Acid Industry Revenue (Million) Forecast, by Application 2020 & 2033
- Table 18: Japan Bio Acetic Acid Industry Volume (K Tons) Forecast, by Application 2020 & 2033
- Table 19: South Korea Bio Acetic Acid Industry Revenue (Million) Forecast, by Application 2020 & 2033
- Table 20: South Korea Bio Acetic Acid Industry Volume (K Tons) Forecast, by Application 2020 & 2033
- Table 21: Malaysia Bio Acetic Acid Industry Revenue (Million) Forecast, by Application 2020 & 2033
- Table 22: Malaysia Bio Acetic Acid Industry Volume (K Tons) Forecast, by Application 2020 & 2033
- Table 23: Thailand Bio Acetic Acid Industry Revenue (Million) Forecast, by Application 2020 & 2033
- Table 24: Thailand Bio Acetic Acid Industry Volume (K Tons) Forecast, by Application 2020 & 2033
- Table 25: Indonesia Bio Acetic Acid Industry Revenue (Million) Forecast, by Application 2020 & 2033
- Table 26: Indonesia Bio Acetic Acid Industry Volume (K Tons) Forecast, by Application 2020 & 2033
- Table 27: Vietnam Bio Acetic Acid Industry Revenue (Million) Forecast, by Application 2020 & 2033
- Table 28: Vietnam Bio Acetic Acid Industry Volume (K Tons) Forecast, by Application 2020 & 2033
- Table 29: Rest of Asia Pacific Bio Acetic Acid Industry Revenue (Million) Forecast, by Application 2020 & 2033
- Table 30: Rest of Asia Pacific Bio Acetic Acid Industry Volume (K Tons) Forecast, by Application 2020 & 2033
- Table 31: Global Bio Acetic Acid Industry Revenue Million Forecast, by Raw Material 2020 & 2033
- Table 32: Global Bio Acetic Acid Industry Volume K Tons Forecast, by Raw Material 2020 & 2033
- Table 33: Global Bio Acetic Acid Industry Revenue Million Forecast, by Application 2020 & 2033
- Table 34: Global Bio Acetic Acid Industry Volume K Tons Forecast, by Application 2020 & 2033
- Table 35: Global Bio Acetic Acid Industry Revenue Million Forecast, by Country 2020 & 2033
- Table 36: Global Bio Acetic Acid Industry Volume K Tons Forecast, by Country 2020 & 2033
- Table 37: United States Bio Acetic Acid Industry Revenue (Million) Forecast, by Application 2020 & 2033
- Table 38: United States Bio Acetic Acid Industry Volume (K Tons) Forecast, by Application 2020 & 2033
- Table 39: Canada Bio Acetic Acid Industry Revenue (Million) Forecast, by Application 2020 & 2033
- Table 40: Canada Bio Acetic Acid Industry Volume (K Tons) Forecast, by Application 2020 & 2033
- Table 41: Mexico Bio Acetic Acid Industry Revenue (Million) Forecast, by Application 2020 & 2033
- Table 42: Mexico Bio Acetic Acid Industry Volume (K Tons) Forecast, by Application 2020 & 2033
- Table 43: Global Bio Acetic Acid Industry Revenue Million Forecast, by Raw Material 2020 & 2033
- Table 44: Global Bio Acetic Acid Industry Volume K Tons Forecast, by Raw Material 2020 & 2033
- Table 45: Global Bio Acetic Acid Industry Revenue Million Forecast, by Application 2020 & 2033
- Table 46: Global Bio Acetic Acid Industry Volume K Tons Forecast, by Application 2020 & 2033
- Table 47: Global Bio Acetic Acid Industry Revenue Million Forecast, by Country 2020 & 2033
- Table 48: Global Bio Acetic Acid Industry Volume K Tons Forecast, by Country 2020 & 2033
- Table 49: Germany Bio Acetic Acid Industry Revenue (Million) Forecast, by Application 2020 & 2033
- Table 50: Germany Bio Acetic Acid Industry Volume (K Tons) Forecast, by Application 2020 & 2033
- Table 51: United Kingdom Bio Acetic Acid Industry Revenue (Million) Forecast, by Application 2020 & 2033
- Table 52: United Kingdom Bio Acetic Acid Industry Volume (K Tons) Forecast, by Application 2020 & 2033
- Table 53: Italy Bio Acetic Acid Industry Revenue (Million) Forecast, by Application 2020 & 2033
- Table 54: Italy Bio Acetic Acid Industry Volume (K Tons) Forecast, by Application 2020 & 2033
- Table 55: France Bio Acetic Acid Industry Revenue (Million) Forecast, by Application 2020 & 2033
- Table 56: France Bio Acetic Acid Industry Volume (K Tons) Forecast, by Application 2020 & 2033
- Table 57: Spain Bio Acetic Acid Industry Revenue (Million) Forecast, by Application 2020 & 2033
- Table 58: Spain Bio Acetic Acid Industry Volume (K Tons) Forecast, by Application 2020 & 2033
- Table 59: NORDIC Countries Bio Acetic Acid Industry Revenue (Million) Forecast, by Application 2020 & 2033
- Table 60: NORDIC Countries Bio Acetic Acid Industry Volume (K Tons) Forecast, by Application 2020 & 2033
- Table 61: Turkey Bio Acetic Acid Industry Revenue (Million) Forecast, by Application 2020 & 2033
- Table 62: Turkey Bio Acetic Acid Industry Volume (K Tons) Forecast, by Application 2020 & 2033
- Table 63: Russia Bio Acetic Acid Industry Revenue (Million) Forecast, by Application 2020 & 2033
- Table 64: Russia Bio Acetic Acid Industry Volume (K Tons) Forecast, by Application 2020 & 2033
- Table 65: Rest of Europe Bio Acetic Acid Industry Revenue (Million) Forecast, by Application 2020 & 2033
- Table 66: Rest of Europe Bio Acetic Acid Industry Volume (K Tons) Forecast, by Application 2020 & 2033
- Table 67: Global Bio Acetic Acid Industry Revenue Million Forecast, by Raw Material 2020 & 2033
- Table 68: Global Bio Acetic Acid Industry Volume K Tons Forecast, by Raw Material 2020 & 2033
- Table 69: Global Bio Acetic Acid Industry Revenue Million Forecast, by Application 2020 & 2033
- Table 70: Global Bio Acetic Acid Industry Volume K Tons Forecast, by Application 2020 & 2033
- Table 71: Global Bio Acetic Acid Industry Revenue Million Forecast, by Country 2020 & 2033
- Table 72: Global Bio Acetic Acid Industry Volume K Tons Forecast, by Country 2020 & 2033
- Table 73: Brazil Bio Acetic Acid Industry Revenue (Million) Forecast, by Application 2020 & 2033
- Table 74: Brazil Bio Acetic Acid Industry Volume (K Tons) Forecast, by Application 2020 & 2033
- Table 75: Argentina Bio Acetic Acid Industry Revenue (Million) Forecast, by Application 2020 & 2033
- Table 76: Argentina Bio Acetic Acid Industry Volume (K Tons) Forecast, by Application 2020 & 2033
- Table 77: Colombia Bio Acetic Acid Industry Revenue (Million) Forecast, by Application 2020 & 2033
- Table 78: Colombia Bio Acetic Acid Industry Volume (K Tons) Forecast, by Application 2020 & 2033
- Table 79: Rest of South America Bio Acetic Acid Industry Revenue (Million) Forecast, by Application 2020 & 2033
- Table 80: Rest of South America Bio Acetic Acid Industry Volume (K Tons) Forecast, by Application 2020 & 2033
- Table 81: Global Bio Acetic Acid Industry Revenue Million Forecast, by Raw Material 2020 & 2033
- Table 82: Global Bio Acetic Acid Industry Volume K Tons Forecast, by Raw Material 2020 & 2033
- Table 83: Global Bio Acetic Acid Industry Revenue Million Forecast, by Application 2020 & 2033
- Table 84: Global Bio Acetic Acid Industry Volume K Tons Forecast, by Application 2020 & 2033
- Table 85: Global Bio Acetic Acid Industry Revenue Million Forecast, by Country 2020 & 2033
- Table 86: Global Bio Acetic Acid Industry Volume K Tons Forecast, by Country 2020 & 2033
- Table 87: Qatar Bio Acetic Acid Industry Revenue (Million) Forecast, by Application 2020 & 2033
- Table 88: Qatar Bio Acetic Acid Industry Volume (K Tons) Forecast, by Application 2020 & 2033
- Table 89: United Arab Emirates Bio Acetic Acid Industry Revenue (Million) Forecast, by Application 2020 & 2033
- Table 90: United Arab Emirates Bio Acetic Acid Industry Volume (K Tons) Forecast, by Application 2020 & 2033
- Table 91: Nigeria Bio Acetic Acid Industry Revenue (Million) Forecast, by Application 2020 & 2033
- Table 92: Nigeria Bio Acetic Acid Industry Volume (K Tons) Forecast, by Application 2020 & 2033
- Table 93: Egypt Bio Acetic Acid Industry Revenue (Million) Forecast, by Application 2020 & 2033
- Table 94: Egypt Bio Acetic Acid Industry Volume (K Tons) Forecast, by Application 2020 & 2033
- Table 95: South Africa Bio Acetic Acid Industry Revenue (Million) Forecast, by Application 2020 & 2033
- Table 96: South Africa Bio Acetic Acid Industry Volume (K Tons) Forecast, by Application 2020 & 2033
- Table 97: Rest of Middle East and Africa Bio Acetic Acid Industry Revenue (Million) Forecast, by Application 2020 & 2033
- Table 98: Rest of Middle East and Africa Bio Acetic Acid Industry Volume (K Tons) Forecast, by Application 2020 & 2033
- Table 99: Global Bio Acetic Acid Industry Revenue Million Forecast, by Raw Material 2020 & 2033
- Table 100: Global Bio Acetic Acid Industry Volume K Tons Forecast, by Raw Material 2020 & 2033
- Table 101: Global Bio Acetic Acid Industry Revenue Million Forecast, by Application 2020 & 2033
- Table 102: Global Bio Acetic Acid Industry Volume K Tons Forecast, by Application 2020 & 2033
- Table 103: Global Bio Acetic Acid Industry Revenue Million Forecast, by Country 2020 & 2033
- Table 104: Global Bio Acetic Acid Industry Volume K Tons Forecast, by Country 2020 & 2033
- Table 105: Saudi Arabia Bio Acetic Acid Industry Revenue (Million) Forecast, by Application 2020 & 2033
- Table 106: Saudi Arabia Bio Acetic Acid Industry Volume (K Tons) Forecast, by Application 2020 & 2033
- Table 107: South Africa Bio Acetic Acid Industry Revenue (Million) Forecast, by Application 2020 & 2033
- Table 108: South Africa Bio Acetic Acid Industry Volume (K Tons) Forecast, by Application 2020 & 2033
- Table 109: Rest of Middle East and Africa Bio Acetic Acid Industry Revenue (Million) Forecast, by Application 2020 & 2033
- Table 110: Rest of Middle East and Africa Bio Acetic Acid Industry Volume (K Tons) Forecast, by Application 2020 & 2033
Frequently Asked Questions
1. What is the projected Compound Annual Growth Rate (CAGR) of the Bio Acetic Acid Industry?
The projected CAGR is approximately > 4.00%.
2. Which companies are prominent players in the Bio Acetic Acid Industry?
Key companies in the market include AFYREN SA*List Not Exhaustive, SUCROAL S A, Cargill Incorporated, Novozymes, Zea, LanzaTech, GODAVARI BIOREFINERIES LTD, btgbioliquids, Airedale Chemical Company Limited, BASF SE.
3. What are the main segments of the Bio Acetic Acid Industry?
The market segments include Raw Material, Application.
4. Can you provide details about the market size?
The market size is estimated to be USD 220.6 Million as of 2022.
5. What are some drivers contributing to market growth?
Rising Crude Oil Prices; Increasing Demand for Vinyl Acetate Monomer (VAM).
6. What are the notable trends driving market growth?
Vinyl Acetate Monomer (VAM) Segment to Dominate the Market.
7. Are there any restraints impacting market growth?
Scarcity and Social Constraints for Raw Materials; Environmental Concerns Regarding the Harmful Effects.
8. Can you provide examples of recent developments in the market?
July 2022: Novozymes launched Innova Apex and Innova Turbo, advanced yeast solutions that can tolerate up to 0.6% lactic acid and 0.4% acetic acid and 0.8% lactic acid, and 0.4% acetic acid, respectively. The solutions are tailored to work in specific fermentation times, enabling ethanol producers to maximize their fermentation process to achieve their desired production targets.
9. What pricing options are available for accessing the report?
Pricing options include single-user, multi-user, and enterprise licenses priced at USD 4750, USD 5250, and USD 8750 respectively.
10. Is the market size provided in terms of value or volume?
The market size is provided in terms of value, measured in Million and volume, measured in K Tons.
11. Are there any specific market keywords associated with the report?
Yes, the market keyword associated with the report is "Bio Acetic Acid Industry," which aids in identifying and referencing the specific market segment covered.
12. How do I determine which pricing option suits my needs best?
The pricing options vary based on user requirements and access needs. Individual users may opt for single-user licenses, while businesses requiring broader access may choose multi-user or enterprise licenses for cost-effective access to the report.
13. Are there any additional resources or data provided in the Bio Acetic Acid Industry report?
While the report offers comprehensive insights, it's advisable to review the specific contents or supplementary materials provided to ascertain if additional resources or data are available.
14. How can I stay updated on further developments or reports in the Bio Acetic Acid Industry?
To stay informed about further developments, trends, and reports in the Bio Acetic Acid Industry, consider subscribing to industry newsletters, following relevant companies and organizations, or regularly checking reputable industry news sources and publications.
Methodology
Step 1 - Identification of Relevant Samples Size from Population Database


Step 2 - Approaches for Defining Global Market Size (Value, Volume* & Price*)

Note*: In applicable scenarios
Step 3 - Data Sources
Primary Research
- Web Analytics
- Survey Reports
- Research Institute
- Latest Research Reports
- Opinion Leaders
Secondary Research
- Annual Reports
- White Paper
- Latest Press Release
- Industry Association
- Paid Database
- Investor Presentations

Step 4 - Data Triangulation
Involves using different sources of information in order to increase the validity of a study
These sources are likely to be stakeholders in a program - participants, other researchers, program staff, other community members, and so on.
Then we put all data in single framework & apply various statistical tools to find out the dynamic on the market.
During the analysis stage, feedback from the stakeholder groups would be compared to determine areas of agreement as well as areas of divergence