
Key Insights
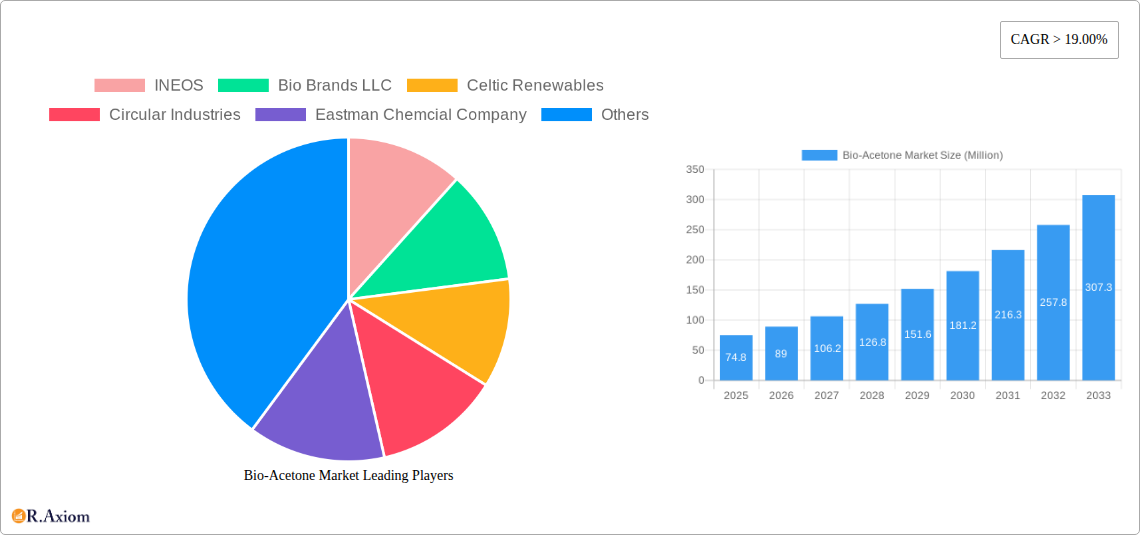
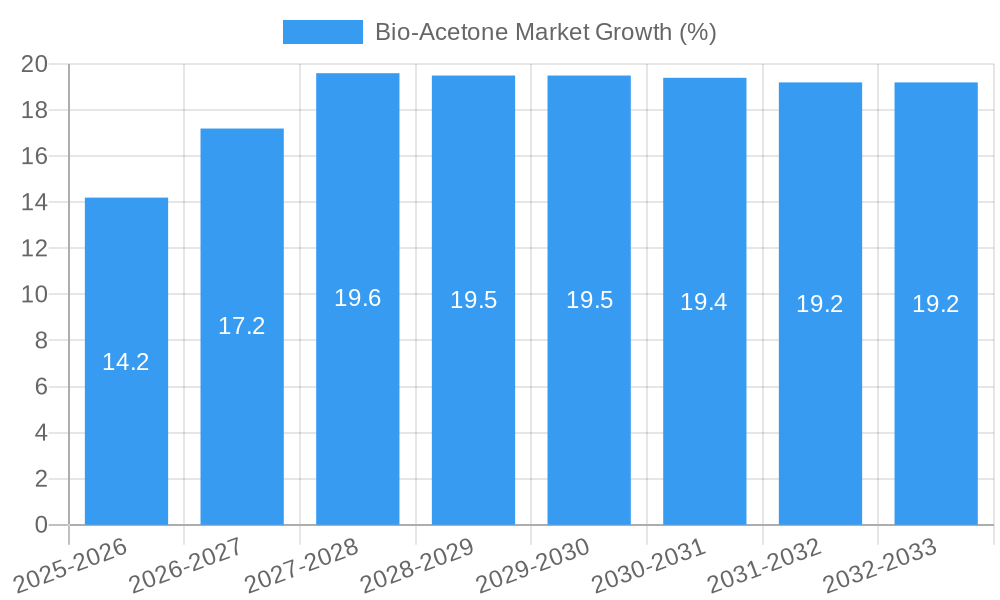
The bio-acetone market, valued at $74.80 million in 2025, is experiencing robust growth, projected to expand at a Compound Annual Growth Rate (CAGR) exceeding 19% from 2025 to 2033. This significant expansion is driven by the increasing demand for sustainable and bio-based chemicals across various industries. The rising consumer preference for eco-friendly products, coupled with stringent environmental regulations promoting the adoption of renewable alternatives to petroleum-based acetone, are key market drivers. Furthermore, advancements in bio-fermentation technologies and the development of more efficient and cost-effective production processes are contributing to the market's growth trajectory. Growth is also fueled by applications in the pharmaceutical, cosmetics, and food industries, where bio-acetone offers a cleaner and safer alternative. Companies like INEOS, Bio Brands LLC, and LanzaTech are leading the innovation and production within this sector, leveraging their expertise in biotechnology and chemical engineering. While challenges remain in terms of scaling up production and ensuring consistent product quality, ongoing research and development efforts are actively addressing these issues, paving the way for significant market expansion.
The competitive landscape is dynamic, characterized by both established chemical companies diversifying into bio-based solutions and emerging biotech firms specializing in bio-acetone production. The regional distribution of the market likely reflects established industrial clusters and consumer demand patterns, with North America and Europe potentially holding significant market shares. However, the growth potential in Asia-Pacific and other developing regions is considerable, driven by increasing industrialization and rising disposable incomes. Sustained investment in research and development, alongside favorable government policies promoting green chemistry, will be vital in further accelerating the market's growth and establishing bio-acetone as a mainstream, sustainable chemical. A strategic focus on optimizing production efficiency and reducing costs will be critical for companies seeking to thrive in this competitive landscape.
Bio-Acetone Market: A Comprehensive Report (2019-2033)
This in-depth report provides a comprehensive analysis of the Bio-Acetone Market from 2019 to 2033, offering actionable insights for industry stakeholders. The study covers market size, segmentation, growth drivers, challenges, key players, and future outlook. With a focus on innovation, sustainability, and emerging trends, this report is an essential resource for businesses operating in or planning to enter this dynamic market. The Base Year is 2025, the Estimated Year is 2025, and the Forecast Period is 2025-2033.
Bio-Acetone Market Market Concentration & Innovation
This section analyzes the competitive landscape of the bio-acetone market, encompassing market concentration, innovation drivers, regulatory frameworks, product substitutes, end-user trends, and mergers and acquisitions (M&A) activities. The report delves into the market share held by key players such as INEOS, Bio Brands LLC, Celtic Renewables, Circular Industries, Eastman Chemical Company, LanzaTech, LG Chem, Mitsui Chemicals, Sigma Aldrich (Merck KGaA), and Vertec BioSolvents Inc., among others. The analysis assesses the impact of technological advancements, such as improved fermentation processes and bio-based feedstock availability, on market innovation. Furthermore, the report examines the influence of regulatory frameworks promoting sustainable chemicals and the presence of alternative products on market dynamics. Finally, it evaluates the role of M&A activities, including deal values and their impact on market consolidation. The report estimates that the market concentration will remain moderately consolidated during the forecast period with a Herfindahl-Hirschman Index (HHI) of approximately xx. Significant M&A activities, with a total estimated value of $xx Million between 2019 and 2024, further shaped market dynamics.
Bio-Acetone Market Industry Trends & Insights
This section provides a comprehensive overview of the bio-acetone market's current trends and insights, analyzing market growth drivers, technological disruptions, consumer preferences, and competitive dynamics. The report explores the increasing demand for sustainable and bio-based chemicals, driven by growing environmental concerns and stricter regulations. Technological advancements, such as improved fermentation technologies and the development of cost-effective feedstocks, are also key drivers. The report projects a Compound Annual Growth Rate (CAGR) of xx% during the forecast period (2025-2033), with market penetration projected to reach xx% by 2033. The competitive dynamics are analyzed by examining the strategies employed by major players, including product differentiation, expansion into new markets, and strategic partnerships. The changing consumer preferences towards environmentally friendly products are also considered, including their impact on market demand.
Dominant Markets & Segments in Bio-Acetone Market
This section identifies the leading regions, countries, and segments within the bio-acetone market. The analysis focuses on understanding the key factors contributing to the dominance of specific markets. The report presents a detailed analysis of the dominant market(s), considering factors like favorable economic policies, robust infrastructure, and significant consumer demand. Key drivers of dominance are analyzed using bullet points:
- Favorable Government Policies: Incentives and regulations supporting sustainable chemistry.
- Developed Infrastructure: Efficient transportation and distribution networks.
- Strong Demand from Key End-Use Sectors: Significant consumption in specific industries (e.g., coatings, solvents).
- Presence of Key Players: Concentration of major manufacturers in specific regions.
The report will present a detailed analysis highlighting the leading region(s) or country(ies) and the specific segments showing exceptional growth. The reasons for this dominance will be deeply explored. For example, North America is expected to maintain a strong position due to the substantial presence of key players and supportive government policies.
Bio-Acetone Market Product Developments
This section summarizes recent product innovations, applications, and competitive advantages in the bio-acetone market. Significant advancements in fermentation technology have led to the development of high-purity bio-acetone with improved yield and efficiency. New applications are emerging in various sectors, including coatings, adhesives, and pharmaceuticals, driven by the increasing demand for sustainable alternatives. The competitive landscape is shaped by factors such as product quality, cost-effectiveness, and supply chain capabilities. Companies are focusing on optimizing their production processes to enhance cost-competitiveness and reduce environmental impact, gaining a significant competitive edge.
Report Scope & Segmentation Analysis
The report segments the bio-acetone market based on several factors, including product type, application, and geography. Each segment's market size, growth projections, and competitive dynamics are analyzed in detail. For example, the report will detail the segmentations by type (e.g., high-purity bio-acetone, industrial grade bio-acetone), applications (e.g., solvents, coatings, adhesives, pharmaceuticals), and regions (e.g., North America, Europe, Asia Pacific). Growth projections for each segment will be provided, along with the competitive landscape and analysis of key players within each segment. The overall market size, by value, is projected to reach $xx Million by 2033.
Key Drivers of Bio-Acetone Market Growth
The growth of the bio-acetone market is driven by several key factors. Firstly, the increasing demand for sustainable and renewable alternatives to traditional petroleum-based acetone is a major driver. Government regulations promoting the use of bio-based products, coupled with growing environmental concerns among consumers, further boost market growth. Technological advancements, such as improvements in fermentation processes and the development of cost-effective feedstocks, are also crucial factors driving market expansion. Furthermore, the increasing demand for bio-acetone in various applications, including solvents, coatings, and adhesives, contributes significantly to market growth.
Challenges in the Bio-Acetone Market Sector
The bio-acetone market faces several challenges, including the high production costs compared to petroleum-based acetone. The availability and cost of suitable feedstocks for bio-acetone production can also pose significant challenges. Furthermore, the lack of established infrastructure for the distribution and handling of bio-acetone might hinder market expansion. Stringent regulatory requirements and the competitive pressures from established petroleum-based acetone producers represent additional challenges. The estimated impact of these challenges on market growth is a reduction of xx% in the overall market size during the forecast period.
Emerging Opportunities in Bio-Acetone Market
The bio-acetone market presents several emerging opportunities. The expansion into new applications, such as in the pharmaceutical and personal care industries, presents significant potential for growth. The development of advanced fermentation technologies promises to improve production efficiency and reduce costs. Furthermore, the increasing adoption of circular economy principles and the integration of bio-refineries open new avenues for sustainable acetone production. Exploring new feedstock sources and expanding into new geographic markets also offer promising opportunities for market expansion.
Leading Players in the Bio-Acetone Market Market
- INEOS
- Bio Brands LLC
- Celtic Renewables
- Circular Industries
- Eastman Chemical Company
- LanzaTech
- LG Chem
- Mitsui Chemicals
- Sigma Aldrich (Merck KGaA)
- Vertec BioSolvents Inc.
- *List Not Exhaustive
Key Developments in Bio-Acetone Market Industry
July 2022: LG Chem started exporting bio-based acetone products and acquired the International Sustainability & Carbon Certification PLUS (ISCC PLUS) for its products. This significantly boosted market credibility and consumer confidence in bio-based alternatives.
February 2022: Covestro and Mitsui Chemicals agreed on the supply of raw acetone materials from ISCC Plus certified mass-balanced sources. This strategic partnership strengthened the supply chain for sustainable acetone and promoted the adoption of renewable resources.
Strategic Outlook for Bio-Acetone Market Market
The future of the bio-acetone market looks promising, driven by a confluence of factors. The increasing demand for sustainable chemicals, technological advancements, and supportive government policies will continue to fuel market growth. Expansion into new applications, coupled with strategic collaborations among industry players, will further drive market expansion. The market is poised for substantial growth, with significant opportunities for innovation and investment in the coming years. The continued development and adoption of sustainable practices will be crucial for the long-term success of the bio-acetone market.
Bio-Acetone Market Segmentation
-
1. Type
- 1.1. Purity <99%
- 1.2. Purity >99%
-
2. Application
- 2.1. Plastics
- 2.2. Rubber
- 2.3. Painting
- 2.4. Other Ap
Bio-Acetone Market Segmentation By Geography
-
1. Asia Pacific
- 1.1. China
- 1.2. India
- 1.3. Japan
- 1.4. South Korea
- 1.5. Malaysia
- 1.6. Thailand
- 1.7. Indonesia
- 1.8. Vietnam
- 1.9. Rest of Asia Pacific
-
2. North America
- 2.1. United States
- 2.2. Canada
- 2.3. Mexico
-
3. Europe
- 3.1. Germany
- 3.2. United Kingdom
- 3.3. France
- 3.4. Italy
- 3.5. Spain
- 3.6. Turkey
- 3.7. Russia
- 3.8. NORDIC Countries
- 3.9. Rest of Europe
-
4. South America
- 4.1. Brazil
- 4.2. Argentina
- 4.3. Colombia
- 4.4. Rest of South America
-
5. Middle East and Africa
- 5.1. Saudi Arabia
- 5.2. Nigeria
- 5.3. Qatar
- 5.4. Egypt
- 5.5. United Arab Emirates
- 5.6. South Africa
- 5.7. Rest of Middle East and Africa

Bio-Acetone Market REPORT HIGHLIGHTS
| Aspects | Details |
|---|---|
| Study Period | 2019-2033 |
| Base Year | 2024 |
| Estimated Year | 2025 |
| Forecast Period | 2025-2033 |
| Historical Period | 2019-2024 |
| Growth Rate | CAGR of > 19.00% from 2019-2033 |
| Segmentation |
|
Table of Contents
- 1. Introduction
- 1.1. Research Scope
- 1.2. Market Segmentation
- 1.3. Research Methodology
- 1.4. Definitions and Assumptions
- 2. Executive Summary
- 2.1. Introduction
- 3. Market Dynamics
- 3.1. Introduction
- 3.2. Market Drivers
- 3.2.1. Growing Demand for Bio Based Raw Materials in Various Industrial Applications; Increase in VOC Regulations; Other Drivers
- 3.3. Market Restrains
- 3.3.1. Growing Demand for Bio Based Raw Materials in Various Industrial Applications; Increase in VOC Regulations; Other Drivers
- 3.4. Market Trends
- 3.4.1. Growing Demand For Bio-Based Paints and Coatings
- 4. Market Factor Analysis
- 4.1. Porters Five Forces
- 4.2. Supply/Value Chain
- 4.3. PESTEL analysis
- 4.4. Market Entropy
- 4.5. Patent/Trademark Analysis
- 5. Global Bio-Acetone Market Analysis, Insights and Forecast, 2019-2031
- 5.1. Market Analysis, Insights and Forecast - by Type
- 5.1.1. Purity <99%
- 5.1.2. Purity >99%
- 5.2. Market Analysis, Insights and Forecast - by Application
- 5.2.1. Plastics
- 5.2.2. Rubber
- 5.2.3. Painting
- 5.2.4. Other Ap
- 5.3. Market Analysis, Insights and Forecast - by Region
- 5.3.1. Asia Pacific
- 5.3.2. North America
- 5.3.3. Europe
- 5.3.4. South America
- 5.3.5. Middle East and Africa
- 5.1. Market Analysis, Insights and Forecast - by Type
- 6. Asia Pacific Bio-Acetone Market Analysis, Insights and Forecast, 2019-2031
- 6.1. Market Analysis, Insights and Forecast - by Type
- 6.1.1. Purity <99%
- 6.1.2. Purity >99%
- 6.2. Market Analysis, Insights and Forecast - by Application
- 6.2.1. Plastics
- 6.2.2. Rubber
- 6.2.3. Painting
- 6.2.4. Other Ap
- 6.1. Market Analysis, Insights and Forecast - by Type
- 7. North America Bio-Acetone Market Analysis, Insights and Forecast, 2019-2031
- 7.1. Market Analysis, Insights and Forecast - by Type
- 7.1.1. Purity <99%
- 7.1.2. Purity >99%
- 7.2. Market Analysis, Insights and Forecast - by Application
- 7.2.1. Plastics
- 7.2.2. Rubber
- 7.2.3. Painting
- 7.2.4. Other Ap
- 7.1. Market Analysis, Insights and Forecast - by Type
- 8. Europe Bio-Acetone Market Analysis, Insights and Forecast, 2019-2031
- 8.1. Market Analysis, Insights and Forecast - by Type
- 8.1.1. Purity <99%
- 8.1.2. Purity >99%
- 8.2. Market Analysis, Insights and Forecast - by Application
- 8.2.1. Plastics
- 8.2.2. Rubber
- 8.2.3. Painting
- 8.2.4. Other Ap
- 8.1. Market Analysis, Insights and Forecast - by Type
- 9. South America Bio-Acetone Market Analysis, Insights and Forecast, 2019-2031
- 9.1. Market Analysis, Insights and Forecast - by Type
- 9.1.1. Purity <99%
- 9.1.2. Purity >99%
- 9.2. Market Analysis, Insights and Forecast - by Application
- 9.2.1. Plastics
- 9.2.2. Rubber
- 9.2.3. Painting
- 9.2.4. Other Ap
- 9.1. Market Analysis, Insights and Forecast - by Type
- 10. Middle East and Africa Bio-Acetone Market Analysis, Insights and Forecast, 2019-2031
- 10.1. Market Analysis, Insights and Forecast - by Type
- 10.1.1. Purity <99%
- 10.1.2. Purity >99%
- 10.2. Market Analysis, Insights and Forecast - by Application
- 10.2.1. Plastics
- 10.2.2. Rubber
- 10.2.3. Painting
- 10.2.4. Other Ap
- 10.1. Market Analysis, Insights and Forecast - by Type
- 11. Competitive Analysis
- 11.1. Global Market Share Analysis 2024
- 11.2. Company Profiles
- 11.2.1 INEOS
- 11.2.1.1. Overview
- 11.2.1.2. Products
- 11.2.1.3. SWOT Analysis
- 11.2.1.4. Recent Developments
- 11.2.1.5. Financials (Based on Availability)
- 11.2.2 Bio Brands LLC
- 11.2.2.1. Overview
- 11.2.2.2. Products
- 11.2.2.3. SWOT Analysis
- 11.2.2.4. Recent Developments
- 11.2.2.5. Financials (Based on Availability)
- 11.2.3 Celtic Renewables
- 11.2.3.1. Overview
- 11.2.3.2. Products
- 11.2.3.3. SWOT Analysis
- 11.2.3.4. Recent Developments
- 11.2.3.5. Financials (Based on Availability)
- 11.2.4 Circular Industries
- 11.2.4.1. Overview
- 11.2.4.2. Products
- 11.2.4.3. SWOT Analysis
- 11.2.4.4. Recent Developments
- 11.2.4.5. Financials (Based on Availability)
- 11.2.5 Eastman Chemcial Company
- 11.2.5.1. Overview
- 11.2.5.2. Products
- 11.2.5.3. SWOT Analysis
- 11.2.5.4. Recent Developments
- 11.2.5.5. Financials (Based on Availability)
- 11.2.6 LanzaTech
- 11.2.6.1. Overview
- 11.2.6.2. Products
- 11.2.6.3. SWOT Analysis
- 11.2.6.4. Recent Developments
- 11.2.6.5. Financials (Based on Availability)
- 11.2.7 LG Chem
- 11.2.7.1. Overview
- 11.2.7.2. Products
- 11.2.7.3. SWOT Analysis
- 11.2.7.4. Recent Developments
- 11.2.7.5. Financials (Based on Availability)
- 11.2.8 Mitsui Chemcials
- 11.2.8.1. Overview
- 11.2.8.2. Products
- 11.2.8.3. SWOT Analysis
- 11.2.8.4. Recent Developments
- 11.2.8.5. Financials (Based on Availability)
- 11.2.9 Sigma Aldrich (Merck KGaA)
- 11.2.9.1. Overview
- 11.2.9.2. Products
- 11.2.9.3. SWOT Analysis
- 11.2.9.4. Recent Developments
- 11.2.9.5. Financials (Based on Availability)
- 11.2.10 Vertec BioSolvents Inc *List Not Exhaustive
- 11.2.10.1. Overview
- 11.2.10.2. Products
- 11.2.10.3. SWOT Analysis
- 11.2.10.4. Recent Developments
- 11.2.10.5. Financials (Based on Availability)
- 11.2.1 INEOS
List of Figures
- Figure 1: Global Bio-Acetone Market Revenue Breakdown (Million, %) by Region 2024 & 2032
- Figure 2: Global Bio-Acetone Market Volume Breakdown (Million, %) by Region 2024 & 2032
- Figure 3: Asia Pacific Bio-Acetone Market Revenue (Million), by Type 2024 & 2032
- Figure 4: Asia Pacific Bio-Acetone Market Volume (Million), by Type 2024 & 2032
- Figure 5: Asia Pacific Bio-Acetone Market Revenue Share (%), by Type 2024 & 2032
- Figure 6: Asia Pacific Bio-Acetone Market Volume Share (%), by Type 2024 & 2032
- Figure 7: Asia Pacific Bio-Acetone Market Revenue (Million), by Application 2024 & 2032
- Figure 8: Asia Pacific Bio-Acetone Market Volume (Million), by Application 2024 & 2032
- Figure 9: Asia Pacific Bio-Acetone Market Revenue Share (%), by Application 2024 & 2032
- Figure 10: Asia Pacific Bio-Acetone Market Volume Share (%), by Application 2024 & 2032
- Figure 11: Asia Pacific Bio-Acetone Market Revenue (Million), by Country 2024 & 2032
- Figure 12: Asia Pacific Bio-Acetone Market Volume (Million), by Country 2024 & 2032
- Figure 13: Asia Pacific Bio-Acetone Market Revenue Share (%), by Country 2024 & 2032
- Figure 14: Asia Pacific Bio-Acetone Market Volume Share (%), by Country 2024 & 2032
- Figure 15: North America Bio-Acetone Market Revenue (Million), by Type 2024 & 2032
- Figure 16: North America Bio-Acetone Market Volume (Million), by Type 2024 & 2032
- Figure 17: North America Bio-Acetone Market Revenue Share (%), by Type 2024 & 2032
- Figure 18: North America Bio-Acetone Market Volume Share (%), by Type 2024 & 2032
- Figure 19: North America Bio-Acetone Market Revenue (Million), by Application 2024 & 2032
- Figure 20: North America Bio-Acetone Market Volume (Million), by Application 2024 & 2032
- Figure 21: North America Bio-Acetone Market Revenue Share (%), by Application 2024 & 2032
- Figure 22: North America Bio-Acetone Market Volume Share (%), by Application 2024 & 2032
- Figure 23: North America Bio-Acetone Market Revenue (Million), by Country 2024 & 2032
- Figure 24: North America Bio-Acetone Market Volume (Million), by Country 2024 & 2032
- Figure 25: North America Bio-Acetone Market Revenue Share (%), by Country 2024 & 2032
- Figure 26: North America Bio-Acetone Market Volume Share (%), by Country 2024 & 2032
- Figure 27: Europe Bio-Acetone Market Revenue (Million), by Type 2024 & 2032
- Figure 28: Europe Bio-Acetone Market Volume (Million), by Type 2024 & 2032
- Figure 29: Europe Bio-Acetone Market Revenue Share (%), by Type 2024 & 2032
- Figure 30: Europe Bio-Acetone Market Volume Share (%), by Type 2024 & 2032
- Figure 31: Europe Bio-Acetone Market Revenue (Million), by Application 2024 & 2032
- Figure 32: Europe Bio-Acetone Market Volume (Million), by Application 2024 & 2032
- Figure 33: Europe Bio-Acetone Market Revenue Share (%), by Application 2024 & 2032
- Figure 34: Europe Bio-Acetone Market Volume Share (%), by Application 2024 & 2032
- Figure 35: Europe Bio-Acetone Market Revenue (Million), by Country 2024 & 2032
- Figure 36: Europe Bio-Acetone Market Volume (Million), by Country 2024 & 2032
- Figure 37: Europe Bio-Acetone Market Revenue Share (%), by Country 2024 & 2032
- Figure 38: Europe Bio-Acetone Market Volume Share (%), by Country 2024 & 2032
- Figure 39: South America Bio-Acetone Market Revenue (Million), by Type 2024 & 2032
- Figure 40: South America Bio-Acetone Market Volume (Million), by Type 2024 & 2032
- Figure 41: South America Bio-Acetone Market Revenue Share (%), by Type 2024 & 2032
- Figure 42: South America Bio-Acetone Market Volume Share (%), by Type 2024 & 2032
- Figure 43: South America Bio-Acetone Market Revenue (Million), by Application 2024 & 2032
- Figure 44: South America Bio-Acetone Market Volume (Million), by Application 2024 & 2032
- Figure 45: South America Bio-Acetone Market Revenue Share (%), by Application 2024 & 2032
- Figure 46: South America Bio-Acetone Market Volume Share (%), by Application 2024 & 2032
- Figure 47: South America Bio-Acetone Market Revenue (Million), by Country 2024 & 2032
- Figure 48: South America Bio-Acetone Market Volume (Million), by Country 2024 & 2032
- Figure 49: South America Bio-Acetone Market Revenue Share (%), by Country 2024 & 2032
- Figure 50: South America Bio-Acetone Market Volume Share (%), by Country 2024 & 2032
- Figure 51: Middle East and Africa Bio-Acetone Market Revenue (Million), by Type 2024 & 2032
- Figure 52: Middle East and Africa Bio-Acetone Market Volume (Million), by Type 2024 & 2032
- Figure 53: Middle East and Africa Bio-Acetone Market Revenue Share (%), by Type 2024 & 2032
- Figure 54: Middle East and Africa Bio-Acetone Market Volume Share (%), by Type 2024 & 2032
- Figure 55: Middle East and Africa Bio-Acetone Market Revenue (Million), by Application 2024 & 2032
- Figure 56: Middle East and Africa Bio-Acetone Market Volume (Million), by Application 2024 & 2032
- Figure 57: Middle East and Africa Bio-Acetone Market Revenue Share (%), by Application 2024 & 2032
- Figure 58: Middle East and Africa Bio-Acetone Market Volume Share (%), by Application 2024 & 2032
- Figure 59: Middle East and Africa Bio-Acetone Market Revenue (Million), by Country 2024 & 2032
- Figure 60: Middle East and Africa Bio-Acetone Market Volume (Million), by Country 2024 & 2032
- Figure 61: Middle East and Africa Bio-Acetone Market Revenue Share (%), by Country 2024 & 2032
- Figure 62: Middle East and Africa Bio-Acetone Market Volume Share (%), by Country 2024 & 2032
List of Tables
- Table 1: Global Bio-Acetone Market Revenue Million Forecast, by Region 2019 & 2032
- Table 2: Global Bio-Acetone Market Volume Million Forecast, by Region 2019 & 2032
- Table 3: Global Bio-Acetone Market Revenue Million Forecast, by Type 2019 & 2032
- Table 4: Global Bio-Acetone Market Volume Million Forecast, by Type 2019 & 2032
- Table 5: Global Bio-Acetone Market Revenue Million Forecast, by Application 2019 & 2032
- Table 6: Global Bio-Acetone Market Volume Million Forecast, by Application 2019 & 2032
- Table 7: Global Bio-Acetone Market Revenue Million Forecast, by Region 2019 & 2032
- Table 8: Global Bio-Acetone Market Volume Million Forecast, by Region 2019 & 2032
- Table 9: Global Bio-Acetone Market Revenue Million Forecast, by Type 2019 & 2032
- Table 10: Global Bio-Acetone Market Volume Million Forecast, by Type 2019 & 2032
- Table 11: Global Bio-Acetone Market Revenue Million Forecast, by Application 2019 & 2032
- Table 12: Global Bio-Acetone Market Volume Million Forecast, by Application 2019 & 2032
- Table 13: Global Bio-Acetone Market Revenue Million Forecast, by Country 2019 & 2032
- Table 14: Global Bio-Acetone Market Volume Million Forecast, by Country 2019 & 2032
- Table 15: China Bio-Acetone Market Revenue (Million) Forecast, by Application 2019 & 2032
- Table 16: China Bio-Acetone Market Volume (Million) Forecast, by Application 2019 & 2032
- Table 17: India Bio-Acetone Market Revenue (Million) Forecast, by Application 2019 & 2032
- Table 18: India Bio-Acetone Market Volume (Million) Forecast, by Application 2019 & 2032
- Table 19: Japan Bio-Acetone Market Revenue (Million) Forecast, by Application 2019 & 2032
- Table 20: Japan Bio-Acetone Market Volume (Million) Forecast, by Application 2019 & 2032
- Table 21: South Korea Bio-Acetone Market Revenue (Million) Forecast, by Application 2019 & 2032
- Table 22: South Korea Bio-Acetone Market Volume (Million) Forecast, by Application 2019 & 2032
- Table 23: Malaysia Bio-Acetone Market Revenue (Million) Forecast, by Application 2019 & 2032
- Table 24: Malaysia Bio-Acetone Market Volume (Million) Forecast, by Application 2019 & 2032
- Table 25: Thailand Bio-Acetone Market Revenue (Million) Forecast, by Application 2019 & 2032
- Table 26: Thailand Bio-Acetone Market Volume (Million) Forecast, by Application 2019 & 2032
- Table 27: Indonesia Bio-Acetone Market Revenue (Million) Forecast, by Application 2019 & 2032
- Table 28: Indonesia Bio-Acetone Market Volume (Million) Forecast, by Application 2019 & 2032
- Table 29: Vietnam Bio-Acetone Market Revenue (Million) Forecast, by Application 2019 & 2032
- Table 30: Vietnam Bio-Acetone Market Volume (Million) Forecast, by Application 2019 & 2032
- Table 31: Rest of Asia Pacific Bio-Acetone Market Revenue (Million) Forecast, by Application 2019 & 2032
- Table 32: Rest of Asia Pacific Bio-Acetone Market Volume (Million) Forecast, by Application 2019 & 2032
- Table 33: Global Bio-Acetone Market Revenue Million Forecast, by Type 2019 & 2032
- Table 34: Global Bio-Acetone Market Volume Million Forecast, by Type 2019 & 2032
- Table 35: Global Bio-Acetone Market Revenue Million Forecast, by Application 2019 & 2032
- Table 36: Global Bio-Acetone Market Volume Million Forecast, by Application 2019 & 2032
- Table 37: Global Bio-Acetone Market Revenue Million Forecast, by Country 2019 & 2032
- Table 38: Global Bio-Acetone Market Volume Million Forecast, by Country 2019 & 2032
- Table 39: United States Bio-Acetone Market Revenue (Million) Forecast, by Application 2019 & 2032
- Table 40: United States Bio-Acetone Market Volume (Million) Forecast, by Application 2019 & 2032
- Table 41: Canada Bio-Acetone Market Revenue (Million) Forecast, by Application 2019 & 2032
- Table 42: Canada Bio-Acetone Market Volume (Million) Forecast, by Application 2019 & 2032
- Table 43: Mexico Bio-Acetone Market Revenue (Million) Forecast, by Application 2019 & 2032
- Table 44: Mexico Bio-Acetone Market Volume (Million) Forecast, by Application 2019 & 2032
- Table 45: Global Bio-Acetone Market Revenue Million Forecast, by Type 2019 & 2032
- Table 46: Global Bio-Acetone Market Volume Million Forecast, by Type 2019 & 2032
- Table 47: Global Bio-Acetone Market Revenue Million Forecast, by Application 2019 & 2032
- Table 48: Global Bio-Acetone Market Volume Million Forecast, by Application 2019 & 2032
- Table 49: Global Bio-Acetone Market Revenue Million Forecast, by Country 2019 & 2032
- Table 50: Global Bio-Acetone Market Volume Million Forecast, by Country 2019 & 2032
- Table 51: Germany Bio-Acetone Market Revenue (Million) Forecast, by Application 2019 & 2032
- Table 52: Germany Bio-Acetone Market Volume (Million) Forecast, by Application 2019 & 2032
- Table 53: United Kingdom Bio-Acetone Market Revenue (Million) Forecast, by Application 2019 & 2032
- Table 54: United Kingdom Bio-Acetone Market Volume (Million) Forecast, by Application 2019 & 2032
- Table 55: France Bio-Acetone Market Revenue (Million) Forecast, by Application 2019 & 2032
- Table 56: France Bio-Acetone Market Volume (Million) Forecast, by Application 2019 & 2032
- Table 57: Italy Bio-Acetone Market Revenue (Million) Forecast, by Application 2019 & 2032
- Table 58: Italy Bio-Acetone Market Volume (Million) Forecast, by Application 2019 & 2032
- Table 59: Spain Bio-Acetone Market Revenue (Million) Forecast, by Application 2019 & 2032
- Table 60: Spain Bio-Acetone Market Volume (Million) Forecast, by Application 2019 & 2032
- Table 61: Turkey Bio-Acetone Market Revenue (Million) Forecast, by Application 2019 & 2032
- Table 62: Turkey Bio-Acetone Market Volume (Million) Forecast, by Application 2019 & 2032
- Table 63: Russia Bio-Acetone Market Revenue (Million) Forecast, by Application 2019 & 2032
- Table 64: Russia Bio-Acetone Market Volume (Million) Forecast, by Application 2019 & 2032
- Table 65: NORDIC Countries Bio-Acetone Market Revenue (Million) Forecast, by Application 2019 & 2032
- Table 66: NORDIC Countries Bio-Acetone Market Volume (Million) Forecast, by Application 2019 & 2032
- Table 67: Rest of Europe Bio-Acetone Market Revenue (Million) Forecast, by Application 2019 & 2032
- Table 68: Rest of Europe Bio-Acetone Market Volume (Million) Forecast, by Application 2019 & 2032
- Table 69: Global Bio-Acetone Market Revenue Million Forecast, by Type 2019 & 2032
- Table 70: Global Bio-Acetone Market Volume Million Forecast, by Type 2019 & 2032
- Table 71: Global Bio-Acetone Market Revenue Million Forecast, by Application 2019 & 2032
- Table 72: Global Bio-Acetone Market Volume Million Forecast, by Application 2019 & 2032
- Table 73: Global Bio-Acetone Market Revenue Million Forecast, by Country 2019 & 2032
- Table 74: Global Bio-Acetone Market Volume Million Forecast, by Country 2019 & 2032
- Table 75: Brazil Bio-Acetone Market Revenue (Million) Forecast, by Application 2019 & 2032
- Table 76: Brazil Bio-Acetone Market Volume (Million) Forecast, by Application 2019 & 2032
- Table 77: Argentina Bio-Acetone Market Revenue (Million) Forecast, by Application 2019 & 2032
- Table 78: Argentina Bio-Acetone Market Volume (Million) Forecast, by Application 2019 & 2032
- Table 79: Colombia Bio-Acetone Market Revenue (Million) Forecast, by Application 2019 & 2032
- Table 80: Colombia Bio-Acetone Market Volume (Million) Forecast, by Application 2019 & 2032
- Table 81: Rest of South America Bio-Acetone Market Revenue (Million) Forecast, by Application 2019 & 2032
- Table 82: Rest of South America Bio-Acetone Market Volume (Million) Forecast, by Application 2019 & 2032
- Table 83: Global Bio-Acetone Market Revenue Million Forecast, by Type 2019 & 2032
- Table 84: Global Bio-Acetone Market Volume Million Forecast, by Type 2019 & 2032
- Table 85: Global Bio-Acetone Market Revenue Million Forecast, by Application 2019 & 2032
- Table 86: Global Bio-Acetone Market Volume Million Forecast, by Application 2019 & 2032
- Table 87: Global Bio-Acetone Market Revenue Million Forecast, by Country 2019 & 2032
- Table 88: Global Bio-Acetone Market Volume Million Forecast, by Country 2019 & 2032
- Table 89: Saudi Arabia Bio-Acetone Market Revenue (Million) Forecast, by Application 2019 & 2032
- Table 90: Saudi Arabia Bio-Acetone Market Volume (Million) Forecast, by Application 2019 & 2032
- Table 91: Nigeria Bio-Acetone Market Revenue (Million) Forecast, by Application 2019 & 2032
- Table 92: Nigeria Bio-Acetone Market Volume (Million) Forecast, by Application 2019 & 2032
- Table 93: Qatar Bio-Acetone Market Revenue (Million) Forecast, by Application 2019 & 2032
- Table 94: Qatar Bio-Acetone Market Volume (Million) Forecast, by Application 2019 & 2032
- Table 95: Egypt Bio-Acetone Market Revenue (Million) Forecast, by Application 2019 & 2032
- Table 96: Egypt Bio-Acetone Market Volume (Million) Forecast, by Application 2019 & 2032
- Table 97: United Arab Emirates Bio-Acetone Market Revenue (Million) Forecast, by Application 2019 & 2032
- Table 98: United Arab Emirates Bio-Acetone Market Volume (Million) Forecast, by Application 2019 & 2032
- Table 99: South Africa Bio-Acetone Market Revenue (Million) Forecast, by Application 2019 & 2032
- Table 100: South Africa Bio-Acetone Market Volume (Million) Forecast, by Application 2019 & 2032
- Table 101: Rest of Middle East and Africa Bio-Acetone Market Revenue (Million) Forecast, by Application 2019 & 2032
- Table 102: Rest of Middle East and Africa Bio-Acetone Market Volume (Million) Forecast, by Application 2019 & 2032
Frequently Asked Questions
1. What is the projected Compound Annual Growth Rate (CAGR) of the Bio-Acetone Market?
The projected CAGR is approximately > 19.00%.
2. Which companies are prominent players in the Bio-Acetone Market?
Key companies in the market include INEOS, Bio Brands LLC, Celtic Renewables, Circular Industries, Eastman Chemcial Company, LanzaTech, LG Chem, Mitsui Chemcials, Sigma Aldrich (Merck KGaA), Vertec BioSolvents Inc *List Not Exhaustive.
3. What are the main segments of the Bio-Acetone Market?
The market segments include Type, Application.
4. Can you provide details about the market size?
The market size is estimated to be USD 74.80 Million as of 2022.
5. What are some drivers contributing to market growth?
Growing Demand for Bio Based Raw Materials in Various Industrial Applications; Increase in VOC Regulations; Other Drivers.
6. What are the notable trends driving market growth?
Growing Demand For Bio-Based Paints and Coatings.
7. Are there any restraints impacting market growth?
Growing Demand for Bio Based Raw Materials in Various Industrial Applications; Increase in VOC Regulations; Other Drivers.
8. Can you provide examples of recent developments in the market?
July 2022: LG Chem started exporting bio-based acetone products and acquired the International Sustainability & Carbon Certification PLUS (ISCC PLUS) for its products.
9. What pricing options are available for accessing the report?
Pricing options include single-user, multi-user, and enterprise licenses priced at USD 4750, USD 5250, and USD 8750 respectively.
10. Is the market size provided in terms of value or volume?
The market size is provided in terms of value, measured in Million and volume, measured in Million.
11. Are there any specific market keywords associated with the report?
Yes, the market keyword associated with the report is "Bio-Acetone Market," which aids in identifying and referencing the specific market segment covered.
12. How do I determine which pricing option suits my needs best?
The pricing options vary based on user requirements and access needs. Individual users may opt for single-user licenses, while businesses requiring broader access may choose multi-user or enterprise licenses for cost-effective access to the report.
13. Are there any additional resources or data provided in the Bio-Acetone Market report?
While the report offers comprehensive insights, it's advisable to review the specific contents or supplementary materials provided to ascertain if additional resources or data are available.
14. How can I stay updated on further developments or reports in the Bio-Acetone Market?
To stay informed about further developments, trends, and reports in the Bio-Acetone Market, consider subscribing to industry newsletters, following relevant companies and organizations, or regularly checking reputable industry news sources and publications.
Methodology
Step 1 - Identification of Relevant Samples Size from Population Database


Step 2 - Approaches for Defining Global Market Size (Value, Volume* & Price*)

Note*: In applicable scenarios
Step 3 - Data Sources
Primary Research
- Web Analytics
- Survey Reports
- Research Institute
- Latest Research Reports
- Opinion Leaders
Secondary Research
- Annual Reports
- White Paper
- Latest Press Release
- Industry Association
- Paid Database
- Investor Presentations

Step 4 - Data Triangulation
Involves using different sources of information in order to increase the validity of a study
These sources are likely to be stakeholders in a program - participants, other researchers, program staff, other community members, and so on.
Then we put all data in single framework & apply various statistical tools to find out the dynamic on the market.
During the analysis stage, feedback from the stakeholder groups would be compared to determine areas of agreement as well as areas of divergence


