Key Insights
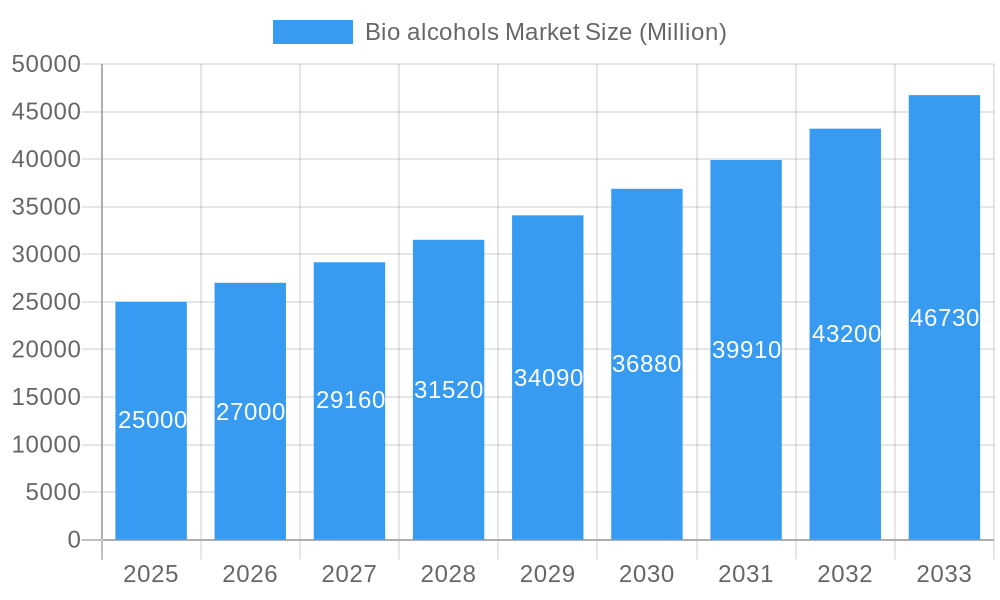
The bio-alcohols market, encompassing bio-methanol, bio-ethanol, bio-butanol, bio-BDO, and other types, is experiencing robust growth, projected to maintain a CAGR exceeding 8% from 2025 to 2033. This expansion is driven by several key factors. Increasing environmental concerns and stringent regulations regarding greenhouse gas emissions are pushing the adoption of bio-alcohols as sustainable alternatives to fossil fuels in transportation. Furthermore, the rising demand for bio-based materials in construction, electronics, and pharmaceuticals is fueling market growth across diverse applications. Technological advancements in bio-alcohol production, leading to increased efficiency and reduced costs, are also contributing to market expansion. The Asia-Pacific region, particularly China and India, is expected to dominate the market due to their large and rapidly growing economies, coupled with supportive government policies promoting renewable energy sources. However, challenges remain, including the volatility of raw material prices (agricultural feedstocks), the need for further advancements in bio-alcohol production technology to achieve greater scalability and cost-competitiveness, and potential competition from other sustainable alternatives.
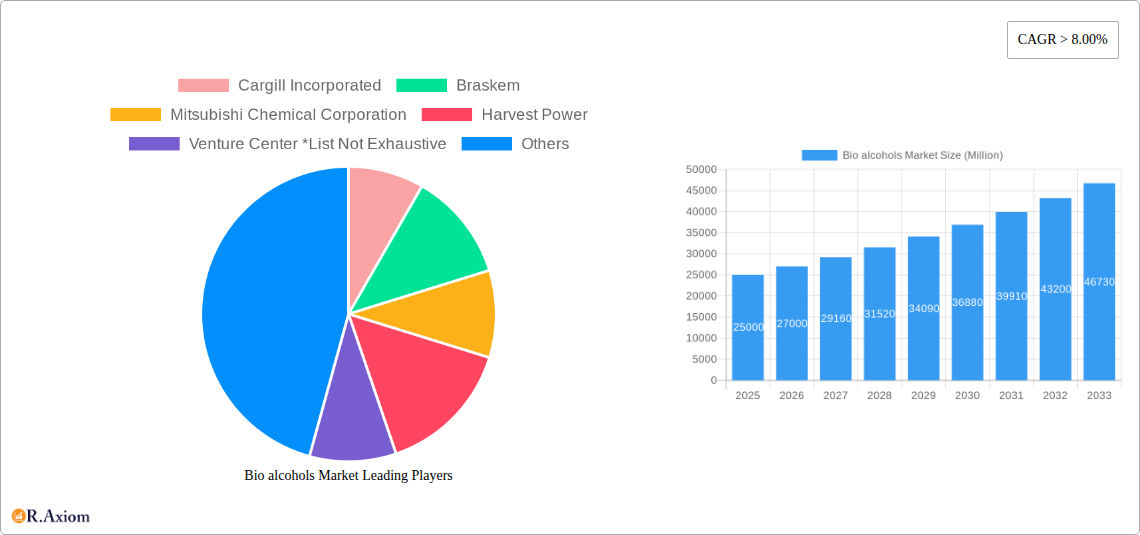
Bio alcohols Market Market Size (In Billion)
The market segmentation reveals significant opportunities within specific product types and applications. Bio-ethanol currently holds the largest market share, primarily due to its established use in the transportation sector. However, bio-butanol and bio-BDO are anticipated to experience faster growth rates due to their unique properties and expanding applications in specialized industries. North America and Europe are currently leading markets, driven by strong environmental regulations and government incentives. However, the rapid industrialization and economic growth in emerging markets like Asia-Pacific and South America present significant growth potential, attracting investments in bio-alcohol production facilities and fueling future market expansion. Major players like Cargill, Braskem, and BASF are actively investing in research and development, capacity expansion, and strategic partnerships to capitalize on this burgeoning market.
Bio alcohols Market Company Market Share
Bio Alcohols Market: A Comprehensive Report (2019-2033)
This in-depth report provides a comprehensive analysis of the global bio alcohols market, offering invaluable insights for stakeholders seeking to understand market trends, competitive dynamics, and future growth opportunities. The report covers the period from 2019 to 2033, with a focus on the forecast period of 2025-2033 and a base year of 2025. The study meticulously examines various segments, including product types (bio-methanol, bio-ethanol, bio-butanol, bio-BDO, and other product types) and applications (transportation, construction, electronics, pharmaceutical, and other applications). Key players such as Cargill Incorporated, Braskem, Mitsubishi Chemical Corporation, BASF SE, and DSM are analyzed, providing a granular understanding of the market landscape. The report is designed to provide actionable insights and support informed decision-making.
Bio alcohols Market Market Concentration & Innovation
The bio alcohols market exhibits a moderately concentrated structure, with a few major players holding significant market share. Cargill Incorporated, Braskem, and Mitsubishi Chemical Corporation collectively account for approximately xx% of the global market in 2025. However, the market is characterized by ongoing innovation, driven by factors such as the increasing demand for sustainable alternatives to fossil fuels and advancements in bio-based technologies. Regulatory frameworks, particularly those promoting renewable energy and biofuel adoption, significantly influence market growth. The emergence of advanced bio-refineries and the development of next-generation bio-alcohols contribute to market expansion. Product substitutes, primarily conventional petroleum-based fuels, pose a competitive challenge, although their environmental impact is driving a shift toward bio alcohols. End-user trends, including growing environmental awareness and stricter emission regulations, are pivotal in shaping market demand. Furthermore, strategic mergers and acquisitions (M&A) activities are playing a crucial role in reshaping the market landscape. In 2024, M&A deals in the bio alcohols sector totalled approximately $xx Million, primarily driven by consolidation efforts and the acquisition of innovative technologies. The average deal size was approximately $xx Million.
Bio alcohols Market Industry Trends & Insights
The bio alcohols market is experiencing robust growth, driven by several factors. The global market is projected to reach $xx Million by 2033, exhibiting a CAGR of xx% during the forecast period (2025-2033). This growth is fuelled by the increasing demand for sustainable transportation fuels, driven by stringent government regulations aimed at reducing greenhouse gas emissions. Technological disruptions, such as advancements in fermentation technology and enzymatic processes, are continuously improving the efficiency and cost-effectiveness of bio alcohol production. Consumer preferences are increasingly shifting towards environmentally friendly products, leading to higher demand for bio alcohols in various applications. The competitive landscape is dynamic, with existing players focusing on expansion, innovation, and strategic alliances to maintain their market share. Market penetration of bio alcohols in the transportation sector is expected to reach xx% by 2033, driven by increasing biofuel mandates and the development of compatible vehicles.
Dominant Markets & Segments in Bio alcohols Market
The bio-ethanol segment dominates the product type landscape, accounting for approximately xx% of the total market in 2025. This is primarily due to established production technologies and its widespread use in the transportation sector. Geographically, North America and Europe are currently the leading regions in the bio alcohols market, driven by supportive government policies and strong environmental awareness.
Key Drivers in North America:
- Stringent emission regulations.
- Government incentives for renewable fuels.
- Established biofuel infrastructure.
Key Drivers in Europe:
- High demand for sustainable transportation fuels.
- EU renewable energy targets.
- Investment in bio-refinery technologies.
The transportation application segment holds the largest market share, driven by the growing adoption of biofuels as a sustainable alternative to fossil fuels. However, the construction, electronics, and pharmaceutical sectors are also witnessing increasing use of bio alcohols due to their versatility and environmentally friendly nature.
Bio alcohols Market Product Developments
Recent years have witnessed significant advancements in bio alcohol production technologies, leading to the development of more efficient and cost-effective processes. Novel enzymatic catalysts and improved fermentation strategies have enhanced bio alcohol yields and reduced production costs. These developments are expanding the applications of bio alcohols beyond traditional sectors. For instance, there is increased interest in exploring bio alcohols as sustainable solvents in the pharmaceutical industry and as raw materials in the electronics sector.
Report Scope & Segmentation Analysis
This report comprehensively segments the bio alcohols market based on product type and application.
Product Type:
- Bio-methanol: This segment is projected to grow at a CAGR of xx% during the forecast period, driven by its increasing use as a chemical feedstock and fuel additive.
- Bio-ethanol: The largest segment, with a market size of $xx Million in 2025, it will continue to benefit from supportive government policies and the growth of the transportation sector.
- Bio-butanol: This segment is expected to show strong growth due to its superior properties compared to ethanol, making it a promising alternative fuel.
- Bio-BDO: Growing applications in various industries drive growth in this market segment.
- Other Product Types: This category includes other emerging bio alcohols and is expected to show considerable growth potential.
Application:
- Transportation: The leading application segment, driven by strong governmental support for biofuels.
- Construction: Growing demand for sustainable construction materials boosts this segment.
- Electronics: The use of bio alcohols as solvents and precursors in the electronics industry creates growth opportunities.
- Pharmaceutical: Demand for bio alcohols in the pharmaceutical sector is increasing due to its properties and growing environmental concerns.
- Other Applications: This category includes emerging applications of bio alcohols in various industries and holds significant growth potential.
Key Drivers of Bio alcohols Market Growth
Several factors are driving the growth of the bio alcohols market, including increasing government mandates to reduce carbon emissions, rising consumer preference for eco-friendly alternatives, technological advancements in bio-based technologies leading to greater efficiency and cost-effectiveness, and the growing use of bio alcohols as feedstock for various industrial applications. The development of advanced biorefineries capable of processing diverse biomass sources is also contributing to market expansion.
Challenges in the Bio alcohols Market Sector
The bio alcohols market faces challenges such as the volatility of raw material prices (agricultural commodities), competition from conventional fuels, and the need for further technological advancements to reduce production costs and improve efficiency. Furthermore, establishing robust supply chains and addressing environmental concerns related to bio alcohol production are crucial for sustainable market growth. The scalability of production for bio-butanol and other advanced bio-alcohols also represents a challenge.
Emerging Opportunities in Bio alcohols Market
Emerging opportunities exist in the development of advanced bio-refinery technologies, the utilization of diverse and non-food biomass sources, and the exploration of new bio alcohol applications in sectors like chemicals and cosmetics. The growing interest in carbon-neutral transportation fuels creates substantial market opportunities. Research into advanced bio alcohol blending techniques is set to expand market potential further.
Leading Players in the Bio alcohols Market Market
- Cargill Incorporated
- Braskem
- Mitsubishi Chemical Corporation
- Harvest Power
- Venture Center
- BASF SE
- DSM
- Valero Marketing and Supply Company
- Mascoma LLC
- Fulcrum BioEnergy
Key Developments in Bio alcohols Market Industry
- January 2023: Cargill Incorporated announces investment in a new bio-ethanol facility, increasing production capacity.
- March 2022: Braskem partners with a technology provider to develop a next-generation bio-ethanol production process.
- June 2021: Mitsubishi Chemical Corporation launches a new bio-butanol product for the pharmaceutical industry.
- Further Developments (xx): [Add further specific developments with dates as they become available]
Strategic Outlook for Bio alcohols Market Market
The bio alcohols market holds immense growth potential, driven by the increasing global focus on sustainability, renewable energy, and the reduction of greenhouse gas emissions. Continued technological advancements, supportive government policies, and the growing awareness of environmental issues will further propel market expansion. The development of new bio alcohol applications and diversification of feedstock sources will be key factors in driving future growth.
Bio alcohols Market Segmentation
-
1. Product Type
- 1.1. Bio-methanol
- 1.2. Bio-ethanol
- 1.3. Bio-butanol
- 1.4. Bio-BDO
- 1.5. Other Product Types
-
2. Application
- 2.1. Transportation
- 2.2. Construction
- 2.3. Electronics
- 2.4. Pharmaceutical
- 2.5. Other Applications
Bio alcohols Market Segmentation By Geography
-
1. Asia Pacific
- 1.1. China
- 1.2. India
- 1.3. Japan
- 1.4. South Korea
- 1.5. ASEAN Countries
- 1.6. Rest of Asia Pacific
-
2. North America
- 2.1. United States
- 2.2. Canada
- 2.3. Mexico
-
3. Europe
- 3.1. Germany
- 3.2. United Kingdom
- 3.3. Italy
- 3.4. France
- 3.5. Rest of Europe
-
4. South America
- 4.1. Brazil
- 4.2. Argentina
- 4.3. Rest of South America
-
5. Middle East and Africa
- 5.1. Saudi Arabia
- 5.2. South Africa
- 5.3. Rest of Middle East and Africa
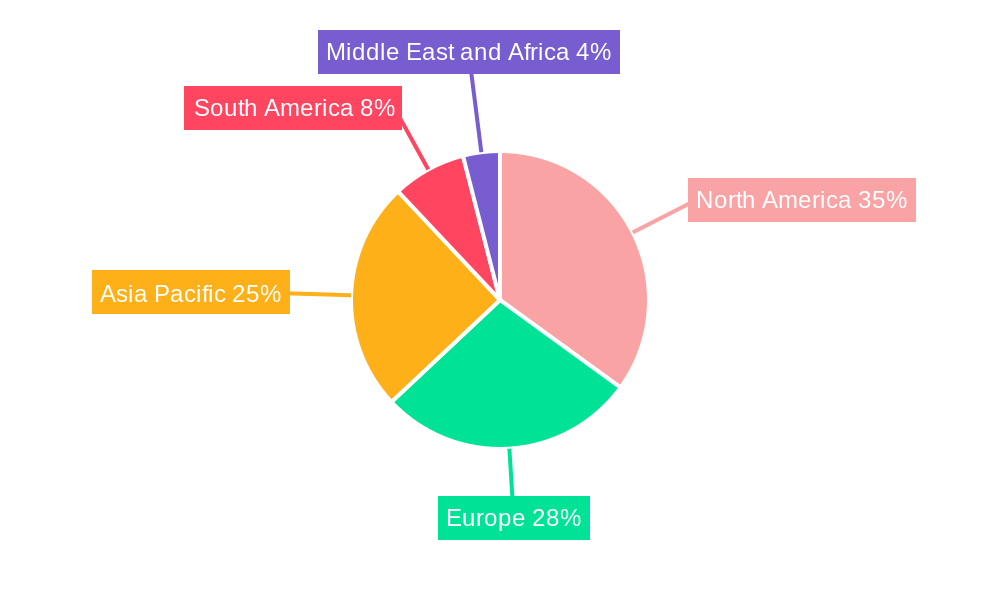
Bio alcohols Market Regional Market Share
Geographic Coverage of Bio alcohols Market
Bio alcohols Market REPORT HIGHLIGHTS
| Aspects | Details |
|---|---|
| Study Period | 2020-2034 |
| Base Year | 2025 |
| Estimated Year | 2026 |
| Forecast Period | 2026-2034 |
| Historical Period | 2020-2025 |
| Growth Rate | CAGR of 6.5% from 2020-2034 |
| Segmentation |
|
Table of Contents
- 1. Introduction
- 1.1. Research Scope
- 1.2. Market Segmentation
- 1.3. Research Objective
- 1.4. Definitions and Assumptions
- 2. Executive Summary
- 2.1. Market Snapshot
- 3. Market Dynamics
- 3.1. Market Drivers
- 3.2. Market Restrains
- 3.3. Market Trends
- 3.4. Market Opportunities
- 4. Market Factor Analysis
- 4.1. Porters Five Forces
- 4.1.1. Bargaining Power of Suppliers
- 4.1.2. Bargaining Power of Buyers
- 4.1.3. Threat of New Entrants
- 4.1.4. Threat of Substitutes
- 4.1.5. Competitive Rivalry
- 4.2. PESTEL analysis
- 4.3. BCG Analysis
- 4.3.1. Stars (High Growth, High Market Share)
- 4.3.2. Cash Cows (Low Growth, High Market Share)
- 4.3.3. Question Mark (High Growth, Low Market Share)
- 4.3.4. Dogs (Low Growth, Low Market Share)
- 4.4. Ansoff Matrix Analysis
- 4.5. Supply Chain Analysis
- 4.6. Regulatory Landscape
- 4.7. Current Market Potential and Opportunity Assessment (TAM–SAM–SOM Framework)
- 4.8. RAX Analyst Note
- 4.1. Porters Five Forces
- 5. Market Analysis, Insights and Forecast 2021-2033
- 5.1. Market Analysis, Insights and Forecast - by Product Type
- 5.1.1. Bio-methanol
- 5.1.2. Bio-ethanol
- 5.1.3. Bio-butanol
- 5.1.4. Bio-BDO
- 5.1.5. Other Product Types
- 5.2. Market Analysis, Insights and Forecast - by Application
- 5.2.1. Transportation
- 5.2.2. Construction
- 5.2.3. Electronics
- 5.2.4. Pharmaceutical
- 5.2.5. Other Applications
- 5.3. Market Analysis, Insights and Forecast - by Region
- 5.3.1. Asia Pacific
- 5.3.2. North America
- 5.3.3. Europe
- 5.3.4. South America
- 5.3.5. Middle East and Africa
- 5.1. Market Analysis, Insights and Forecast - by Product Type
- 6. Global Bio alcohols Market Analysis, Insights and Forecast, 2021-2033
- 6.1. Market Analysis, Insights and Forecast - by Product Type
- 6.1.1. Bio-methanol
- 6.1.2. Bio-ethanol
- 6.1.3. Bio-butanol
- 6.1.4. Bio-BDO
- 6.1.5. Other Product Types
- 6.2. Market Analysis, Insights and Forecast - by Application
- 6.2.1. Transportation
- 6.2.2. Construction
- 6.2.3. Electronics
- 6.2.4. Pharmaceutical
- 6.2.5. Other Applications
- 6.1. Market Analysis, Insights and Forecast - by Product Type
- 7. Asia Pacific Bio alcohols Market Analysis, Insights and Forecast, 2020-2032
- 7.1. Market Analysis, Insights and Forecast - by Product Type
- 7.1.1. Bio-methanol
- 7.1.2. Bio-ethanol
- 7.1.3. Bio-butanol
- 7.1.4. Bio-BDO
- 7.1.5. Other Product Types
- 7.2. Market Analysis, Insights and Forecast - by Application
- 7.2.1. Transportation
- 7.2.2. Construction
- 7.2.3. Electronics
- 7.2.4. Pharmaceutical
- 7.2.5. Other Applications
- 7.1. Market Analysis, Insights and Forecast - by Product Type
- 8. North America Bio alcohols Market Analysis, Insights and Forecast, 2020-2032
- 8.1. Market Analysis, Insights and Forecast - by Product Type
- 8.1.1. Bio-methanol
- 8.1.2. Bio-ethanol
- 8.1.3. Bio-butanol
- 8.1.4. Bio-BDO
- 8.1.5. Other Product Types
- 8.2. Market Analysis, Insights and Forecast - by Application
- 8.2.1. Transportation
- 8.2.2. Construction
- 8.2.3. Electronics
- 8.2.4. Pharmaceutical
- 8.2.5. Other Applications
- 8.1. Market Analysis, Insights and Forecast - by Product Type
- 9. Europe Bio alcohols Market Analysis, Insights and Forecast, 2020-2032
- 9.1. Market Analysis, Insights and Forecast - by Product Type
- 9.1.1. Bio-methanol
- 9.1.2. Bio-ethanol
- 9.1.3. Bio-butanol
- 9.1.4. Bio-BDO
- 9.1.5. Other Product Types
- 9.2. Market Analysis, Insights and Forecast - by Application
- 9.2.1. Transportation
- 9.2.2. Construction
- 9.2.3. Electronics
- 9.2.4. Pharmaceutical
- 9.2.5. Other Applications
- 9.1. Market Analysis, Insights and Forecast - by Product Type
- 10. South America Bio alcohols Market Analysis, Insights and Forecast, 2020-2032
- 10.1. Market Analysis, Insights and Forecast - by Product Type
- 10.1.1. Bio-methanol
- 10.1.2. Bio-ethanol
- 10.1.3. Bio-butanol
- 10.1.4. Bio-BDO
- 10.1.5. Other Product Types
- 10.2. Market Analysis, Insights and Forecast - by Application
- 10.2.1. Transportation
- 10.2.2. Construction
- 10.2.3. Electronics
- 10.2.4. Pharmaceutical
- 10.2.5. Other Applications
- 10.1. Market Analysis, Insights and Forecast - by Product Type
- 11. Middle East and Africa Bio alcohols Market Analysis, Insights and Forecast, 2020-2032
- 11.1. Market Analysis, Insights and Forecast - by Product Type
- 11.1.1. Bio-methanol
- 11.1.2. Bio-ethanol
- 11.1.3. Bio-butanol
- 11.1.4. Bio-BDO
- 11.1.5. Other Product Types
- 11.2. Market Analysis, Insights and Forecast - by Application
- 11.2.1. Transportation
- 11.2.2. Construction
- 11.2.3. Electronics
- 11.2.4. Pharmaceutical
- 11.2.5. Other Applications
- 11.1. Market Analysis, Insights and Forecast - by Product Type
- 12. Competitive Analysis
- 12.1. Company Profiles
- 12.1.1 Cargill Incorporated
- 12.1.1.1. Company Overview
- 12.1.1.2. Products
- 12.1.1.3. Company Financials
- 12.1.1.4. SWOT Analysis
- 12.1.2 Braskem
- 12.1.2.1. Company Overview
- 12.1.2.2. Products
- 12.1.2.3. Company Financials
- 12.1.2.4. SWOT Analysis
- 12.1.3 Mitsubishi Chemical Corporation
- 12.1.3.1. Company Overview
- 12.1.3.2. Products
- 12.1.3.3. Company Financials
- 12.1.3.4. SWOT Analysis
- 12.1.4 Harvest Power
- 12.1.4.1. Company Overview
- 12.1.4.2. Products
- 12.1.4.3. Company Financials
- 12.1.4.4. SWOT Analysis
- 12.1.5 Venture Center *List Not Exhaustive
- 12.1.5.1. Company Overview
- 12.1.5.2. Products
- 12.1.5.3. Company Financials
- 12.1.5.4. SWOT Analysis
- 12.1.6 BASF SE
- 12.1.6.1. Company Overview
- 12.1.6.2. Products
- 12.1.6.3. Company Financials
- 12.1.6.4. SWOT Analysis
- 12.1.7 DSM
- 12.1.7.1. Company Overview
- 12.1.7.2. Products
- 12.1.7.3. Company Financials
- 12.1.7.4. SWOT Analysis
- 12.1.8 Valero Marketing and Supply Company
- 12.1.8.1. Company Overview
- 12.1.8.2. Products
- 12.1.8.3. Company Financials
- 12.1.8.4. SWOT Analysis
- 12.1.9 Mascoma LLC
- 12.1.9.1. Company Overview
- 12.1.9.2. Products
- 12.1.9.3. Company Financials
- 12.1.9.4. SWOT Analysis
- 12.1.10 Fulcrum BioEnergy
- 12.1.10.1. Company Overview
- 12.1.10.2. Products
- 12.1.10.3. Company Financials
- 12.1.10.4. SWOT Analysis
- 12.1.1 Cargill Incorporated
- 12.2. Market Entropy
- 12.2.1 Company's Key Areas Served
- 12.2.2 Recent Developments
- 12.3. Company Market Share Analysis 2025
- 12.3.1 Top 5 Companies Market Share Analysis
- 12.3.2 Top 3 Companies Market Share Analysis
- 12.4. List of Potential Customers
- 13. Research Methodology
List of Figures
- Figure 1: Global Bio alcohols Market Revenue Breakdown (billion, %) by Region 2025 & 2033
- Figure 2: Asia Pacific Bio alcohols Market Revenue (billion), by Product Type 2025 & 2033
- Figure 3: Asia Pacific Bio alcohols Market Revenue Share (%), by Product Type 2025 & 2033
- Figure 4: Asia Pacific Bio alcohols Market Revenue (billion), by Application 2025 & 2033
- Figure 5: Asia Pacific Bio alcohols Market Revenue Share (%), by Application 2025 & 2033
- Figure 6: Asia Pacific Bio alcohols Market Revenue (billion), by Country 2025 & 2033
- Figure 7: Asia Pacific Bio alcohols Market Revenue Share (%), by Country 2025 & 2033
- Figure 8: North America Bio alcohols Market Revenue (billion), by Product Type 2025 & 2033
- Figure 9: North America Bio alcohols Market Revenue Share (%), by Product Type 2025 & 2033
- Figure 10: North America Bio alcohols Market Revenue (billion), by Application 2025 & 2033
- Figure 11: North America Bio alcohols Market Revenue Share (%), by Application 2025 & 2033
- Figure 12: North America Bio alcohols Market Revenue (billion), by Country 2025 & 2033
- Figure 13: North America Bio alcohols Market Revenue Share (%), by Country 2025 & 2033
- Figure 14: Europe Bio alcohols Market Revenue (billion), by Product Type 2025 & 2033
- Figure 15: Europe Bio alcohols Market Revenue Share (%), by Product Type 2025 & 2033
- Figure 16: Europe Bio alcohols Market Revenue (billion), by Application 2025 & 2033
- Figure 17: Europe Bio alcohols Market Revenue Share (%), by Application 2025 & 2033
- Figure 18: Europe Bio alcohols Market Revenue (billion), by Country 2025 & 2033
- Figure 19: Europe Bio alcohols Market Revenue Share (%), by Country 2025 & 2033
- Figure 20: South America Bio alcohols Market Revenue (billion), by Product Type 2025 & 2033
- Figure 21: South America Bio alcohols Market Revenue Share (%), by Product Type 2025 & 2033
- Figure 22: South America Bio alcohols Market Revenue (billion), by Application 2025 & 2033
- Figure 23: South America Bio alcohols Market Revenue Share (%), by Application 2025 & 2033
- Figure 24: South America Bio alcohols Market Revenue (billion), by Country 2025 & 2033
- Figure 25: South America Bio alcohols Market Revenue Share (%), by Country 2025 & 2033
- Figure 26: Middle East and Africa Bio alcohols Market Revenue (billion), by Product Type 2025 & 2033
- Figure 27: Middle East and Africa Bio alcohols Market Revenue Share (%), by Product Type 2025 & 2033
- Figure 28: Middle East and Africa Bio alcohols Market Revenue (billion), by Application 2025 & 2033
- Figure 29: Middle East and Africa Bio alcohols Market Revenue Share (%), by Application 2025 & 2033
- Figure 30: Middle East and Africa Bio alcohols Market Revenue (billion), by Country 2025 & 2033
- Figure 31: Middle East and Africa Bio alcohols Market Revenue Share (%), by Country 2025 & 2033
List of Tables
- Table 1: Global Bio alcohols Market Revenue billion Forecast, by Product Type 2020 & 2033
- Table 2: Global Bio alcohols Market Revenue billion Forecast, by Application 2020 & 2033
- Table 3: Global Bio alcohols Market Revenue billion Forecast, by Region 2020 & 2033
- Table 4: Global Bio alcohols Market Revenue billion Forecast, by Product Type 2020 & 2033
- Table 5: Global Bio alcohols Market Revenue billion Forecast, by Application 2020 & 2033
- Table 6: Global Bio alcohols Market Revenue billion Forecast, by Country 2020 & 2033
- Table 7: China Bio alcohols Market Revenue (billion) Forecast, by Application 2020 & 2033
- Table 8: India Bio alcohols Market Revenue (billion) Forecast, by Application 2020 & 2033
- Table 9: Japan Bio alcohols Market Revenue (billion) Forecast, by Application 2020 & 2033
- Table 10: South Korea Bio alcohols Market Revenue (billion) Forecast, by Application 2020 & 2033
- Table 11: ASEAN Countries Bio alcohols Market Revenue (billion) Forecast, by Application 2020 & 2033
- Table 12: Rest of Asia Pacific Bio alcohols Market Revenue (billion) Forecast, by Application 2020 & 2033
- Table 13: Global Bio alcohols Market Revenue billion Forecast, by Product Type 2020 & 2033
- Table 14: Global Bio alcohols Market Revenue billion Forecast, by Application 2020 & 2033
- Table 15: Global Bio alcohols Market Revenue billion Forecast, by Country 2020 & 2033
- Table 16: United States Bio alcohols Market Revenue (billion) Forecast, by Application 2020 & 2033
- Table 17: Canada Bio alcohols Market Revenue (billion) Forecast, by Application 2020 & 2033
- Table 18: Mexico Bio alcohols Market Revenue (billion) Forecast, by Application 2020 & 2033
- Table 19: Global Bio alcohols Market Revenue billion Forecast, by Product Type 2020 & 2033
- Table 20: Global Bio alcohols Market Revenue billion Forecast, by Application 2020 & 2033
- Table 21: Global Bio alcohols Market Revenue billion Forecast, by Country 2020 & 2033
- Table 22: Germany Bio alcohols Market Revenue (billion) Forecast, by Application 2020 & 2033
- Table 23: United Kingdom Bio alcohols Market Revenue (billion) Forecast, by Application 2020 & 2033
- Table 24: Italy Bio alcohols Market Revenue (billion) Forecast, by Application 2020 & 2033
- Table 25: France Bio alcohols Market Revenue (billion) Forecast, by Application 2020 & 2033
- Table 26: Rest of Europe Bio alcohols Market Revenue (billion) Forecast, by Application 2020 & 2033
- Table 27: Global Bio alcohols Market Revenue billion Forecast, by Product Type 2020 & 2033
- Table 28: Global Bio alcohols Market Revenue billion Forecast, by Application 2020 & 2033
- Table 29: Global Bio alcohols Market Revenue billion Forecast, by Country 2020 & 2033
- Table 30: Brazil Bio alcohols Market Revenue (billion) Forecast, by Application 2020 & 2033
- Table 31: Argentina Bio alcohols Market Revenue (billion) Forecast, by Application 2020 & 2033
- Table 32: Rest of South America Bio alcohols Market Revenue (billion) Forecast, by Application 2020 & 2033
- Table 33: Global Bio alcohols Market Revenue billion Forecast, by Product Type 2020 & 2033
- Table 34: Global Bio alcohols Market Revenue billion Forecast, by Application 2020 & 2033
- Table 35: Global Bio alcohols Market Revenue billion Forecast, by Country 2020 & 2033
- Table 36: Saudi Arabia Bio alcohols Market Revenue (billion) Forecast, by Application 2020 & 2033
- Table 37: South Africa Bio alcohols Market Revenue (billion) Forecast, by Application 2020 & 2033
- Table 38: Rest of Middle East and Africa Bio alcohols Market Revenue (billion) Forecast, by Application 2020 & 2033
Frequently Asked Questions
1. What is the projected Compound Annual Growth Rate (CAGR) of the Bio alcohols Market?
The projected CAGR is approximately 6.5%.
2. Which companies are prominent players in the Bio alcohols Market?
Key companies in the market include Cargill Incorporated, Braskem, Mitsubishi Chemical Corporation, Harvest Power, Venture Center *List Not Exhaustive, BASF SE, DSM, Valero Marketing and Supply Company, Mascoma LLC, Fulcrum BioEnergy.
3. What are the main segments of the Bio alcohols Market?
The market segments include Product Type, Application.
4. Can you provide details about the market size?
The market size is estimated to be USD 12.55 billion as of 2022.
5. What are some drivers contributing to market growth?
; Growing Demand for Bio-based Products; Other Drivers.
6. What are the notable trends driving market growth?
Bio-ethanol to Dominate the Market.
7. Are there any restraints impacting market growth?
; Declining Automotive Production; Impact of COVID-19 Pandemic.
8. Can you provide examples of recent developments in the market?
N/A
9. What pricing options are available for accessing the report?
Pricing options include single-user, multi-user, and enterprise licenses priced at USD 4750, USD 5250, and USD 8750 respectively.
10. Is the market size provided in terms of value or volume?
The market size is provided in terms of value, measured in billion.
11. Are there any specific market keywords associated with the report?
Yes, the market keyword associated with the report is "Bio alcohols Market," which aids in identifying and referencing the specific market segment covered.
12. How do I determine which pricing option suits my needs best?
The pricing options vary based on user requirements and access needs. Individual users may opt for single-user licenses, while businesses requiring broader access may choose multi-user or enterprise licenses for cost-effective access to the report.
13. Are there any additional resources or data provided in the Bio alcohols Market report?
While the report offers comprehensive insights, it's advisable to review the specific contents or supplementary materials provided to ascertain if additional resources or data are available.
14. How can I stay updated on further developments or reports in the Bio alcohols Market?
To stay informed about further developments, trends, and reports in the Bio alcohols Market, consider subscribing to industry newsletters, following relevant companies and organizations, or regularly checking reputable industry news sources and publications.
Methodology
Step 1 - Identification of Relevant Samples Size from Population Database


Step 2 - Approaches for Defining Global Market Size (Value, Volume* & Price*)

Note*: In applicable scenarios
Step 3 - Data Sources
Primary Research
- Web Analytics
- Survey Reports
- Research Institute
- Latest Research Reports
- Opinion Leaders
Secondary Research
- Annual Reports
- White Paper
- Latest Press Release
- Industry Association
- Paid Database
- Investor Presentations

Step 4 - Data Triangulation
Involves using different sources of information in order to increase the validity of a study
These sources are likely to be stakeholders in a program - participants, other researchers, program staff, other community members, and so on.
Then we put all data in single framework & apply various statistical tools to find out the dynamic on the market.
During the analysis stage, feedback from the stakeholder groups would be compared to determine areas of agreement as well as areas of divergence

