
Key Insights
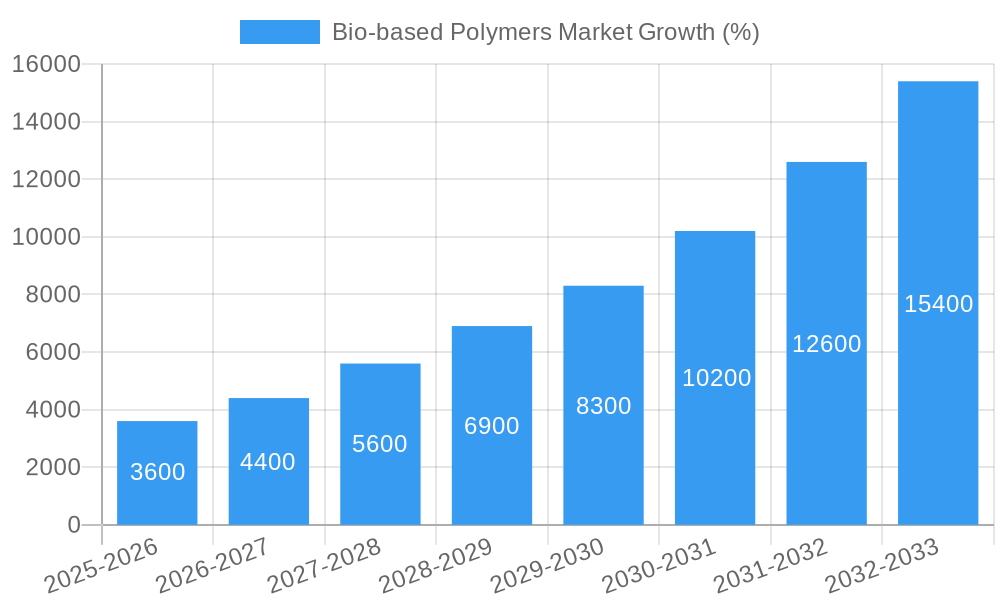
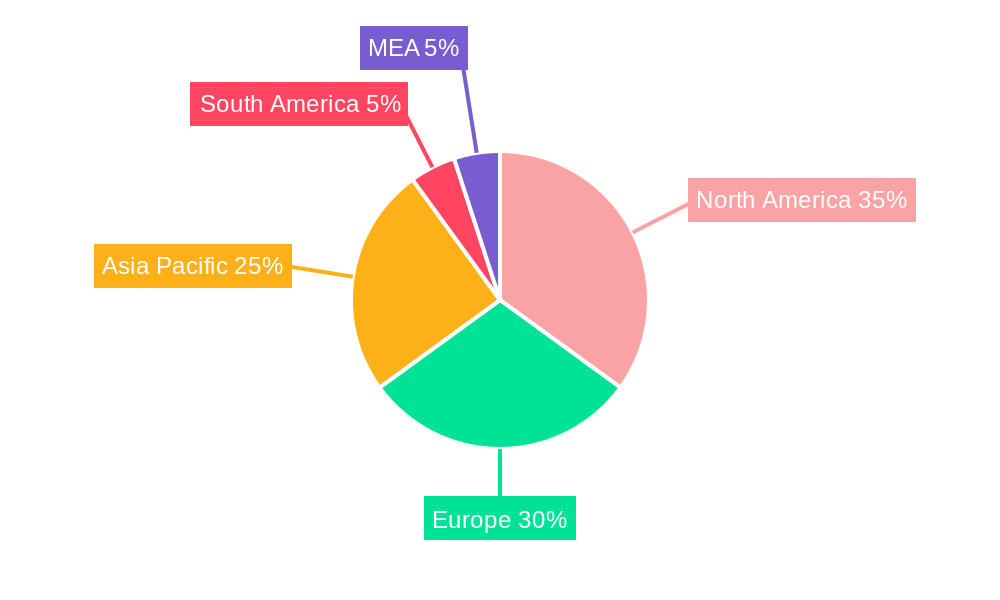
The bio-based polymers market is experiencing robust growth, driven by increasing environmental concerns and stringent regulations regarding the use of petroleum-based plastics. The market's Compound Annual Growth Rate (CAGR) of 24.30% from 2019-2024 indicates a significant upward trajectory, projected to continue throughout the forecast period (2025-2033). Key drivers include the rising demand for sustainable and biodegradable materials across various sectors, including packaging, agriculture, and textiles. Growing consumer awareness of environmental issues and the increasing adoption of circular economy principles further fuel this market expansion. Starch-based plastics and polylactic acid (PLA) currently dominate the market, owing to their relatively lower cost and established production infrastructure. However, other bio-based polymers like polyhydroxyalkanoates (PHA) and polyesters are gaining traction due to their superior properties and expanding applications in high-value sectors like healthcare and electronics. Geographical segmentation reveals a strong presence in North America and Europe, driven by established industries and supportive government policies promoting sustainable materials. The Asia-Pacific region is expected to show significant growth in the coming years, fueled by increasing industrialization and rising consumer demand. While challenges remain, such as the higher cost of production compared to conventional plastics and the need for improved scalability and infrastructure, ongoing technological advancements and supportive government initiatives are expected to mitigate these constraints and facilitate further market expansion.
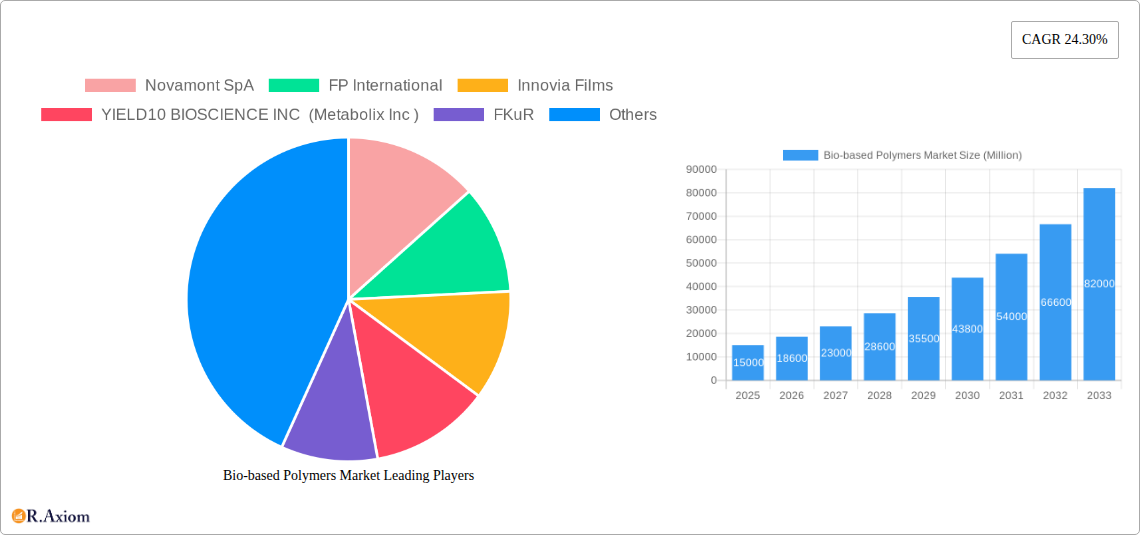
The competitive landscape is characterized by a mix of large multinational corporations and specialized smaller players. Key players like Novamont SpA, NatureWorks LLC, and BASF SE are heavily investing in research and development to enhance the performance and cost-effectiveness of bio-based polymers. Strategic partnerships, mergers, and acquisitions are expected to reshape the market dynamics in the coming years, fostering innovation and accelerating market penetration. Future growth will be driven by advancements in bio-based polymer technology, including the development of new materials with enhanced properties, improved processing techniques, and the expansion of application areas. The successful development and commercialization of cost-effective and high-performance bio-based polymers will be crucial in achieving widespread adoption and realizing the full potential of this burgeoning market. The market is poised for significant expansion, driven by environmental imperatives and technological advancements, making it an attractive investment opportunity for stakeholders across the value chain.
Bio-based Polymers Market: A Comprehensive Report (2019-2033)
This comprehensive report provides an in-depth analysis of the Bio-based Polymers market, offering valuable insights for industry stakeholders, investors, and researchers. Covering the period from 2019 to 2033, with 2025 as the base year and a forecast period of 2025-2033, this report meticulously examines market trends, growth drivers, challenges, and opportunities. The study encompasses detailed segmentation by type (Starch-based Plastics, Poly Lactic Acid (PLA), PolyHydroxy Alkanoates (PHA), Polyesters (PBS, PBAT, and PCL), Cellulose Derivatives) and application (Agriculture, Textile, Electronics, Packaging, Healthcare, Other Applications), providing a granular understanding of the market landscape. The report also profiles key players, including Novamont SpA, FP International, Innovia Films, YIELD10 BIOSCIENCE INC (Metabolix Inc), FKuR, Merck KGaA, Cardia Bioplastics, Rodenburg Biopolymers, Covestro AG, NatureWorks LLC, thyssenkrupp AG, DuPont de Nemours Inc, Biologische Naturverpackungen GmbH & Co KG, Corbion, Cortec Group Management Services LLC, SHOWA DENKO K K, and BASF SE, analyzing their market strategies and competitive positions. The total market size in 2025 is estimated at xx Million.
Bio-based Polymers Market Market Concentration & Innovation
The Bio-based Polymers market exhibits a moderately concentrated landscape, with a few major players holding significant market share. However, the presence of numerous smaller companies and startups, particularly in niche applications, signifies a dynamic competitive environment. Market share data for the top five players in 2025 is estimated at xx%, indicating room for both organic growth and acquisitions. Innovation is a key driver, fueled by advancements in bio-based polymer synthesis, material properties enhancement, and the development of biodegradable and compostable alternatives to traditional petroleum-based plastics. Regulatory frameworks, particularly those promoting sustainability and reducing plastic waste, are significantly impacting market growth. The increasing demand for eco-friendly materials across various end-user industries, coupled with growing consumer awareness of environmental concerns, is driving the adoption of bio-based polymers.
- Market Concentration: Top 5 players hold approximately xx% market share in 2025.
- Innovation Drivers: Advancements in bio-based polymer synthesis, improved material properties, and development of biodegradable alternatives.
- Regulatory Frameworks: Government policies promoting sustainability and waste reduction are accelerating market growth.
- M&A Activities: The number of M&A deals in the Bio-based Polymers sector between 2019 and 2024 totaled xx, with a total value of approximately xx Million. These deals often focused on expanding product portfolios and gaining access to new technologies.
- Product Substitutes: Traditional petroleum-based plastics remain significant competitors, though their market share is expected to decline gradually.
- End-User Trends: Growing demand for sustainable packaging solutions is a major growth driver across multiple sectors.
Bio-based Polymers Market Industry Trends & Insights
The Bio-based Polymers market is experiencing robust growth, driven by the increasing global focus on sustainability and the rising demand for environmentally friendly materials. The Compound Annual Growth Rate (CAGR) during the forecast period (2025-2033) is projected to be xx%. This growth is further fueled by technological advancements leading to improved bio-based polymer performance and cost reductions. Consumer preferences are shifting towards sustainable products, pushing manufacturers to adopt bio-based polymers in various applications. The competitive landscape is characterized by both established players and emerging companies, leading to innovative product developments and strategic partnerships. Market penetration is increasing significantly across various end-user sectors, especially in packaging, textiles, and agriculture. Specific innovations like improved biodegradability and compostability are key differentiating factors in the market. Technological disruptions, such as the development of new bio-based polymer types and improved processing techniques, are further accelerating market expansion.
Dominant Markets & Segments in Bio-based Polymers Market
The packaging segment dominates the Bio-based Polymers market due to increasing demand for eco-friendly packaging solutions. Geographically, Asia Pacific is the leading region, driven by substantial economic growth, expanding consumer base, and favorable government regulations. Within the type segment, Poly Lactic Acid (PLA) currently holds the largest market share, owing to its established production capacity and wide range of applications.
- Leading Region: Asia Pacific
- Key Drivers: Rapid economic growth, burgeoning consumer base, and supportive government initiatives.
- Leading Segment (Type): Poly Lactic Acid (PLA)
- Key Drivers: Established production capacity, versatile applications, and relatively lower cost compared to other bio-based polymers.
- Leading Segment (Application): Packaging
- Key Drivers: Growing consumer demand for eco-friendly packaging, stringent regulations on plastic waste, and increasing awareness of environmental issues.
Bio-based Polymers Market Product Developments
Recent product innovations have focused on improving the performance characteristics of bio-based polymers, such as enhancing their strength, flexibility, and barrier properties. This has expanded their applicability to more demanding applications. The development of new bio-based polymer types with improved biodegradability and compostability characteristics is also creating exciting new possibilities. Competitive advantages are being established through proprietary technologies, cost-effective production processes, and strategic partnerships. The market is witnessing a significant push towards fully compostable and biodegradable alternatives to traditional plastics, aligning with global sustainability goals.
Report Scope & Segmentation Analysis
This report segments the Bio-based Polymers market based on type and application.
By Type:
- Starch-based Plastics: This segment is characterized by its relatively lower cost and widespread availability of raw materials, resulting in moderate growth. Competitive dynamics are shaped by variations in starch sources and processing techniques.
- Poly Lactic Acid (PLA): This segment holds a significant market share driven by its versatility, established production infrastructure, and growing adoption across various applications. The competitive landscape is intensely competitive, with several major players vying for market share.
- PolyHydroxy Alkanoates (PHA): This segment exhibits high growth potential due to its superior biodegradability and potential in specialized applications. However, high production costs currently limit its widespread adoption.
- Polyesters (PBS, PBAT, and PCL): This segment is characterized by a diverse range of applications, with growth driven by improved material properties and increasing demand in various end-use industries.
- Cellulose Derivatives: This segment offers sustainable alternatives with unique properties. The market is driven by the increasing demand for eco-friendly materials in specialized applications.
By Application:
Each application segment shows varied growth rates reflecting distinct market dynamics and regulatory pressures. Growth projections for each segment are detailed within the full report.
Key Drivers of Bio-based Polymers Market Growth
The Bio-based Polymers market is propelled by several key factors. Growing environmental concerns and stringent government regulations on plastic waste are driving the adoption of sustainable alternatives. Increasing consumer awareness of environmental issues and a preference for eco-friendly products further fuels market demand. Technological advancements, including the development of new bio-based polymer types with improved properties, are crucial in expanding the market. Favorable economic policies and incentives supporting the bio-based industry also contribute to market growth.
Challenges in the Bio-based Polymers Market Sector
Despite its growth potential, the Bio-based Polymers market faces challenges. High production costs compared to traditional petroleum-based plastics remain a barrier to widespread adoption. The availability and consistency of renewable feedstocks can pose supply chain issues, while the biodegradability of some polymers may be limited under certain conditions. Competition from established petroleum-based plastics and the need for further advancements in material properties also pose challenges. The impact of these challenges on market growth is quantified within the full report.
Emerging Opportunities in Bio-based Polymers Market
Emerging opportunities abound for Bio-based Polymers. New applications are constantly emerging, including advanced biodegradable packaging, specialized films, and medical implants. Technological innovations, such as improved processing techniques and the development of novel bio-based polymer types with enhanced properties, are unlocking new markets. Increasing consumer demand for sustainable and eco-friendly products and the growing awareness of the environmental impact of plastic waste present significant opportunities for market expansion. The exploration of novel bio-based sources and efficient production methods will further drive growth.
Leading Players in the Bio-based Polymers Market Market
- Novamont SpA
- FP International
- Innovia Films
- YIELD10 BIOSCIENCE INC (Metabolix Inc)
- FKuR
- Merck KGaA
- Cardia Bioplastics
- Rodenburg Biopolymers
- Covestro AG
- NatureWorks LLC
- thyssenkrupp AG
- DuPont de Nemours Inc
- Biologische Naturverpackungen GmbH & Co KG
- Corbion
- Cortec Group Management Services LLC
- SHOWA DENKO K K
- BASF SE
Key Developments in Bio-based Polymers Market Industry
- January 2023: Company X launched a new bio-based polymer with improved heat resistance.
- March 2022: Company Y announced a strategic partnership to expand its production capacity.
- June 2021: Company Z acquired a smaller competitor, broadening its product portfolio.
- (Further key developments with year/month will be detailed in the full report.)
Strategic Outlook for Bio-based Polymers Market Market
The Bio-based Polymers market is poised for significant growth, driven by increasing demand for sustainable materials, technological advancements, and favorable government policies. The market's future potential is substantial, particularly in emerging economies and sectors with high plastic consumption. Further innovation in bio-based polymer synthesis, improved material properties, and cost reductions will be key to unlocking even greater market opportunities. Strategic partnerships, mergers and acquisitions, and a focus on sustainable manufacturing practices will shape the competitive landscape in the years to come.
Bio-based Polymers Market Segmentation
-
1. Type
- 1.1. Starch-based Plastics
- 1.2. Poly Lactic Acid (PLA)
- 1.3. PolyHydroxy Alkanoates (PHA)
- 1.4. Polyesters (PBS, PBAT, and PCL)
- 1.5. Cellulose Derivatives
-
2. Application
- 2.1. Agriculture
- 2.2. Textile
- 2.3. Electronics
- 2.4. Packaging
- 2.5. Healthcare
- 2.6. Other Applications
Bio-based Polymers Market Segmentation By Geography
-
1. Asia Pacific
- 1.1. China
- 1.2. India
- 1.3. Japan
- 1.4. South Korea
- 1.5. Rest of Asia Pacific
-
2. North America
- 2.1. United States
- 2.2. Canada
- 2.3. Mexico
-
3. Europe
- 3.1. Germany
- 3.2. United Kingdom
- 3.3. Italy
- 3.4. France
- 3.5. Rest of Europe
-
4. Rest of World
- 4.1. Brazil
- 4.2. Saudi Arabia
- 4.3. Rest of the World
Bio-based Polymers Market REPORT HIGHLIGHTS
| Aspects | Details |
|---|---|
| Study Period | 2019-2033 |
| Base Year | 2024 |
| Estimated Year | 2025 |
| Forecast Period | 2025-2033 |
| Historical Period | 2019-2024 |
| Growth Rate | CAGR of 24.30% from 2019-2033 |
| Segmentation |
|
Table of Contents
- 1. Introduction
- 1.1. Research Scope
- 1.2. Market Segmentation
- 1.3. Research Methodology
- 1.4. Definitions and Assumptions
- 2. Executive Summary
- 2.1. Introduction
- 3. Market Dynamics
- 3.1. Introduction
- 3.2. Market Drivers
- 3.2.1. Preference toward Eco-friendly Polymers to Preserve Environment; Regulation on Non-degradable Polymers in Many Countries; Increasing Consumer Awareness in Developed and Developing Nations; Non-toxic Nature of Biodegradable Polymers
- 3.3. Market Restrains
- 3.3.1. Higher Price Compared to Petroleum-based polymers; Low Awareness in Low Income Countries
- 3.4. Market Trends
- 3.4.1. Increasing Demand from Packaging Industry
- 4. Market Factor Analysis
- 4.1. Porters Five Forces
- 4.2. Supply/Value Chain
- 4.3. PESTEL analysis
- 4.4. Market Entropy
- 4.5. Patent/Trademark Analysis
- 5. Global Bio-based Polymers Market Analysis, Insights and Forecast, 2019-2031
- 5.1. Market Analysis, Insights and Forecast - by Type
- 5.1.1. Starch-based Plastics
- 5.1.2. Poly Lactic Acid (PLA)
- 5.1.3. PolyHydroxy Alkanoates (PHA)
- 5.1.4. Polyesters (PBS, PBAT, and PCL)
- 5.1.5. Cellulose Derivatives
- 5.2. Market Analysis, Insights and Forecast - by Application
- 5.2.1. Agriculture
- 5.2.2. Textile
- 5.2.3. Electronics
- 5.2.4. Packaging
- 5.2.5. Healthcare
- 5.2.6. Other Applications
- 5.3. Market Analysis, Insights and Forecast - by Region
- 5.3.1. Asia Pacific
- 5.3.2. North America
- 5.3.3. Europe
- 5.3.4. Rest of World
- 5.1. Market Analysis, Insights and Forecast - by Type
- 6. Asia Pacific Bio-based Polymers Market Analysis, Insights and Forecast, 2019-2031
- 6.1. Market Analysis, Insights and Forecast - by Type
- 6.1.1. Starch-based Plastics
- 6.1.2. Poly Lactic Acid (PLA)
- 6.1.3. PolyHydroxy Alkanoates (PHA)
- 6.1.4. Polyesters (PBS, PBAT, and PCL)
- 6.1.5. Cellulose Derivatives
- 6.2. Market Analysis, Insights and Forecast - by Application
- 6.2.1. Agriculture
- 6.2.2. Textile
- 6.2.3. Electronics
- 6.2.4. Packaging
- 6.2.5. Healthcare
- 6.2.6. Other Applications
- 6.1. Market Analysis, Insights and Forecast - by Type
- 7. North America Bio-based Polymers Market Analysis, Insights and Forecast, 2019-2031
- 7.1. Market Analysis, Insights and Forecast - by Type
- 7.1.1. Starch-based Plastics
- 7.1.2. Poly Lactic Acid (PLA)
- 7.1.3. PolyHydroxy Alkanoates (PHA)
- 7.1.4. Polyesters (PBS, PBAT, and PCL)
- 7.1.5. Cellulose Derivatives
- 7.2. Market Analysis, Insights and Forecast - by Application
- 7.2.1. Agriculture
- 7.2.2. Textile
- 7.2.3. Electronics
- 7.2.4. Packaging
- 7.2.5. Healthcare
- 7.2.6. Other Applications
- 7.1. Market Analysis, Insights and Forecast - by Type
- 8. Europe Bio-based Polymers Market Analysis, Insights and Forecast, 2019-2031
- 8.1. Market Analysis, Insights and Forecast - by Type
- 8.1.1. Starch-based Plastics
- 8.1.2. Poly Lactic Acid (PLA)
- 8.1.3. PolyHydroxy Alkanoates (PHA)
- 8.1.4. Polyesters (PBS, PBAT, and PCL)
- 8.1.5. Cellulose Derivatives
- 8.2. Market Analysis, Insights and Forecast - by Application
- 8.2.1. Agriculture
- 8.2.2. Textile
- 8.2.3. Electronics
- 8.2.4. Packaging
- 8.2.5. Healthcare
- 8.2.6. Other Applications
- 8.1. Market Analysis, Insights and Forecast - by Type
- 9. Rest of World Bio-based Polymers Market Analysis, Insights and Forecast, 2019-2031
- 9.1. Market Analysis, Insights and Forecast - by Type
- 9.1.1. Starch-based Plastics
- 9.1.2. Poly Lactic Acid (PLA)
- 9.1.3. PolyHydroxy Alkanoates (PHA)
- 9.1.4. Polyesters (PBS, PBAT, and PCL)
- 9.1.5. Cellulose Derivatives
- 9.2. Market Analysis, Insights and Forecast - by Application
- 9.2.1. Agriculture
- 9.2.2. Textile
- 9.2.3. Electronics
- 9.2.4. Packaging
- 9.2.5. Healthcare
- 9.2.6. Other Applications
- 9.1. Market Analysis, Insights and Forecast - by Type
- 10. North America Bio-based Polymers Market Analysis, Insights and Forecast, 2019-2031
- 10.1. Market Analysis, Insights and Forecast - By Country/Sub-region
- 10.1.1 United States
- 10.1.2 Canada
- 10.1.3 Mexico
- 11. Europe Bio-based Polymers Market Analysis, Insights and Forecast, 2019-2031
- 11.1. Market Analysis, Insights and Forecast - By Country/Sub-region
- 11.1.1 Germany
- 11.1.2 United Kingdom
- 11.1.3 France
- 11.1.4 Spain
- 11.1.5 Italy
- 11.1.6 Spain
- 11.1.7 Belgium
- 11.1.8 Netherland
- 11.1.9 Nordics
- 11.1.10 Rest of Europe
- 12. Asia Pacific Bio-based Polymers Market Analysis, Insights and Forecast, 2019-2031
- 12.1. Market Analysis, Insights and Forecast - By Country/Sub-region
- 12.1.1 China
- 12.1.2 Japan
- 12.1.3 India
- 12.1.4 South Korea
- 12.1.5 Southeast Asia
- 12.1.6 Australia
- 12.1.7 Indonesia
- 12.1.8 Phillipes
- 12.1.9 Singapore
- 12.1.10 Thailandc
- 12.1.11 Rest of Asia Pacific
- 13. South America Bio-based Polymers Market Analysis, Insights and Forecast, 2019-2031
- 13.1. Market Analysis, Insights and Forecast - By Country/Sub-region
- 13.1.1 Brazil
- 13.1.2 Argentina
- 13.1.3 Peru
- 13.1.4 Chile
- 13.1.5 Colombia
- 13.1.6 Ecuador
- 13.1.7 Venezuela
- 13.1.8 Rest of South America
- 14. North America Bio-based Polymers Market Analysis, Insights and Forecast, 2019-2031
- 14.1. Market Analysis, Insights and Forecast - By Country/Sub-region
- 14.1.1 United States
- 14.1.2 Canada
- 14.1.3 Mexico
- 15. MEA Bio-based Polymers Market Analysis, Insights and Forecast, 2019-2031
- 15.1. Market Analysis, Insights and Forecast - By Country/Sub-region
- 15.1.1 United Arab Emirates
- 15.1.2 Saudi Arabia
- 15.1.3 South Africa
- 15.1.4 Rest of Middle East and Africa
- 16. Competitive Analysis
- 16.1. Global Market Share Analysis 2024
- 16.2. Company Profiles
- 16.2.1 Novamont SpA
- 16.2.1.1. Overview
- 16.2.1.2. Products
- 16.2.1.3. SWOT Analysis
- 16.2.1.4. Recent Developments
- 16.2.1.5. Financials (Based on Availability)
- 16.2.2 FP International
- 16.2.2.1. Overview
- 16.2.2.2. Products
- 16.2.2.3. SWOT Analysis
- 16.2.2.4. Recent Developments
- 16.2.2.5. Financials (Based on Availability)
- 16.2.3 Innovia Films
- 16.2.3.1. Overview
- 16.2.3.2. Products
- 16.2.3.3. SWOT Analysis
- 16.2.3.4. Recent Developments
- 16.2.3.5. Financials (Based on Availability)
- 16.2.4 YIELD10 BIOSCIENCE INC (Metabolix Inc )
- 16.2.4.1. Overview
- 16.2.4.2. Products
- 16.2.4.3. SWOT Analysis
- 16.2.4.4. Recent Developments
- 16.2.4.5. Financials (Based on Availability)
- 16.2.5 FKuR
- 16.2.5.1. Overview
- 16.2.5.2. Products
- 16.2.5.3. SWOT Analysis
- 16.2.5.4. Recent Developments
- 16.2.5.5. Financials (Based on Availability)
- 16.2.6 Merck KGaA
- 16.2.6.1. Overview
- 16.2.6.2. Products
- 16.2.6.3. SWOT Analysis
- 16.2.6.4. Recent Developments
- 16.2.6.5. Financials (Based on Availability)
- 16.2.7 Cardia Bioplastics
- 16.2.7.1. Overview
- 16.2.7.2. Products
- 16.2.7.3. SWOT Analysis
- 16.2.7.4. Recent Developments
- 16.2.7.5. Financials (Based on Availability)
- 16.2.8 Rodenburg Biopolymers
- 16.2.8.1. Overview
- 16.2.8.2. Products
- 16.2.8.3. SWOT Analysis
- 16.2.8.4. Recent Developments
- 16.2.8.5. Financials (Based on Availability)
- 16.2.9 Covestro AG
- 16.2.9.1. Overview
- 16.2.9.2. Products
- 16.2.9.3. SWOT Analysis
- 16.2.9.4. Recent Developments
- 16.2.9.5. Financials (Based on Availability)
- 16.2.10 NatureWorks LLC
- 16.2.10.1. Overview
- 16.2.10.2. Products
- 16.2.10.3. SWOT Analysis
- 16.2.10.4. Recent Developments
- 16.2.10.5. Financials (Based on Availability)
- 16.2.11 thyssenkrupp AG*List Not Exhaustive
- 16.2.11.1. Overview
- 16.2.11.2. Products
- 16.2.11.3. SWOT Analysis
- 16.2.11.4. Recent Developments
- 16.2.11.5. Financials (Based on Availability)
- 16.2.12 DuPont de Nemours Inc
- 16.2.12.1. Overview
- 16.2.12.2. Products
- 16.2.12.3. SWOT Analysis
- 16.2.12.4. Recent Developments
- 16.2.12.5. Financials (Based on Availability)
- 16.2.13 Biologische Naturverpackungen GmbH & Co KG
- 16.2.13.1. Overview
- 16.2.13.2. Products
- 16.2.13.3. SWOT Analysis
- 16.2.13.4. Recent Developments
- 16.2.13.5. Financials (Based on Availability)
- 16.2.14 Corbion
- 16.2.14.1. Overview
- 16.2.14.2. Products
- 16.2.14.3. SWOT Analysis
- 16.2.14.4. Recent Developments
- 16.2.14.5. Financials (Based on Availability)
- 16.2.15 Cortec Group Management Services LLC
- 16.2.15.1. Overview
- 16.2.15.2. Products
- 16.2.15.3. SWOT Analysis
- 16.2.15.4. Recent Developments
- 16.2.15.5. Financials (Based on Availability)
- 16.2.16 SHOWA DENKO K K
- 16.2.16.1. Overview
- 16.2.16.2. Products
- 16.2.16.3. SWOT Analysis
- 16.2.16.4. Recent Developments
- 16.2.16.5. Financials (Based on Availability)
- 16.2.17 BASF SE
- 16.2.17.1. Overview
- 16.2.17.2. Products
- 16.2.17.3. SWOT Analysis
- 16.2.17.4. Recent Developments
- 16.2.17.5. Financials (Based on Availability)
- 16.2.1 Novamont SpA
List of Figures
- Figure 1: Global Bio-based Polymers Market Revenue Breakdown (Million, %) by Region 2024 & 2032
- Figure 2: Global Bio-based Polymers Market Volume Breakdown (Million, %) by Region 2024 & 2032
- Figure 3: North America Bio-based Polymers Market Revenue (Million), by Country 2024 & 2032
- Figure 4: North America Bio-based Polymers Market Volume (Million), by Country 2024 & 2032
- Figure 5: North America Bio-based Polymers Market Revenue Share (%), by Country 2024 & 2032
- Figure 6: North America Bio-based Polymers Market Volume Share (%), by Country 2024 & 2032
- Figure 7: Europe Bio-based Polymers Market Revenue (Million), by Country 2024 & 2032
- Figure 8: Europe Bio-based Polymers Market Volume (Million), by Country 2024 & 2032
- Figure 9: Europe Bio-based Polymers Market Revenue Share (%), by Country 2024 & 2032
- Figure 10: Europe Bio-based Polymers Market Volume Share (%), by Country 2024 & 2032
- Figure 11: Asia Pacific Bio-based Polymers Market Revenue (Million), by Country 2024 & 2032
- Figure 12: Asia Pacific Bio-based Polymers Market Volume (Million), by Country 2024 & 2032
- Figure 13: Asia Pacific Bio-based Polymers Market Revenue Share (%), by Country 2024 & 2032
- Figure 14: Asia Pacific Bio-based Polymers Market Volume Share (%), by Country 2024 & 2032
- Figure 15: South America Bio-based Polymers Market Revenue (Million), by Country 2024 & 2032
- Figure 16: South America Bio-based Polymers Market Volume (Million), by Country 2024 & 2032
- Figure 17: South America Bio-based Polymers Market Revenue Share (%), by Country 2024 & 2032
- Figure 18: South America Bio-based Polymers Market Volume Share (%), by Country 2024 & 2032
- Figure 19: North America Bio-based Polymers Market Revenue (Million), by Country 2024 & 2032
- Figure 20: North America Bio-based Polymers Market Volume (Million), by Country 2024 & 2032
- Figure 21: North America Bio-based Polymers Market Revenue Share (%), by Country 2024 & 2032
- Figure 22: North America Bio-based Polymers Market Volume Share (%), by Country 2024 & 2032
- Figure 23: MEA Bio-based Polymers Market Revenue (Million), by Country 2024 & 2032
- Figure 24: MEA Bio-based Polymers Market Volume (Million), by Country 2024 & 2032
- Figure 25: MEA Bio-based Polymers Market Revenue Share (%), by Country 2024 & 2032
- Figure 26: MEA Bio-based Polymers Market Volume Share (%), by Country 2024 & 2032
- Figure 27: Asia Pacific Bio-based Polymers Market Revenue (Million), by Type 2024 & 2032
- Figure 28: Asia Pacific Bio-based Polymers Market Volume (Million), by Type 2024 & 2032
- Figure 29: Asia Pacific Bio-based Polymers Market Revenue Share (%), by Type 2024 & 2032
- Figure 30: Asia Pacific Bio-based Polymers Market Volume Share (%), by Type 2024 & 2032
- Figure 31: Asia Pacific Bio-based Polymers Market Revenue (Million), by Application 2024 & 2032
- Figure 32: Asia Pacific Bio-based Polymers Market Volume (Million), by Application 2024 & 2032
- Figure 33: Asia Pacific Bio-based Polymers Market Revenue Share (%), by Application 2024 & 2032
- Figure 34: Asia Pacific Bio-based Polymers Market Volume Share (%), by Application 2024 & 2032
- Figure 35: Asia Pacific Bio-based Polymers Market Revenue (Million), by Country 2024 & 2032
- Figure 36: Asia Pacific Bio-based Polymers Market Volume (Million), by Country 2024 & 2032
- Figure 37: Asia Pacific Bio-based Polymers Market Revenue Share (%), by Country 2024 & 2032
- Figure 38: Asia Pacific Bio-based Polymers Market Volume Share (%), by Country 2024 & 2032
- Figure 39: North America Bio-based Polymers Market Revenue (Million), by Type 2024 & 2032
- Figure 40: North America Bio-based Polymers Market Volume (Million), by Type 2024 & 2032
- Figure 41: North America Bio-based Polymers Market Revenue Share (%), by Type 2024 & 2032
- Figure 42: North America Bio-based Polymers Market Volume Share (%), by Type 2024 & 2032
- Figure 43: North America Bio-based Polymers Market Revenue (Million), by Application 2024 & 2032
- Figure 44: North America Bio-based Polymers Market Volume (Million), by Application 2024 & 2032
- Figure 45: North America Bio-based Polymers Market Revenue Share (%), by Application 2024 & 2032
- Figure 46: North America Bio-based Polymers Market Volume Share (%), by Application 2024 & 2032
- Figure 47: North America Bio-based Polymers Market Revenue (Million), by Country 2024 & 2032
- Figure 48: North America Bio-based Polymers Market Volume (Million), by Country 2024 & 2032
- Figure 49: North America Bio-based Polymers Market Revenue Share (%), by Country 2024 & 2032
- Figure 50: North America Bio-based Polymers Market Volume Share (%), by Country 2024 & 2032
- Figure 51: Europe Bio-based Polymers Market Revenue (Million), by Type 2024 & 2032
- Figure 52: Europe Bio-based Polymers Market Volume (Million), by Type 2024 & 2032
- Figure 53: Europe Bio-based Polymers Market Revenue Share (%), by Type 2024 & 2032
- Figure 54: Europe Bio-based Polymers Market Volume Share (%), by Type 2024 & 2032
- Figure 55: Europe Bio-based Polymers Market Revenue (Million), by Application 2024 & 2032
- Figure 56: Europe Bio-based Polymers Market Volume (Million), by Application 2024 & 2032
- Figure 57: Europe Bio-based Polymers Market Revenue Share (%), by Application 2024 & 2032
- Figure 58: Europe Bio-based Polymers Market Volume Share (%), by Application 2024 & 2032
- Figure 59: Europe Bio-based Polymers Market Revenue (Million), by Country 2024 & 2032
- Figure 60: Europe Bio-based Polymers Market Volume (Million), by Country 2024 & 2032
- Figure 61: Europe Bio-based Polymers Market Revenue Share (%), by Country 2024 & 2032
- Figure 62: Europe Bio-based Polymers Market Volume Share (%), by Country 2024 & 2032
- Figure 63: Rest of World Bio-based Polymers Market Revenue (Million), by Type 2024 & 2032
- Figure 64: Rest of World Bio-based Polymers Market Volume (Million), by Type 2024 & 2032
- Figure 65: Rest of World Bio-based Polymers Market Revenue Share (%), by Type 2024 & 2032
- Figure 66: Rest of World Bio-based Polymers Market Volume Share (%), by Type 2024 & 2032
- Figure 67: Rest of World Bio-based Polymers Market Revenue (Million), by Application 2024 & 2032
- Figure 68: Rest of World Bio-based Polymers Market Volume (Million), by Application 2024 & 2032
- Figure 69: Rest of World Bio-based Polymers Market Revenue Share (%), by Application 2024 & 2032
- Figure 70: Rest of World Bio-based Polymers Market Volume Share (%), by Application 2024 & 2032
- Figure 71: Rest of World Bio-based Polymers Market Revenue (Million), by Country 2024 & 2032
- Figure 72: Rest of World Bio-based Polymers Market Volume (Million), by Country 2024 & 2032
- Figure 73: Rest of World Bio-based Polymers Market Revenue Share (%), by Country 2024 & 2032
- Figure 74: Rest of World Bio-based Polymers Market Volume Share (%), by Country 2024 & 2032
List of Tables
- Table 1: Global Bio-based Polymers Market Revenue Million Forecast, by Region 2019 & 2032
- Table 2: Global Bio-based Polymers Market Volume Million Forecast, by Region 2019 & 2032
- Table 3: Global Bio-based Polymers Market Revenue Million Forecast, by Type 2019 & 2032
- Table 4: Global Bio-based Polymers Market Volume Million Forecast, by Type 2019 & 2032
- Table 5: Global Bio-based Polymers Market Revenue Million Forecast, by Application 2019 & 2032
- Table 6: Global Bio-based Polymers Market Volume Million Forecast, by Application 2019 & 2032
- Table 7: Global Bio-based Polymers Market Revenue Million Forecast, by Region 2019 & 2032
- Table 8: Global Bio-based Polymers Market Volume Million Forecast, by Region 2019 & 2032
- Table 9: Global Bio-based Polymers Market Revenue Million Forecast, by Country 2019 & 2032
- Table 10: Global Bio-based Polymers Market Volume Million Forecast, by Country 2019 & 2032
- Table 11: United States Bio-based Polymers Market Revenue (Million) Forecast, by Application 2019 & 2032
- Table 12: United States Bio-based Polymers Market Volume (Million) Forecast, by Application 2019 & 2032
- Table 13: Canada Bio-based Polymers Market Revenue (Million) Forecast, by Application 2019 & 2032
- Table 14: Canada Bio-based Polymers Market Volume (Million) Forecast, by Application 2019 & 2032
- Table 15: Mexico Bio-based Polymers Market Revenue (Million) Forecast, by Application 2019 & 2032
- Table 16: Mexico Bio-based Polymers Market Volume (Million) Forecast, by Application 2019 & 2032
- Table 17: Global Bio-based Polymers Market Revenue Million Forecast, by Country 2019 & 2032
- Table 18: Global Bio-based Polymers Market Volume Million Forecast, by Country 2019 & 2032
- Table 19: Germany Bio-based Polymers Market Revenue (Million) Forecast, by Application 2019 & 2032
- Table 20: Germany Bio-based Polymers Market Volume (Million) Forecast, by Application 2019 & 2032
- Table 21: United Kingdom Bio-based Polymers Market Revenue (Million) Forecast, by Application 2019 & 2032
- Table 22: United Kingdom Bio-based Polymers Market Volume (Million) Forecast, by Application 2019 & 2032
- Table 23: France Bio-based Polymers Market Revenue (Million) Forecast, by Application 2019 & 2032
- Table 24: France Bio-based Polymers Market Volume (Million) Forecast, by Application 2019 & 2032
- Table 25: Spain Bio-based Polymers Market Revenue (Million) Forecast, by Application 2019 & 2032
- Table 26: Spain Bio-based Polymers Market Volume (Million) Forecast, by Application 2019 & 2032
- Table 27: Italy Bio-based Polymers Market Revenue (Million) Forecast, by Application 2019 & 2032
- Table 28: Italy Bio-based Polymers Market Volume (Million) Forecast, by Application 2019 & 2032
- Table 29: Spain Bio-based Polymers Market Revenue (Million) Forecast, by Application 2019 & 2032
- Table 30: Spain Bio-based Polymers Market Volume (Million) Forecast, by Application 2019 & 2032
- Table 31: Belgium Bio-based Polymers Market Revenue (Million) Forecast, by Application 2019 & 2032
- Table 32: Belgium Bio-based Polymers Market Volume (Million) Forecast, by Application 2019 & 2032
- Table 33: Netherland Bio-based Polymers Market Revenue (Million) Forecast, by Application 2019 & 2032
- Table 34: Netherland Bio-based Polymers Market Volume (Million) Forecast, by Application 2019 & 2032
- Table 35: Nordics Bio-based Polymers Market Revenue (Million) Forecast, by Application 2019 & 2032
- Table 36: Nordics Bio-based Polymers Market Volume (Million) Forecast, by Application 2019 & 2032
- Table 37: Rest of Europe Bio-based Polymers Market Revenue (Million) Forecast, by Application 2019 & 2032
- Table 38: Rest of Europe Bio-based Polymers Market Volume (Million) Forecast, by Application 2019 & 2032
- Table 39: Global Bio-based Polymers Market Revenue Million Forecast, by Country 2019 & 2032
- Table 40: Global Bio-based Polymers Market Volume Million Forecast, by Country 2019 & 2032
- Table 41: China Bio-based Polymers Market Revenue (Million) Forecast, by Application 2019 & 2032
- Table 42: China Bio-based Polymers Market Volume (Million) Forecast, by Application 2019 & 2032
- Table 43: Japan Bio-based Polymers Market Revenue (Million) Forecast, by Application 2019 & 2032
- Table 44: Japan Bio-based Polymers Market Volume (Million) Forecast, by Application 2019 & 2032
- Table 45: India Bio-based Polymers Market Revenue (Million) Forecast, by Application 2019 & 2032
- Table 46: India Bio-based Polymers Market Volume (Million) Forecast, by Application 2019 & 2032
- Table 47: South Korea Bio-based Polymers Market Revenue (Million) Forecast, by Application 2019 & 2032
- Table 48: South Korea Bio-based Polymers Market Volume (Million) Forecast, by Application 2019 & 2032
- Table 49: Southeast Asia Bio-based Polymers Market Revenue (Million) Forecast, by Application 2019 & 2032
- Table 50: Southeast Asia Bio-based Polymers Market Volume (Million) Forecast, by Application 2019 & 2032
- Table 51: Australia Bio-based Polymers Market Revenue (Million) Forecast, by Application 2019 & 2032
- Table 52: Australia Bio-based Polymers Market Volume (Million) Forecast, by Application 2019 & 2032
- Table 53: Indonesia Bio-based Polymers Market Revenue (Million) Forecast, by Application 2019 & 2032
- Table 54: Indonesia Bio-based Polymers Market Volume (Million) Forecast, by Application 2019 & 2032
- Table 55: Phillipes Bio-based Polymers Market Revenue (Million) Forecast, by Application 2019 & 2032
- Table 56: Phillipes Bio-based Polymers Market Volume (Million) Forecast, by Application 2019 & 2032
- Table 57: Singapore Bio-based Polymers Market Revenue (Million) Forecast, by Application 2019 & 2032
- Table 58: Singapore Bio-based Polymers Market Volume (Million) Forecast, by Application 2019 & 2032
- Table 59: Thailandc Bio-based Polymers Market Revenue (Million) Forecast, by Application 2019 & 2032
- Table 60: Thailandc Bio-based Polymers Market Volume (Million) Forecast, by Application 2019 & 2032
- Table 61: Rest of Asia Pacific Bio-based Polymers Market Revenue (Million) Forecast, by Application 2019 & 2032
- Table 62: Rest of Asia Pacific Bio-based Polymers Market Volume (Million) Forecast, by Application 2019 & 2032
- Table 63: Global Bio-based Polymers Market Revenue Million Forecast, by Country 2019 & 2032
- Table 64: Global Bio-based Polymers Market Volume Million Forecast, by Country 2019 & 2032
- Table 65: Brazil Bio-based Polymers Market Revenue (Million) Forecast, by Application 2019 & 2032
- Table 66: Brazil Bio-based Polymers Market Volume (Million) Forecast, by Application 2019 & 2032
- Table 67: Argentina Bio-based Polymers Market Revenue (Million) Forecast, by Application 2019 & 2032
- Table 68: Argentina Bio-based Polymers Market Volume (Million) Forecast, by Application 2019 & 2032
- Table 69: Peru Bio-based Polymers Market Revenue (Million) Forecast, by Application 2019 & 2032
- Table 70: Peru Bio-based Polymers Market Volume (Million) Forecast, by Application 2019 & 2032
- Table 71: Chile Bio-based Polymers Market Revenue (Million) Forecast, by Application 2019 & 2032
- Table 72: Chile Bio-based Polymers Market Volume (Million) Forecast, by Application 2019 & 2032
- Table 73: Colombia Bio-based Polymers Market Revenue (Million) Forecast, by Application 2019 & 2032
- Table 74: Colombia Bio-based Polymers Market Volume (Million) Forecast, by Application 2019 & 2032
- Table 75: Ecuador Bio-based Polymers Market Revenue (Million) Forecast, by Application 2019 & 2032
- Table 76: Ecuador Bio-based Polymers Market Volume (Million) Forecast, by Application 2019 & 2032
- Table 77: Venezuela Bio-based Polymers Market Revenue (Million) Forecast, by Application 2019 & 2032
- Table 78: Venezuela Bio-based Polymers Market Volume (Million) Forecast, by Application 2019 & 2032
- Table 79: Rest of South America Bio-based Polymers Market Revenue (Million) Forecast, by Application 2019 & 2032
- Table 80: Rest of South America Bio-based Polymers Market Volume (Million) Forecast, by Application 2019 & 2032
- Table 81: Global Bio-based Polymers Market Revenue Million Forecast, by Country 2019 & 2032
- Table 82: Global Bio-based Polymers Market Volume Million Forecast, by Country 2019 & 2032
- Table 83: United States Bio-based Polymers Market Revenue (Million) Forecast, by Application 2019 & 2032
- Table 84: United States Bio-based Polymers Market Volume (Million) Forecast, by Application 2019 & 2032
- Table 85: Canada Bio-based Polymers Market Revenue (Million) Forecast, by Application 2019 & 2032
- Table 86: Canada Bio-based Polymers Market Volume (Million) Forecast, by Application 2019 & 2032
- Table 87: Mexico Bio-based Polymers Market Revenue (Million) Forecast, by Application 2019 & 2032
- Table 88: Mexico Bio-based Polymers Market Volume (Million) Forecast, by Application 2019 & 2032
- Table 89: Global Bio-based Polymers Market Revenue Million Forecast, by Country 2019 & 2032
- Table 90: Global Bio-based Polymers Market Volume Million Forecast, by Country 2019 & 2032
- Table 91: United Arab Emirates Bio-based Polymers Market Revenue (Million) Forecast, by Application 2019 & 2032
- Table 92: United Arab Emirates Bio-based Polymers Market Volume (Million) Forecast, by Application 2019 & 2032
- Table 93: Saudi Arabia Bio-based Polymers Market Revenue (Million) Forecast, by Application 2019 & 2032
- Table 94: Saudi Arabia Bio-based Polymers Market Volume (Million) Forecast, by Application 2019 & 2032
- Table 95: South Africa Bio-based Polymers Market Revenue (Million) Forecast, by Application 2019 & 2032
- Table 96: South Africa Bio-based Polymers Market Volume (Million) Forecast, by Application 2019 & 2032
- Table 97: Rest of Middle East and Africa Bio-based Polymers Market Revenue (Million) Forecast, by Application 2019 & 2032
- Table 98: Rest of Middle East and Africa Bio-based Polymers Market Volume (Million) Forecast, by Application 2019 & 2032
- Table 99: Global Bio-based Polymers Market Revenue Million Forecast, by Type 2019 & 2032
- Table 100: Global Bio-based Polymers Market Volume Million Forecast, by Type 2019 & 2032
- Table 101: Global Bio-based Polymers Market Revenue Million Forecast, by Application 2019 & 2032
- Table 102: Global Bio-based Polymers Market Volume Million Forecast, by Application 2019 & 2032
- Table 103: Global Bio-based Polymers Market Revenue Million Forecast, by Country 2019 & 2032
- Table 104: Global Bio-based Polymers Market Volume Million Forecast, by Country 2019 & 2032
- Table 105: China Bio-based Polymers Market Revenue (Million) Forecast, by Application 2019 & 2032
- Table 106: China Bio-based Polymers Market Volume (Million) Forecast, by Application 2019 & 2032
- Table 107: India Bio-based Polymers Market Revenue (Million) Forecast, by Application 2019 & 2032
- Table 108: India Bio-based Polymers Market Volume (Million) Forecast, by Application 2019 & 2032
- Table 109: Japan Bio-based Polymers Market Revenue (Million) Forecast, by Application 2019 & 2032
- Table 110: Japan Bio-based Polymers Market Volume (Million) Forecast, by Application 2019 & 2032
- Table 111: South Korea Bio-based Polymers Market Revenue (Million) Forecast, by Application 2019 & 2032
- Table 112: South Korea Bio-based Polymers Market Volume (Million) Forecast, by Application 2019 & 2032
- Table 113: Rest of Asia Pacific Bio-based Polymers Market Revenue (Million) Forecast, by Application 2019 & 2032
- Table 114: Rest of Asia Pacific Bio-based Polymers Market Volume (Million) Forecast, by Application 2019 & 2032
- Table 115: Global Bio-based Polymers Market Revenue Million Forecast, by Type 2019 & 2032
- Table 116: Global Bio-based Polymers Market Volume Million Forecast, by Type 2019 & 2032
- Table 117: Global Bio-based Polymers Market Revenue Million Forecast, by Application 2019 & 2032
- Table 118: Global Bio-based Polymers Market Volume Million Forecast, by Application 2019 & 2032
- Table 119: Global Bio-based Polymers Market Revenue Million Forecast, by Country 2019 & 2032
- Table 120: Global Bio-based Polymers Market Volume Million Forecast, by Country 2019 & 2032
- Table 121: United States Bio-based Polymers Market Revenue (Million) Forecast, by Application 2019 & 2032
- Table 122: United States Bio-based Polymers Market Volume (Million) Forecast, by Application 2019 & 2032
- Table 123: Canada Bio-based Polymers Market Revenue (Million) Forecast, by Application 2019 & 2032
- Table 124: Canada Bio-based Polymers Market Volume (Million) Forecast, by Application 2019 & 2032
- Table 125: Mexico Bio-based Polymers Market Revenue (Million) Forecast, by Application 2019 & 2032
- Table 126: Mexico Bio-based Polymers Market Volume (Million) Forecast, by Application 2019 & 2032
- Table 127: Global Bio-based Polymers Market Revenue Million Forecast, by Type 2019 & 2032
- Table 128: Global Bio-based Polymers Market Volume Million Forecast, by Type 2019 & 2032
- Table 129: Global Bio-based Polymers Market Revenue Million Forecast, by Application 2019 & 2032
- Table 130: Global Bio-based Polymers Market Volume Million Forecast, by Application 2019 & 2032
- Table 131: Global Bio-based Polymers Market Revenue Million Forecast, by Country 2019 & 2032
- Table 132: Global Bio-based Polymers Market Volume Million Forecast, by Country 2019 & 2032
- Table 133: Germany Bio-based Polymers Market Revenue (Million) Forecast, by Application 2019 & 2032
- Table 134: Germany Bio-based Polymers Market Volume (Million) Forecast, by Application 2019 & 2032
- Table 135: United Kingdom Bio-based Polymers Market Revenue (Million) Forecast, by Application 2019 & 2032
- Table 136: United Kingdom Bio-based Polymers Market Volume (Million) Forecast, by Application 2019 & 2032
- Table 137: Italy Bio-based Polymers Market Revenue (Million) Forecast, by Application 2019 & 2032
- Table 138: Italy Bio-based Polymers Market Volume (Million) Forecast, by Application 2019 & 2032
- Table 139: France Bio-based Polymers Market Revenue (Million) Forecast, by Application 2019 & 2032
- Table 140: France Bio-based Polymers Market Volume (Million) Forecast, by Application 2019 & 2032
- Table 141: Rest of Europe Bio-based Polymers Market Revenue (Million) Forecast, by Application 2019 & 2032
- Table 142: Rest of Europe Bio-based Polymers Market Volume (Million) Forecast, by Application 2019 & 2032
- Table 143: Global Bio-based Polymers Market Revenue Million Forecast, by Type 2019 & 2032
- Table 144: Global Bio-based Polymers Market Volume Million Forecast, by Type 2019 & 2032
- Table 145: Global Bio-based Polymers Market Revenue Million Forecast, by Application 2019 & 2032
- Table 146: Global Bio-based Polymers Market Volume Million Forecast, by Application 2019 & 2032
- Table 147: Global Bio-based Polymers Market Revenue Million Forecast, by Country 2019 & 2032
- Table 148: Global Bio-based Polymers Market Volume Million Forecast, by Country 2019 & 2032
- Table 149: Brazil Bio-based Polymers Market Revenue (Million) Forecast, by Application 2019 & 2032
- Table 150: Brazil Bio-based Polymers Market Volume (Million) Forecast, by Application 2019 & 2032
- Table 151: Saudi Arabia Bio-based Polymers Market Revenue (Million) Forecast, by Application 2019 & 2032
- Table 152: Saudi Arabia Bio-based Polymers Market Volume (Million) Forecast, by Application 2019 & 2032
- Table 153: Rest of the World Bio-based Polymers Market Revenue (Million) Forecast, by Application 2019 & 2032
- Table 154: Rest of the World Bio-based Polymers Market Volume (Million) Forecast, by Application 2019 & 2032
Frequently Asked Questions
1. What is the projected Compound Annual Growth Rate (CAGR) of the Bio-based Polymers Market?
The projected CAGR is approximately 24.30%.
2. Which companies are prominent players in the Bio-based Polymers Market?
Key companies in the market include Novamont SpA, FP International, Innovia Films, YIELD10 BIOSCIENCE INC (Metabolix Inc ), FKuR, Merck KGaA, Cardia Bioplastics, Rodenburg Biopolymers, Covestro AG, NatureWorks LLC, thyssenkrupp AG*List Not Exhaustive, DuPont de Nemours Inc, Biologische Naturverpackungen GmbH & Co KG, Corbion, Cortec Group Management Services LLC, SHOWA DENKO K K, BASF SE.
3. What are the main segments of the Bio-based Polymers Market?
The market segments include Type, Application.
4. Can you provide details about the market size?
The market size is estimated to be USD XX Million as of 2022.
5. What are some drivers contributing to market growth?
Preference toward Eco-friendly Polymers to Preserve Environment; Regulation on Non-degradable Polymers in Many Countries; Increasing Consumer Awareness in Developed and Developing Nations; Non-toxic Nature of Biodegradable Polymers.
6. What are the notable trends driving market growth?
Increasing Demand from Packaging Industry.
7. Are there any restraints impacting market growth?
Higher Price Compared to Petroleum-based polymers; Low Awareness in Low Income Countries.
8. Can you provide examples of recent developments in the market?
N/A
9. What pricing options are available for accessing the report?
Pricing options include single-user, multi-user, and enterprise licenses priced at USD 4750, USD 5250, and USD 8750 respectively.
10. Is the market size provided in terms of value or volume?
The market size is provided in terms of value, measured in Million and volume, measured in Million.
11. Are there any specific market keywords associated with the report?
Yes, the market keyword associated with the report is "Bio-based Polymers Market," which aids in identifying and referencing the specific market segment covered.
12. How do I determine which pricing option suits my needs best?
The pricing options vary based on user requirements and access needs. Individual users may opt for single-user licenses, while businesses requiring broader access may choose multi-user or enterprise licenses for cost-effective access to the report.
13. Are there any additional resources or data provided in the Bio-based Polymers Market report?
While the report offers comprehensive insights, it's advisable to review the specific contents or supplementary materials provided to ascertain if additional resources or data are available.
14. How can I stay updated on further developments or reports in the Bio-based Polymers Market?
To stay informed about further developments, trends, and reports in the Bio-based Polymers Market, consider subscribing to industry newsletters, following relevant companies and organizations, or regularly checking reputable industry news sources and publications.
Methodology
Step 1 - Identification of Relevant Samples Size from Population Database


Step 2 - Approaches for Defining Global Market Size (Value, Volume* & Price*)

Note*: In applicable scenarios
Step 3 - Data Sources
Primary Research
- Web Analytics
- Survey Reports
- Research Institute
- Latest Research Reports
- Opinion Leaders
Secondary Research
- Annual Reports
- White Paper
- Latest Press Release
- Industry Association
- Paid Database
- Investor Presentations

Step 4 - Data Triangulation
Involves using different sources of information in order to increase the validity of a study
These sources are likely to be stakeholders in a program - participants, other researchers, program staff, other community members, and so on.
Then we put all data in single framework & apply various statistical tools to find out the dynamic on the market.
During the analysis stage, feedback from the stakeholder groups would be compared to determine areas of agreement as well as areas of divergence


