Key Insights
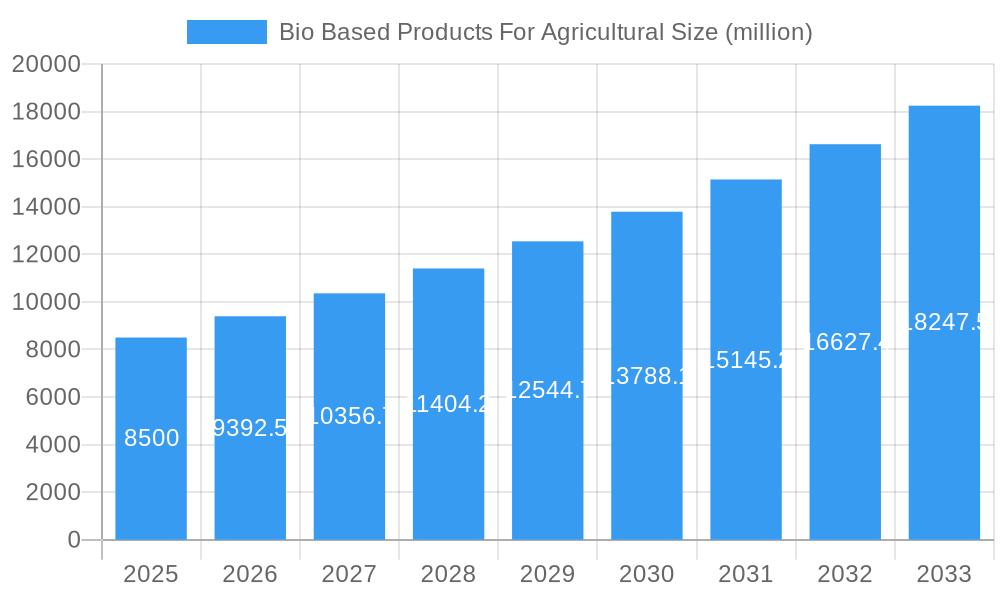
The Bio-Based Products for Agriculture market is poised for significant expansion, driven by a growing global emphasis on sustainable farming practices and the increasing demand for eco-friendly agricultural solutions. With an estimated market size of USD 8,500 million in 2025, the sector is projected to experience a robust Compound Annual Growth Rate (CAGR) of 10.5% over the forecast period of 2025-2033. This growth is primarily fueled by the crucial roles these products play in fertilization and plant growth stimulation, contributing to enhanced crop yields and improved soil health. The agricultural industry's shift away from synthetic inputs towards biological alternatives for pest and disease management, embodied by the biological control segment, further underpins this positive market trajectory. Consumer awareness regarding the environmental impact of conventional agriculture and governmental initiatives promoting organic farming are also key accelerators.
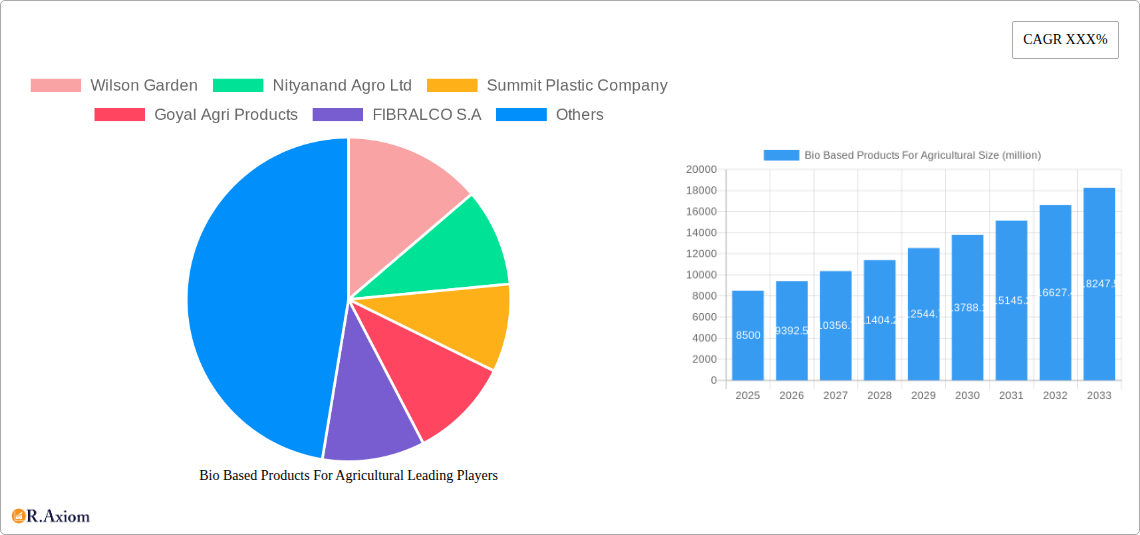
Bio Based Products For Agricultural Market Size (In Billion)
Further analysis reveals that the market is segmented by application into Fertilization, Plant Growth Stimulation, and Biological Control, with Fertilization and Plant Growth Stimulation expected to dominate revenue streams due to their widespread adoption. By type, Seed Trays, Mulches, and Geotextiles are the primary product categories. Geotextiles, in particular, are witnessing increasing adoption for erosion control and soil stabilization, aligning with the broader trend of sustainable land management. The market is characterized by the presence of both established global players and emerging regional companies, indicating a competitive landscape. Geographically, Asia Pacific, led by China and India, is anticipated to be a high-growth region, owing to its large agricultural base and increasing investments in modern agricultural technologies. North America and Europe are mature markets with a strong existing demand for bio-based solutions.
Bio Based Products For Agricultural Company Market Share
Bio Based Products For Agricultural Market Concentration & Innovation
The global bio-based products for agriculture market exhibits a moderately concentrated landscape, characterized by a blend of established multinational corporations and a growing number of innovative small and medium-sized enterprises (SMEs). Market concentration is influenced by the significant R&D investments required for developing and scaling sustainable agricultural solutions. Innovation is primarily driven by the increasing demand for eco-friendly alternatives to conventional synthetic inputs, fueled by growing environmental consciousness among farmers and consumers, and stringent regulatory pressures worldwide.
Key innovation drivers include advancements in biotechnology for developing novel bio-fertilizers, bio-pesticides, and biodegradable agricultural materials. The development of advanced biopolymers for mulches and seed trays, alongside the enhanced efficacy of bio-control agents, are also critical. Regulatory frameworks are increasingly favoring bio-based solutions through subsidies, tax incentives, and stricter regulations on chemical inputs, thereby creating a more conducive environment for market growth. Product substitutes, while present in the form of conventional chemicals, are facing increasing scrutiny, pushing demand towards bio-based alternatives. End-user trends show a strong preference for sustainably produced food, leading farmers to adopt bio-based products for improved soil health, reduced environmental impact, and enhanced crop yields. Mergers and acquisitions (M&A) activities, while not at an extremely high volume, are strategically aimed at consolidating market share, acquiring innovative technologies, and expanding product portfolios. For instance, M&A deals in the last five years have ranged from xx million to xx million, indicating strategic consolidation efforts within the sector.
Bio Based Products For Agricultural Industry Trends & Insights
The bio-based products for agriculture market is experiencing robust growth, projected to achieve a Compound Annual Growth Rate (CAGR) of approximately xx% during the forecast period of 2025–2033. This upward trajectory is underpinned by a confluence of compelling industry trends and evolving market dynamics. A primary growth driver is the escalating global demand for sustainable food production systems. As environmental concerns intensify, particularly regarding soil degradation, water pollution, and the long-term health impacts of synthetic agrochemicals, there is a significant shift towards adopting eco-friendly alternatives. Bio-based products, ranging from bio-fertilizers that enhance soil fertility naturally to biodegradable mulches that reduce plastic waste, are at the forefront of this transition.
Technological disruptions are playing a pivotal role in shaping the market. Advances in microbial technology have led to the development of more potent and targeted bio-fertilizers and bio-pesticides, offering enhanced efficacy and reduced environmental footprints. Innovations in material science are yielding biodegradable and compostable alternatives for traditional plastic-based agricultural products like seed trays and mulches. Furthermore, the integration of digital agriculture solutions, such as precision farming and data analytics, is enabling more efficient application and monitoring of bio-based inputs, thereby optimizing their performance and adoption rates. Consumer preferences are a powerful catalyst, with a growing segment of the population actively seeking out food produced using sustainable and organic methods. This demand percolates down to agricultural practices, compelling farmers to invest in bio-based products to meet market expectations and gain a competitive edge. The "clean label" movement further amplifies this trend, pushing for transparency and reduced chemical residue in food products.
The competitive landscape is dynamic, marked by increasing R&D investments from both established players and emerging startups. Companies are focusing on developing differentiated product offerings, optimizing production processes for cost-effectiveness, and building strong distribution networks to reach a wider farming community. Strategic collaborations, partnerships, and acquisitions are becoming common strategies to gain access to new technologies, markets, and customer bases. Market penetration of bio-based products is steadily increasing, especially in regions with strong policy support for sustainable agriculture and high consumer awareness. However, challenges such as the initial cost of some bio-based products compared to conventional ones, farmer education and adoption hurdles, and the need for consistent product quality and efficacy remain areas that require continuous attention and innovation. The industry is also witnessing a rise in bio-based solutions for plant growth stimulation, offering natural alternatives to synthetic growth hormones, and for biological control, providing eco-friendly pest and disease management strategies.
Dominant Markets & Segments in Bio Based Products For Agricultural
The global bio-based products for agriculture market is experiencing significant growth, with a notable dominance observed in specific regions and segments. Among the various applications, Fertilization stands out as a dominant segment. This is primarily driven by the increasing awareness of soil health and the detrimental long-term effects of synthetic fertilizers. Bio-fertilizers, derived from microorganisms, organic matter, and plant extracts, offer a sustainable approach to nutrient replenishment, improving soil structure, enhancing water retention, and reducing greenhouse gas emissions. The economic policies in many developed and developing nations are actively promoting the use of organic and bio-fertilizers through subsidies and tax incentives, further bolstering this segment. For instance, European Union policies under the "Farm to Fork" strategy aim to increase the uptake of organic farming practices, which directly benefits the bio-fertilizer market.
In terms of Type, Mulches represent another highly influential segment. Biodegradable and compostable mulches made from materials like corn starch, sugarcane, and recycled paper are gaining immense traction. These alternatives to conventional plastic mulches significantly reduce agricultural waste and pollution, addressing critical environmental concerns. The rising demand for sustainable packaging and single-use plastic alternatives is indirectly fueling innovation and adoption of bio-mulches. Infrastructure development in agriculture, including advancements in irrigation systems that can be integrated with biodegradable mulches, also contributes to their dominance.
Geographically, Europe is emerging as a dominant market for bio-based products in agriculture. This leadership is attributable to stringent environmental regulations, strong government support for sustainable farming practices, and a highly informed consumer base that actively seeks out organic and eco-friendly produce. The region's robust research and development ecosystem, coupled with a high level of farmer adoption of new technologies, further solidifies its position. Countries like Germany, France, and the Netherlands are at the forefront of this trend, investing heavily in bio-based agricultural innovations.
The Application of Plant Growth Stimulation is also witnessing substantial growth. Bio-stimulants, which enhance nutrient uptake, improve stress tolerance, and promote healthy plant development, are becoming increasingly popular among farmers looking for natural ways to boost crop yields and quality. The economic viability of these products, offering improved crop performance without the environmental drawbacks of synthetic growth regulators, is a key driver.
The Type of Geotextiles derived from natural fibers like jute, coir, and hemp is also gaining prominence, particularly in erosion control and soil stabilization applications. These natural geotextiles offer a sustainable alternative to synthetic ones, biodegrading over time and contributing to soil health.
Biological Control as an application is also a significant growth area, with bio-pesticides and bio-insecticides offering targeted pest and disease management solutions with minimal impact on beneficial insects and the environment. The growing consumer preference for pesticide-free produce is a major impetus for this segment.
Bio Based Products For Agricultural Product Developments
Product innovations in bio-based products for agriculture are rapidly advancing, focusing on enhancing efficacy, sustainability, and ease of use. Developments include novel bio-fertilizers with targeted nutrient delivery systems and enhanced microbial activity for improved soil health. Biodegradable mulches made from advanced biopolymers are being engineered for controlled degradation rates, aligning with crop cycles and minimizing environmental persistence. Seed trays are evolving towards fully compostable materials, reducing waste from nurseries. Furthermore, bio-stimulants are being formulated with synergistic blends of natural compounds for superior plant growth and stress resilience. These developments are driven by the demand for eco-friendly alternatives that offer comparable or superior performance to conventional products, while also addressing regulatory pressures and consumer preferences for sustainable agriculture.
Report Scope & Segmentation Analysis
This report meticulously analyzes the global bio-based products for agriculture market, encompassing detailed segmentation across key applications and product types. The Fertilization segment, projected to reach xx million by 2033 with a CAGR of xx%, focuses on bio-fertilizers and soil amendments that enhance nutrient availability and soil health. The Plant Growth Stimulation segment, estimated at xx million by 2033 with a CAGR of xx%, examines bio-stimulants that improve crop vigor, stress tolerance, and yield. The Biological Control segment, expected to grow to xx million by 2033 with a CAGR of xx%, covers bio-pesticides and bio-agents for natural pest and disease management.
In terms of product types, the Seed Trays segment, valued at xx million in 2033 with a CAGR of xx%, explores biodegradable and compostable alternatives to traditional plastic trays. The Mulches segment, forecast to reach xx million by 2033 with a CAGR of xx%, analyzes biodegradable and organic mulching materials that suppress weeds and conserve moisture. The Geotextiles segment, projected at xx million by 2033 with a CAGR of xx%, covers natural fiber-based geotextiles used for soil stabilization and erosion control. Each segment is analyzed for its market size, growth projections, key drivers, and competitive dynamics.
Key Drivers of Bio Based Products For Agricultural Growth
Several pivotal factors are propelling the growth of the bio-based products for agriculture sector. Technologically, advancements in biotechnology and material science are enabling the development of more effective and sustainable bio-inputs, such as enhanced bio-fertilizers and biodegradable mulches. Economically, increasing consumer demand for organic and sustainably produced food is creating a premium market for agricultural products grown using bio-based methods, thereby incentivizing farmers to adopt these solutions. Furthermore, supportive government policies, including subsidies for organic farming, tax incentives for adopting sustainable practices, and stringent regulations on synthetic chemical inputs, are creating a favorable regulatory environment for bio-based products. For example, the EU's "Green Deal" and "Farm to Fork" strategy are directly promoting the adoption of bio-based solutions.
Challenges in the Bio Based Products For Agricultural Sector
Despite the promising growth, the bio-based products for agricultural sector faces several significant challenges. Regulatory hurdles persist, with the approval processes for new bio-based products sometimes being complex and lengthy compared to established synthetic counterparts. Supply chain issues, including the availability of raw materials for bio-based product manufacturing and ensuring consistent product quality and shelf-life, can also pose limitations. Competitive pressures from established and often lower-cost conventional agrochemicals remain a barrier to widespread adoption. Furthermore, educating farmers about the benefits and proper application of bio-based products is crucial, as a lack of awareness or perceived risk can hinder their uptake. The initial investment cost for some bio-based products can also be higher, presenting a challenge for price-sensitive farmers.
Emerging Opportunities in Bio Based Products For Agricultural
The bio-based products for agriculture sector is ripe with emerging opportunities. The growing global emphasis on a circular economy and waste reduction presents a significant avenue for biodegradable agricultural materials, including mulches and packaging solutions. Advancements in precision agriculture and smart farming technologies are enabling more targeted and efficient application of bio-based products, optimizing their performance and cost-effectiveness. The increasing consumer demand for healthier, pesticide-free food is a powerful market pull, driving innovation in bio-pesticides and organic fertilizers. Furthermore, the development of novel bio-stimulants and bio-control agents with enhanced efficacy and broader spectrum activity is opening up new application areas and markets. Exploring untapped geographical markets with a growing interest in sustainable agriculture also presents a substantial growth potential.
Leading Players in the Bio Based Products For Agricultural Market
- Wilson Garden
- Nityanand Agro Ltd
- Summit Plastic Company
- Goyal Agri Products
- FIBRALCO S.A
- NET YAPI MALZ
- GRUPO CRIADO Y LOPEZ.
- ECO-VTOR
- NAUE GEOSYNTHETICS
- ISTANBUL TEKNIK INSAAT MUHENDISLIK SANAYI LTD.
- SHRI AMBICA POLYMER PVT
- TENSAR INTERNATIONAL GMBH
Key Developments in Bio Based Products For Agricultural Industry
- 2023: Launch of new generation of biodegradable mulches with enhanced UV resistance and controlled degradation rates.
- 2023: Increased investment in R&D for microbial bio-fertilizers with specific nutrient-fixing capabilities.
- 2022: Significant mergers and acquisitions focusing on companies with strong expertise in biopolymer technology for agricultural applications.
- 2022: Introduction of novel bio-stimulant formulations combining multiple plant growth-promoting compounds.
- 2021: Expansion of production capacity for naturally derived geotextiles to meet growing demand for sustainable erosion control.
- 2020: Development of advanced bio-pesticides offering broader spectrum control against key agricultural pests.
- 2019: Growing focus on circular economy initiatives, leading to the development of agricultural products from recycled organic waste.
Strategic Outlook for Bio Based Products For Agricultural Market
The strategic outlook for the bio-based products for agriculture market remains exceptionally positive, driven by the confluence of sustainability imperatives, technological advancements, and evolving consumer preferences. The increasing global focus on environmental protection and food security will continue to fuel the demand for eco-friendly agricultural inputs. Companies that invest in cutting-edge research and development, focusing on improving the efficacy and cost-competitiveness of bio-based solutions, will be well-positioned for growth. Strategic partnerships and collaborations across the value chain, from raw material suppliers to end-users, will be crucial for market expansion and innovation. Furthermore, actively engaging with policymakers to advocate for supportive regulatory frameworks will be instrumental in accelerating market penetration. The future will likely see a greater integration of bio-based products with digital agriculture platforms, creating synergistic solutions for a more sustainable and productive agricultural future.
Bio Based Products For Agricultural Segmentation
-
1. Application
- 1.1. Fertilization
- 1.2. Plant Growth Stimulation
- 1.3. Biological Control
-
2. Type
- 2.1. Seed Trays
- 2.2. Multches
- 2.3. Geotextiles
Bio Based Products For Agricultural Segmentation By Geography
-
1. North America
- 1.1. United States
- 1.2. Canada
- 1.3. Mexico
-
2. South America
- 2.1. Brazil
- 2.2. Argentina
- 2.3. Rest of South America
-
3. Europe
- 3.1. United Kingdom
- 3.2. Germany
- 3.3. France
- 3.4. Italy
- 3.5. Spain
- 3.6. Russia
- 3.7. Benelux
- 3.8. Nordics
- 3.9. Rest of Europe
-
4. Middle East & Africa
- 4.1. Turkey
- 4.2. Israel
- 4.3. GCC
- 4.4. North Africa
- 4.5. South Africa
- 4.6. Rest of Middle East & Africa
-
5. Asia Pacific
- 5.1. China
- 5.2. India
- 5.3. Japan
- 5.4. South Korea
- 5.5. ASEAN
- 5.6. Oceania
- 5.7. Rest of Asia Pacific
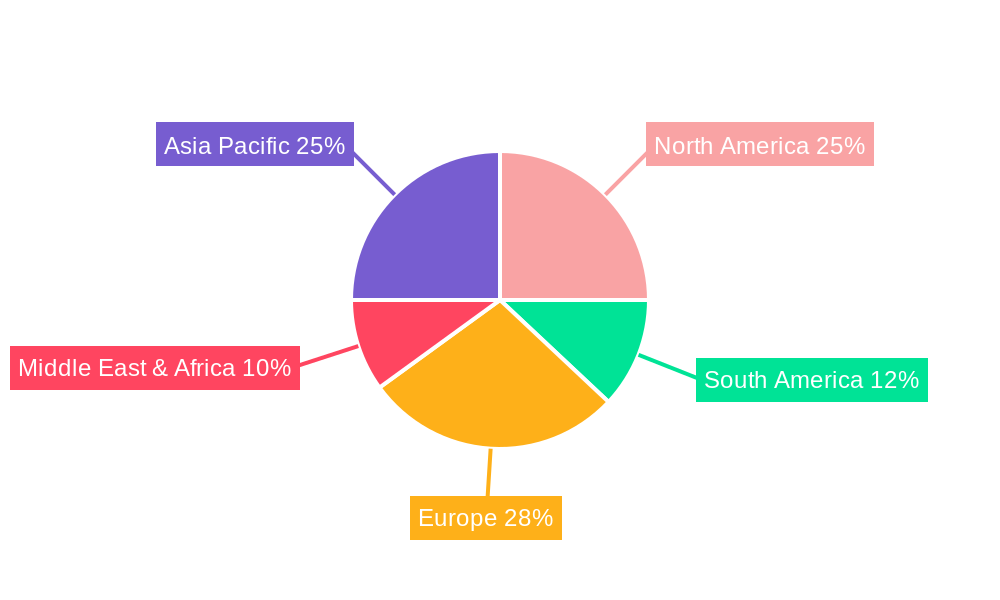
Bio Based Products For Agricultural Regional Market Share
Geographic Coverage of Bio Based Products For Agricultural
Bio Based Products For Agricultural REPORT HIGHLIGHTS
| Aspects | Details |
|---|---|
| Study Period | 2020-2034 |
| Base Year | 2025 |
| Estimated Year | 2026 |
| Forecast Period | 2026-2034 |
| Historical Period | 2020-2025 |
| Growth Rate | CAGR of XXX% from 2020-2034 |
| Segmentation |
|
Table of Contents
- 1. Introduction
- 1.1. Research Scope
- 1.2. Market Segmentation
- 1.3. Research Objective
- 1.4. Definitions and Assumptions
- 2. Executive Summary
- 2.1. Market Snapshot
- 3. Market Dynamics
- 3.1. Market Drivers
- 3.2. Market Restrains
- 3.3. Market Trends
- 3.4. Market Opportunities
- 4. Market Factor Analysis
- 4.1. Porters Five Forces
- 4.1.1. Bargaining Power of Suppliers
- 4.1.2. Bargaining Power of Buyers
- 4.1.3. Threat of New Entrants
- 4.1.4. Threat of Substitutes
- 4.1.5. Competitive Rivalry
- 4.2. PESTEL analysis
- 4.3. BCG Analysis
- 4.3.1. Stars (High Growth, High Market Share)
- 4.3.2. Cash Cows (Low Growth, High Market Share)
- 4.3.3. Question Mark (High Growth, Low Market Share)
- 4.3.4. Dogs (Low Growth, Low Market Share)
- 4.4. Ansoff Matrix Analysis
- 4.5. Supply Chain Analysis
- 4.6. Regulatory Landscape
- 4.7. Current Market Potential and Opportunity Assessment (TAM–SAM–SOM Framework)
- 4.8. RAX Analyst Note
- 4.1. Porters Five Forces
- 5. Market Analysis, Insights and Forecast 2021-2033
- 5.1. Market Analysis, Insights and Forecast - by Application
- 5.1.1. Fertilization
- 5.1.2. Plant Growth Stimulation
- 5.1.3. Biological Control
- 5.2. Market Analysis, Insights and Forecast - by Type
- 5.2.1. Seed Trays
- 5.2.2. Multches
- 5.2.3. Geotextiles
- 5.3. Market Analysis, Insights and Forecast - by Region
- 5.3.1. North America
- 5.3.2. South America
- 5.3.3. Europe
- 5.3.4. Middle East & Africa
- 5.3.5. Asia Pacific
- 5.1. Market Analysis, Insights and Forecast - by Application
- 6. Global Bio Based Products For Agricultural Analysis, Insights and Forecast, 2021-2033
- 6.1. Market Analysis, Insights and Forecast - by Application
- 6.1.1. Fertilization
- 6.1.2. Plant Growth Stimulation
- 6.1.3. Biological Control
- 6.2. Market Analysis, Insights and Forecast - by Type
- 6.2.1. Seed Trays
- 6.2.2. Multches
- 6.2.3. Geotextiles
- 6.1. Market Analysis, Insights and Forecast - by Application
- 7. North America Bio Based Products For Agricultural Analysis, Insights and Forecast, 2020-2032
- 7.1. Market Analysis, Insights and Forecast - by Application
- 7.1.1. Fertilization
- 7.1.2. Plant Growth Stimulation
- 7.1.3. Biological Control
- 7.2. Market Analysis, Insights and Forecast - by Type
- 7.2.1. Seed Trays
- 7.2.2. Multches
- 7.2.3. Geotextiles
- 7.1. Market Analysis, Insights and Forecast - by Application
- 8. South America Bio Based Products For Agricultural Analysis, Insights and Forecast, 2020-2032
- 8.1. Market Analysis, Insights and Forecast - by Application
- 8.1.1. Fertilization
- 8.1.2. Plant Growth Stimulation
- 8.1.3. Biological Control
- 8.2. Market Analysis, Insights and Forecast - by Type
- 8.2.1. Seed Trays
- 8.2.2. Multches
- 8.2.3. Geotextiles
- 8.1. Market Analysis, Insights and Forecast - by Application
- 9. Europe Bio Based Products For Agricultural Analysis, Insights and Forecast, 2020-2032
- 9.1. Market Analysis, Insights and Forecast - by Application
- 9.1.1. Fertilization
- 9.1.2. Plant Growth Stimulation
- 9.1.3. Biological Control
- 9.2. Market Analysis, Insights and Forecast - by Type
- 9.2.1. Seed Trays
- 9.2.2. Multches
- 9.2.3. Geotextiles
- 9.1. Market Analysis, Insights and Forecast - by Application
- 10. Middle East & Africa Bio Based Products For Agricultural Analysis, Insights and Forecast, 2020-2032
- 10.1. Market Analysis, Insights and Forecast - by Application
- 10.1.1. Fertilization
- 10.1.2. Plant Growth Stimulation
- 10.1.3. Biological Control
- 10.2. Market Analysis, Insights and Forecast - by Type
- 10.2.1. Seed Trays
- 10.2.2. Multches
- 10.2.3. Geotextiles
- 10.1. Market Analysis, Insights and Forecast - by Application
- 11. Asia Pacific Bio Based Products For Agricultural Analysis, Insights and Forecast, 2020-2032
- 11.1. Market Analysis, Insights and Forecast - by Application
- 11.1.1. Fertilization
- 11.1.2. Plant Growth Stimulation
- 11.1.3. Biological Control
- 11.2. Market Analysis, Insights and Forecast - by Type
- 11.2.1. Seed Trays
- 11.2.2. Multches
- 11.2.3. Geotextiles
- 11.1. Market Analysis, Insights and Forecast - by Application
- 12. Competitive Analysis
- 12.1. Company Profiles
- 12.1.1 Wilson Garden
- 12.1.1.1. Company Overview
- 12.1.1.2. Products
- 12.1.1.3. Company Financials
- 12.1.1.4. SWOT Analysis
- 12.1.2 Nityanand Agro Ltd
- 12.1.2.1. Company Overview
- 12.1.2.2. Products
- 12.1.2.3. Company Financials
- 12.1.2.4. SWOT Analysis
- 12.1.3 Summit Plastic Company
- 12.1.3.1. Company Overview
- 12.1.3.2. Products
- 12.1.3.3. Company Financials
- 12.1.3.4. SWOT Analysis
- 12.1.4 Goyal Agri Products
- 12.1.4.1. Company Overview
- 12.1.4.2. Products
- 12.1.4.3. Company Financials
- 12.1.4.4. SWOT Analysis
- 12.1.5 FIBRALCO S.A
- 12.1.5.1. Company Overview
- 12.1.5.2. Products
- 12.1.5.3. Company Financials
- 12.1.5.4. SWOT Analysis
- 12.1.6 NET YAPI MALZ
- 12.1.6.1. Company Overview
- 12.1.6.2. Products
- 12.1.6.3. Company Financials
- 12.1.6.4. SWOT Analysis
- 12.1.7 GRUPO CRIADO Y LOPEZ.
- 12.1.7.1. Company Overview
- 12.1.7.2. Products
- 12.1.7.3. Company Financials
- 12.1.7.4. SWOT Analysis
- 12.1.8 ECO-VTOR
- 12.1.8.1. Company Overview
- 12.1.8.2. Products
- 12.1.8.3. Company Financials
- 12.1.8.4. SWOT Analysis
- 12.1.9 NAUE GEOSYNTHETICS
- 12.1.9.1. Company Overview
- 12.1.9.2. Products
- 12.1.9.3. Company Financials
- 12.1.9.4. SWOT Analysis
- 12.1.10 ISTANBUL TEKNIK INSAAT MUHENDISLIK SANAYI LTD.
- 12.1.10.1. Company Overview
- 12.1.10.2. Products
- 12.1.10.3. Company Financials
- 12.1.10.4. SWOT Analysis
- 12.1.11 SHRI AMBICA POLYMER PVT
- 12.1.11.1. Company Overview
- 12.1.11.2. Products
- 12.1.11.3. Company Financials
- 12.1.11.4. SWOT Analysis
- 12.1.12 TENSAR INTERNATIONAL GMBH
- 12.1.12.1. Company Overview
- 12.1.12.2. Products
- 12.1.12.3. Company Financials
- 12.1.12.4. SWOT Analysis
- 12.1.1 Wilson Garden
- 12.2. Market Entropy
- 12.2.1 Company's Key Areas Served
- 12.2.2 Recent Developments
- 12.3. Company Market Share Analysis 2025
- 12.3.1 Top 5 Companies Market Share Analysis
- 12.3.2 Top 3 Companies Market Share Analysis
- 12.4. List of Potential Customers
- 13. Research Methodology
List of Figures
- Figure 1: Global Bio Based Products For Agricultural Revenue Breakdown (million, %) by Region 2025 & 2033
- Figure 2: Global Bio Based Products For Agricultural Volume Breakdown (K, %) by Region 2025 & 2033
- Figure 3: North America Bio Based Products For Agricultural Revenue (million), by Application 2025 & 2033
- Figure 4: North America Bio Based Products For Agricultural Volume (K), by Application 2025 & 2033
- Figure 5: North America Bio Based Products For Agricultural Revenue Share (%), by Application 2025 & 2033
- Figure 6: North America Bio Based Products For Agricultural Volume Share (%), by Application 2025 & 2033
- Figure 7: North America Bio Based Products For Agricultural Revenue (million), by Type 2025 & 2033
- Figure 8: North America Bio Based Products For Agricultural Volume (K), by Type 2025 & 2033
- Figure 9: North America Bio Based Products For Agricultural Revenue Share (%), by Type 2025 & 2033
- Figure 10: North America Bio Based Products For Agricultural Volume Share (%), by Type 2025 & 2033
- Figure 11: North America Bio Based Products For Agricultural Revenue (million), by Country 2025 & 2033
- Figure 12: North America Bio Based Products For Agricultural Volume (K), by Country 2025 & 2033
- Figure 13: North America Bio Based Products For Agricultural Revenue Share (%), by Country 2025 & 2033
- Figure 14: North America Bio Based Products For Agricultural Volume Share (%), by Country 2025 & 2033
- Figure 15: South America Bio Based Products For Agricultural Revenue (million), by Application 2025 & 2033
- Figure 16: South America Bio Based Products For Agricultural Volume (K), by Application 2025 & 2033
- Figure 17: South America Bio Based Products For Agricultural Revenue Share (%), by Application 2025 & 2033
- Figure 18: South America Bio Based Products For Agricultural Volume Share (%), by Application 2025 & 2033
- Figure 19: South America Bio Based Products For Agricultural Revenue (million), by Type 2025 & 2033
- Figure 20: South America Bio Based Products For Agricultural Volume (K), by Type 2025 & 2033
- Figure 21: South America Bio Based Products For Agricultural Revenue Share (%), by Type 2025 & 2033
- Figure 22: South America Bio Based Products For Agricultural Volume Share (%), by Type 2025 & 2033
- Figure 23: South America Bio Based Products For Agricultural Revenue (million), by Country 2025 & 2033
- Figure 24: South America Bio Based Products For Agricultural Volume (K), by Country 2025 & 2033
- Figure 25: South America Bio Based Products For Agricultural Revenue Share (%), by Country 2025 & 2033
- Figure 26: South America Bio Based Products For Agricultural Volume Share (%), by Country 2025 & 2033
- Figure 27: Europe Bio Based Products For Agricultural Revenue (million), by Application 2025 & 2033
- Figure 28: Europe Bio Based Products For Agricultural Volume (K), by Application 2025 & 2033
- Figure 29: Europe Bio Based Products For Agricultural Revenue Share (%), by Application 2025 & 2033
- Figure 30: Europe Bio Based Products For Agricultural Volume Share (%), by Application 2025 & 2033
- Figure 31: Europe Bio Based Products For Agricultural Revenue (million), by Type 2025 & 2033
- Figure 32: Europe Bio Based Products For Agricultural Volume (K), by Type 2025 & 2033
- Figure 33: Europe Bio Based Products For Agricultural Revenue Share (%), by Type 2025 & 2033
- Figure 34: Europe Bio Based Products For Agricultural Volume Share (%), by Type 2025 & 2033
- Figure 35: Europe Bio Based Products For Agricultural Revenue (million), by Country 2025 & 2033
- Figure 36: Europe Bio Based Products For Agricultural Volume (K), by Country 2025 & 2033
- Figure 37: Europe Bio Based Products For Agricultural Revenue Share (%), by Country 2025 & 2033
- Figure 38: Europe Bio Based Products For Agricultural Volume Share (%), by Country 2025 & 2033
- Figure 39: Middle East & Africa Bio Based Products For Agricultural Revenue (million), by Application 2025 & 2033
- Figure 40: Middle East & Africa Bio Based Products For Agricultural Volume (K), by Application 2025 & 2033
- Figure 41: Middle East & Africa Bio Based Products For Agricultural Revenue Share (%), by Application 2025 & 2033
- Figure 42: Middle East & Africa Bio Based Products For Agricultural Volume Share (%), by Application 2025 & 2033
- Figure 43: Middle East & Africa Bio Based Products For Agricultural Revenue (million), by Type 2025 & 2033
- Figure 44: Middle East & Africa Bio Based Products For Agricultural Volume (K), by Type 2025 & 2033
- Figure 45: Middle East & Africa Bio Based Products For Agricultural Revenue Share (%), by Type 2025 & 2033
- Figure 46: Middle East & Africa Bio Based Products For Agricultural Volume Share (%), by Type 2025 & 2033
- Figure 47: Middle East & Africa Bio Based Products For Agricultural Revenue (million), by Country 2025 & 2033
- Figure 48: Middle East & Africa Bio Based Products For Agricultural Volume (K), by Country 2025 & 2033
- Figure 49: Middle East & Africa Bio Based Products For Agricultural Revenue Share (%), by Country 2025 & 2033
- Figure 50: Middle East & Africa Bio Based Products For Agricultural Volume Share (%), by Country 2025 & 2033
- Figure 51: Asia Pacific Bio Based Products For Agricultural Revenue (million), by Application 2025 & 2033
- Figure 52: Asia Pacific Bio Based Products For Agricultural Volume (K), by Application 2025 & 2033
- Figure 53: Asia Pacific Bio Based Products For Agricultural Revenue Share (%), by Application 2025 & 2033
- Figure 54: Asia Pacific Bio Based Products For Agricultural Volume Share (%), by Application 2025 & 2033
- Figure 55: Asia Pacific Bio Based Products For Agricultural Revenue (million), by Type 2025 & 2033
- Figure 56: Asia Pacific Bio Based Products For Agricultural Volume (K), by Type 2025 & 2033
- Figure 57: Asia Pacific Bio Based Products For Agricultural Revenue Share (%), by Type 2025 & 2033
- Figure 58: Asia Pacific Bio Based Products For Agricultural Volume Share (%), by Type 2025 & 2033
- Figure 59: Asia Pacific Bio Based Products For Agricultural Revenue (million), by Country 2025 & 2033
- Figure 60: Asia Pacific Bio Based Products For Agricultural Volume (K), by Country 2025 & 2033
- Figure 61: Asia Pacific Bio Based Products For Agricultural Revenue Share (%), by Country 2025 & 2033
- Figure 62: Asia Pacific Bio Based Products For Agricultural Volume Share (%), by Country 2025 & 2033
List of Tables
- Table 1: Global Bio Based Products For Agricultural Revenue million Forecast, by Application 2020 & 2033
- Table 2: Global Bio Based Products For Agricultural Volume K Forecast, by Application 2020 & 2033
- Table 3: Global Bio Based Products For Agricultural Revenue million Forecast, by Type 2020 & 2033
- Table 4: Global Bio Based Products For Agricultural Volume K Forecast, by Type 2020 & 2033
- Table 5: Global Bio Based Products For Agricultural Revenue million Forecast, by Region 2020 & 2033
- Table 6: Global Bio Based Products For Agricultural Volume K Forecast, by Region 2020 & 2033
- Table 7: Global Bio Based Products For Agricultural Revenue million Forecast, by Application 2020 & 2033
- Table 8: Global Bio Based Products For Agricultural Volume K Forecast, by Application 2020 & 2033
- Table 9: Global Bio Based Products For Agricultural Revenue million Forecast, by Type 2020 & 2033
- Table 10: Global Bio Based Products For Agricultural Volume K Forecast, by Type 2020 & 2033
- Table 11: Global Bio Based Products For Agricultural Revenue million Forecast, by Country 2020 & 2033
- Table 12: Global Bio Based Products For Agricultural Volume K Forecast, by Country 2020 & 2033
- Table 13: United States Bio Based Products For Agricultural Revenue (million) Forecast, by Application 2020 & 2033
- Table 14: United States Bio Based Products For Agricultural Volume (K) Forecast, by Application 2020 & 2033
- Table 15: Canada Bio Based Products For Agricultural Revenue (million) Forecast, by Application 2020 & 2033
- Table 16: Canada Bio Based Products For Agricultural Volume (K) Forecast, by Application 2020 & 2033
- Table 17: Mexico Bio Based Products For Agricultural Revenue (million) Forecast, by Application 2020 & 2033
- Table 18: Mexico Bio Based Products For Agricultural Volume (K) Forecast, by Application 2020 & 2033
- Table 19: Global Bio Based Products For Agricultural Revenue million Forecast, by Application 2020 & 2033
- Table 20: Global Bio Based Products For Agricultural Volume K Forecast, by Application 2020 & 2033
- Table 21: Global Bio Based Products For Agricultural Revenue million Forecast, by Type 2020 & 2033
- Table 22: Global Bio Based Products For Agricultural Volume K Forecast, by Type 2020 & 2033
- Table 23: Global Bio Based Products For Agricultural Revenue million Forecast, by Country 2020 & 2033
- Table 24: Global Bio Based Products For Agricultural Volume K Forecast, by Country 2020 & 2033
- Table 25: Brazil Bio Based Products For Agricultural Revenue (million) Forecast, by Application 2020 & 2033
- Table 26: Brazil Bio Based Products For Agricultural Volume (K) Forecast, by Application 2020 & 2033
- Table 27: Argentina Bio Based Products For Agricultural Revenue (million) Forecast, by Application 2020 & 2033
- Table 28: Argentina Bio Based Products For Agricultural Volume (K) Forecast, by Application 2020 & 2033
- Table 29: Rest of South America Bio Based Products For Agricultural Revenue (million) Forecast, by Application 2020 & 2033
- Table 30: Rest of South America Bio Based Products For Agricultural Volume (K) Forecast, by Application 2020 & 2033
- Table 31: Global Bio Based Products For Agricultural Revenue million Forecast, by Application 2020 & 2033
- Table 32: Global Bio Based Products For Agricultural Volume K Forecast, by Application 2020 & 2033
- Table 33: Global Bio Based Products For Agricultural Revenue million Forecast, by Type 2020 & 2033
- Table 34: Global Bio Based Products For Agricultural Volume K Forecast, by Type 2020 & 2033
- Table 35: Global Bio Based Products For Agricultural Revenue million Forecast, by Country 2020 & 2033
- Table 36: Global Bio Based Products For Agricultural Volume K Forecast, by Country 2020 & 2033
- Table 37: United Kingdom Bio Based Products For Agricultural Revenue (million) Forecast, by Application 2020 & 2033
- Table 38: United Kingdom Bio Based Products For Agricultural Volume (K) Forecast, by Application 2020 & 2033
- Table 39: Germany Bio Based Products For Agricultural Revenue (million) Forecast, by Application 2020 & 2033
- Table 40: Germany Bio Based Products For Agricultural Volume (K) Forecast, by Application 2020 & 2033
- Table 41: France Bio Based Products For Agricultural Revenue (million) Forecast, by Application 2020 & 2033
- Table 42: France Bio Based Products For Agricultural Volume (K) Forecast, by Application 2020 & 2033
- Table 43: Italy Bio Based Products For Agricultural Revenue (million) Forecast, by Application 2020 & 2033
- Table 44: Italy Bio Based Products For Agricultural Volume (K) Forecast, by Application 2020 & 2033
- Table 45: Spain Bio Based Products For Agricultural Revenue (million) Forecast, by Application 2020 & 2033
- Table 46: Spain Bio Based Products For Agricultural Volume (K) Forecast, by Application 2020 & 2033
- Table 47: Russia Bio Based Products For Agricultural Revenue (million) Forecast, by Application 2020 & 2033
- Table 48: Russia Bio Based Products For Agricultural Volume (K) Forecast, by Application 2020 & 2033
- Table 49: Benelux Bio Based Products For Agricultural Revenue (million) Forecast, by Application 2020 & 2033
- Table 50: Benelux Bio Based Products For Agricultural Volume (K) Forecast, by Application 2020 & 2033
- Table 51: Nordics Bio Based Products For Agricultural Revenue (million) Forecast, by Application 2020 & 2033
- Table 52: Nordics Bio Based Products For Agricultural Volume (K) Forecast, by Application 2020 & 2033
- Table 53: Rest of Europe Bio Based Products For Agricultural Revenue (million) Forecast, by Application 2020 & 2033
- Table 54: Rest of Europe Bio Based Products For Agricultural Volume (K) Forecast, by Application 2020 & 2033
- Table 55: Global Bio Based Products For Agricultural Revenue million Forecast, by Application 2020 & 2033
- Table 56: Global Bio Based Products For Agricultural Volume K Forecast, by Application 2020 & 2033
- Table 57: Global Bio Based Products For Agricultural Revenue million Forecast, by Type 2020 & 2033
- Table 58: Global Bio Based Products For Agricultural Volume K Forecast, by Type 2020 & 2033
- Table 59: Global Bio Based Products For Agricultural Revenue million Forecast, by Country 2020 & 2033
- Table 60: Global Bio Based Products For Agricultural Volume K Forecast, by Country 2020 & 2033
- Table 61: Turkey Bio Based Products For Agricultural Revenue (million) Forecast, by Application 2020 & 2033
- Table 62: Turkey Bio Based Products For Agricultural Volume (K) Forecast, by Application 2020 & 2033
- Table 63: Israel Bio Based Products For Agricultural Revenue (million) Forecast, by Application 2020 & 2033
- Table 64: Israel Bio Based Products For Agricultural Volume (K) Forecast, by Application 2020 & 2033
- Table 65: GCC Bio Based Products For Agricultural Revenue (million) Forecast, by Application 2020 & 2033
- Table 66: GCC Bio Based Products For Agricultural Volume (K) Forecast, by Application 2020 & 2033
- Table 67: North Africa Bio Based Products For Agricultural Revenue (million) Forecast, by Application 2020 & 2033
- Table 68: North Africa Bio Based Products For Agricultural Volume (K) Forecast, by Application 2020 & 2033
- Table 69: South Africa Bio Based Products For Agricultural Revenue (million) Forecast, by Application 2020 & 2033
- Table 70: South Africa Bio Based Products For Agricultural Volume (K) Forecast, by Application 2020 & 2033
- Table 71: Rest of Middle East & Africa Bio Based Products For Agricultural Revenue (million) Forecast, by Application 2020 & 2033
- Table 72: Rest of Middle East & Africa Bio Based Products For Agricultural Volume (K) Forecast, by Application 2020 & 2033
- Table 73: Global Bio Based Products For Agricultural Revenue million Forecast, by Application 2020 & 2033
- Table 74: Global Bio Based Products For Agricultural Volume K Forecast, by Application 2020 & 2033
- Table 75: Global Bio Based Products For Agricultural Revenue million Forecast, by Type 2020 & 2033
- Table 76: Global Bio Based Products For Agricultural Volume K Forecast, by Type 2020 & 2033
- Table 77: Global Bio Based Products For Agricultural Revenue million Forecast, by Country 2020 & 2033
- Table 78: Global Bio Based Products For Agricultural Volume K Forecast, by Country 2020 & 2033
- Table 79: China Bio Based Products For Agricultural Revenue (million) Forecast, by Application 2020 & 2033
- Table 80: China Bio Based Products For Agricultural Volume (K) Forecast, by Application 2020 & 2033
- Table 81: India Bio Based Products For Agricultural Revenue (million) Forecast, by Application 2020 & 2033
- Table 82: India Bio Based Products For Agricultural Volume (K) Forecast, by Application 2020 & 2033
- Table 83: Japan Bio Based Products For Agricultural Revenue (million) Forecast, by Application 2020 & 2033
- Table 84: Japan Bio Based Products For Agricultural Volume (K) Forecast, by Application 2020 & 2033
- Table 85: South Korea Bio Based Products For Agricultural Revenue (million) Forecast, by Application 2020 & 2033
- Table 86: South Korea Bio Based Products For Agricultural Volume (K) Forecast, by Application 2020 & 2033
- Table 87: ASEAN Bio Based Products For Agricultural Revenue (million) Forecast, by Application 2020 & 2033
- Table 88: ASEAN Bio Based Products For Agricultural Volume (K) Forecast, by Application 2020 & 2033
- Table 89: Oceania Bio Based Products For Agricultural Revenue (million) Forecast, by Application 2020 & 2033
- Table 90: Oceania Bio Based Products For Agricultural Volume (K) Forecast, by Application 2020 & 2033
- Table 91: Rest of Asia Pacific Bio Based Products For Agricultural Revenue (million) Forecast, by Application 2020 & 2033
- Table 92: Rest of Asia Pacific Bio Based Products For Agricultural Volume (K) Forecast, by Application 2020 & 2033
Frequently Asked Questions
1. What is the projected Compound Annual Growth Rate (CAGR) of the Bio Based Products For Agricultural?
The projected CAGR is approximately XXX%.
2. Which companies are prominent players in the Bio Based Products For Agricultural?
Key companies in the market include Wilson Garden, Nityanand Agro Ltd, Summit Plastic Company, Goyal Agri Products, FIBRALCO S.A, NET YAPI MALZ, GRUPO CRIADO Y LOPEZ., ECO-VTOR, NAUE GEOSYNTHETICS, ISTANBUL TEKNIK INSAAT MUHENDISLIK SANAYI LTD., SHRI AMBICA POLYMER PVT, TENSAR INTERNATIONAL GMBH.
3. What are the main segments of the Bio Based Products For Agricultural?
The market segments include Application, Type.
4. Can you provide details about the market size?
The market size is estimated to be USD XXX million as of 2022.
5. What are some drivers contributing to market growth?
N/A
6. What are the notable trends driving market growth?
N/A
7. Are there any restraints impacting market growth?
N/A
8. Can you provide examples of recent developments in the market?
N/A
9. What pricing options are available for accessing the report?
Pricing options include single-user, multi-user, and enterprise licenses priced at USD 3950.00, USD 5925.00, and USD 7900.00 respectively.
10. Is the market size provided in terms of value or volume?
The market size is provided in terms of value, measured in million and volume, measured in K.
11. Are there any specific market keywords associated with the report?
Yes, the market keyword associated with the report is "Bio Based Products For Agricultural," which aids in identifying and referencing the specific market segment covered.
12. How do I determine which pricing option suits my needs best?
The pricing options vary based on user requirements and access needs. Individual users may opt for single-user licenses, while businesses requiring broader access may choose multi-user or enterprise licenses for cost-effective access to the report.
13. Are there any additional resources or data provided in the Bio Based Products For Agricultural report?
While the report offers comprehensive insights, it's advisable to review the specific contents or supplementary materials provided to ascertain if additional resources or data are available.
14. How can I stay updated on further developments or reports in the Bio Based Products For Agricultural?
To stay informed about further developments, trends, and reports in the Bio Based Products For Agricultural, consider subscribing to industry newsletters, following relevant companies and organizations, or regularly checking reputable industry news sources and publications.
Methodology
Step 1 - Identification of Relevant Samples Size from Population Database


Step 2 - Approaches for Defining Global Market Size (Value, Volume* & Price*)

Note*: In applicable scenarios
Step 3 - Data Sources
Primary Research
- Web Analytics
- Survey Reports
- Research Institute
- Latest Research Reports
- Opinion Leaders
Secondary Research
- Annual Reports
- White Paper
- Latest Press Release
- Industry Association
- Paid Database
- Investor Presentations

Step 4 - Data Triangulation
Involves using different sources of information in order to increase the validity of a study
These sources are likely to be stakeholders in a program - participants, other researchers, program staff, other community members, and so on.
Then we put all data in single framework & apply various statistical tools to find out the dynamic on the market.
During the analysis stage, feedback from the stakeholder groups would be compared to determine areas of agreement as well as areas of divergence

