
Key Insights
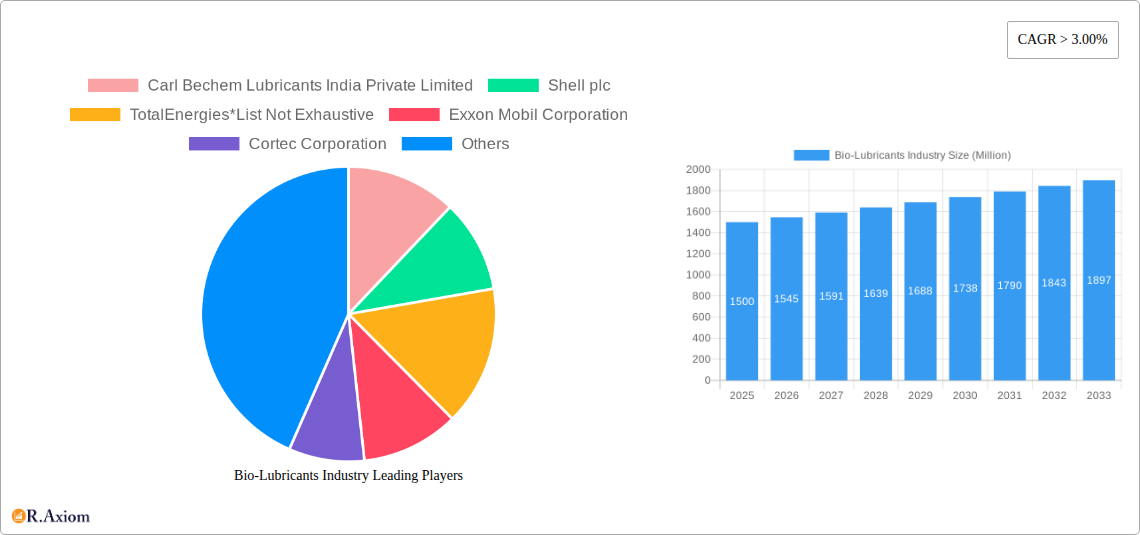
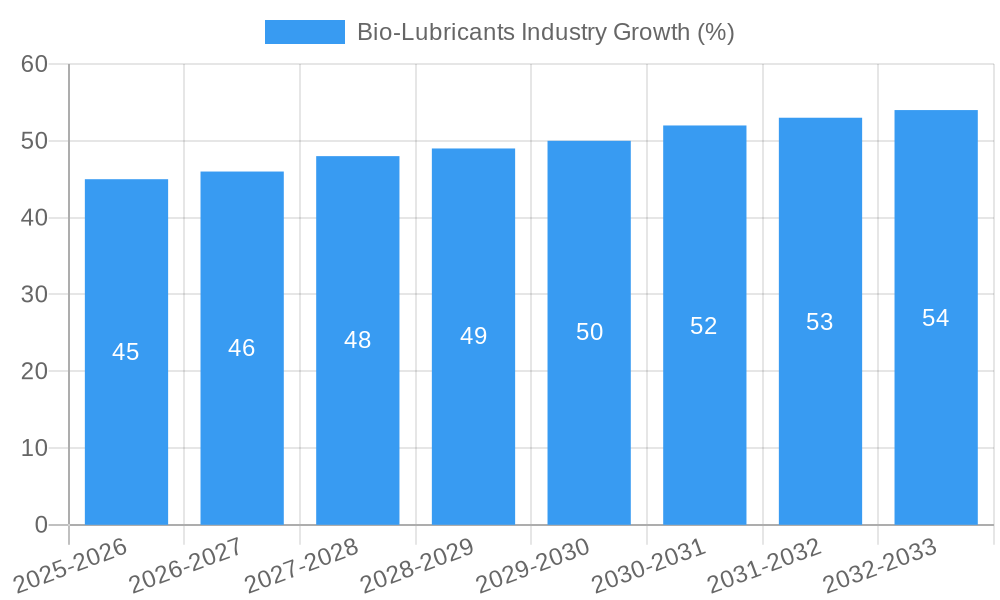
The global bio-lubricants market, valued at approximately $1.5 billion in 2025, is experiencing robust growth, projected to maintain a compound annual growth rate (CAGR) exceeding 3% through 2033. This expansion is driven by several key factors. Increasing environmental concerns and stringent regulations regarding the use of petroleum-based lubricants are pushing industries to adopt more sustainable alternatives. Bio-lubricants, derived from renewable resources like vegetable oils and other biological materials, offer a significantly lower environmental footprint, reducing carbon emissions and promoting a circular economy. Furthermore, the growing demand across various sectors, including automotive, heavy equipment, and food and beverage processing, fuels market growth. Specific applications like engine oils, gear oils, and hydraulic fluids are witnessing particularly strong adoption, driven by performance improvements and cost competitiveness in certain segments.
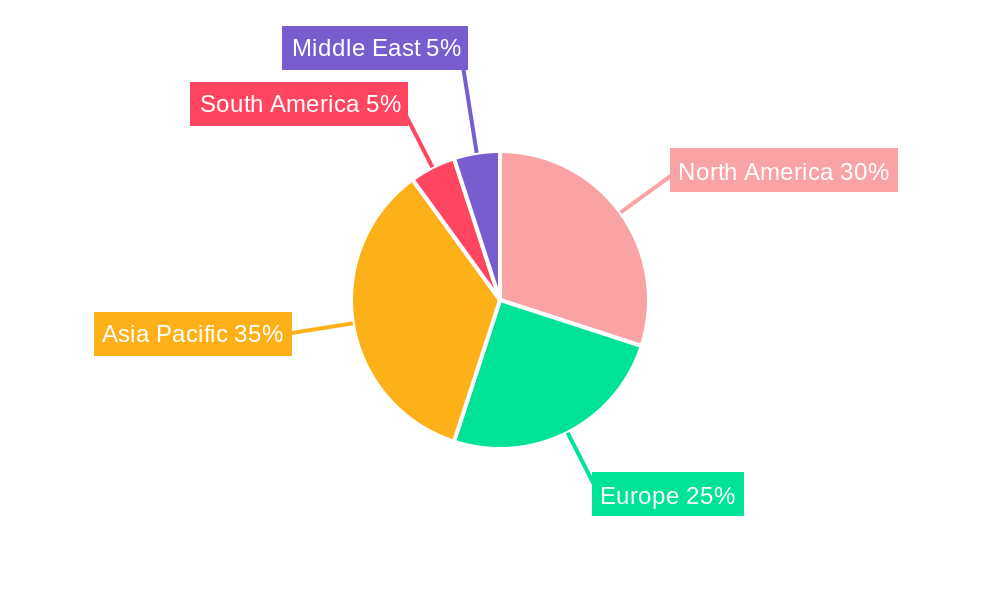
The market's segmentation reflects diverse application needs. Engine oils and hydraulic fluids currently dominate the product type segment, while the automotive and heavy equipment sectors represent significant end-user industry segments. Geographical distribution indicates strong growth potential in the Asia-Pacific region, particularly China and India, fueled by industrialization and rising vehicle ownership. North America and Europe maintain substantial market shares due to existing regulatory frameworks and established bio-lubricant adoption. However, the market faces certain challenges, including higher initial costs compared to petroleum-based lubricants and the need for continuous innovation to improve performance and meet the specific requirements of various applications. Major players like Shell, TotalEnergies, and FUCHS are actively investing in research and development to overcome these hurdles, furthering the growth of the bio-lubricants industry.
Bio-Lubricants Industry Market Report: 2019-2033
This comprehensive report provides a detailed analysis of the bio-lubricants industry, covering market size, segmentation, growth drivers, challenges, and key players. With a study period spanning 2019-2033, a base year of 2025, and a forecast period of 2025-2033, this report offers invaluable insights for industry stakeholders, investors, and businesses seeking to navigate this dynamic market. The market value in Million is estimated at xx Million in 2025.
Bio-Lubricants Industry Market Concentration & Innovation
The bio-lubricants market exhibits a moderately concentrated landscape, with several major players holding significant market share. However, the industry is witnessing a rise in smaller, specialized companies focusing on niche applications and sustainable solutions. Market concentration is influenced by factors such as economies of scale in production, established distribution networks, and brand recognition. While precise market share figures for individual companies are proprietary information and unavailable for public disclosure, estimations suggest that the top 5 players cumulatively control approximately xx% of the global market.
Innovation Drivers:
- Stringent environmental regulations promoting sustainable alternatives to traditional petroleum-based lubricants.
- Growing demand for energy-efficient lubricants across various sectors.
- Advancements in bio-based raw material technologies leading to enhanced performance and cost-effectiveness.
- Focus on developing biodegradable and compostable lubricants to reduce environmental impact.
Regulatory Frameworks: Varying environmental regulations across different geographies significantly impact market growth and product development. Compliance requirements drive innovation in bio-lubricant formulations.
Product Substitutes: Traditional petroleum-based lubricants remain the primary substitute for bio-lubricants, however, their environmental impact fuels the shift towards more sustainable options.
End-User Trends: Increasing awareness of environmental sustainability and corporate social responsibility initiatives drive adoption of bio-lubricants across various end-user industries.
M&A Activities: Recent mergers and acquisitions (M&A) activity highlight the industry's consolidation trend and the strategic pursuit of innovation and market expansion. For example, in November 2022, Shell plc's acquisition of Panolin Group's ECL business illustrates the focus on expanding the biodegradable lubricant portfolio. The deal value was estimated at xx Million.
Bio-Lubricants Industry Industry Trends & Insights
The global bio-lubricants market is experiencing robust growth, driven by a confluence of factors. The increasing adoption of sustainable practices across various industries is a primary growth catalyst. The stringent environmental regulations and the growing consumer preference for eco-friendly products have further fueled the demand for bio-lubricants. Technological advancements in bio-based raw material production and lubricant formulation have also contributed significantly to market growth.
The market is witnessing considerable technological disruption, with continuous innovations in bio-based raw materials and lubricant formulations. The development of high-performance bio-lubricants that match or exceed the performance of conventional lubricants is a major trend. Consumer preferences are shifting towards sustainable and environmentally responsible products, further driving the adoption of bio-lubricants. Competitive dynamics are shaped by intense competition among established players and the emergence of new entrants. The industry is characterized by both price competition and differentiation based on product performance, sustainability credentials, and service offerings. The CAGR of the global bio-lubricants market during the forecast period (2025-2033) is estimated at xx%, while market penetration is projected to reach xx% by 2033.
Dominant Markets & Segments in Bio-Lubricants Industry
The automotive and other transportation segments currently dominate the bio-lubricants market, driven by the increasing demand for environmentally friendly lubricants in the automotive sector. The power generation segment is also witnessing significant growth, as power producers increasingly adopt bio-lubricants to meet environmental sustainability targets.
Key Drivers for Dominant Segments:
- Automotive and Other Transportation: Stringent emission regulations, growing environmental awareness among consumers, and technological advancements in bio-lubricant formulations.
- Power Generation: Increasing adoption of renewable energy sources, stricter environmental regulations, and the need for energy-efficient lubricants in power generation applications.
Dominant Regions/Countries: North America and Europe are currently leading the bio-lubricants market due to the presence of established players, stringent environmental regulations, and high consumer awareness. However, Asia-Pacific is anticipated to showcase the fastest growth rate over the forecast period. This growth is mainly fueled by rapid industrialization, increasing automotive sales, and rising environmental concerns.
Bio-Lubricants Industry Product Developments
Recent product innovations focus on enhanced performance characteristics, improved biodegradability, and wider application suitability. Key developments include the introduction of bio-lubricants with superior oxidation stability, improved viscosity indices, and extended service life. The market is witnessing an increasing number of biodegradable and compostable lubricant formulations, catering to the demand for environmentally friendly products. These innovations aim to compete effectively with conventional lubricants while offering environmental advantages and cost-effectiveness.
Report Scope & Segmentation Analysis
This report segments the bio-lubricants market by product type (Engine Oil, Transmission and Hydraulic Fluid, Metalworking Fluid, General Industrial Oil, Gear Oil, Grease, Process Oil, Other Product Types) and end-user industry (Power Generation, Automotive and Other Transportation, Heavy Equipment, Food & Beverage, Metallurgy & Metalworking, Chemical Manufacturing, Other End-user Industries). Each segment's growth projections, market sizes, and competitive dynamics are analyzed in detail, revealing significant growth potential in the bio-based alternatives to conventional lubricants. The Automotive and other transportation sector is projected to retain its market leadership due to stringent emission norms and regulations.
Key Drivers of Bio-Lubricants Industry Growth
The bio-lubricants industry's growth is propelled by several key factors. Firstly, the stringent environmental regulations globally incentivize the adoption of eco-friendly lubricants. Secondly, the rising consumer awareness concerning environmental sustainability is driving demand for bio-based products. Thirdly, technological advancements in bio-based raw materials and lubricant formulations enhance product performance and reduce costs, making bio-lubricants a more attractive proposition. Finally, the increasing focus on energy efficiency across various sectors further fuels market growth.
Challenges in the Bio-Lubricants Industry Sector
Despite the considerable growth potential, the bio-lubricants industry faces several challenges. High raw material costs compared to petroleum-based alternatives impact the overall cost competitiveness. The establishment of robust supply chains for sustainable and traceable raw materials remains a considerable hurdle. Furthermore, inconsistencies in performance compared to traditional lubricants, alongside insufficient awareness and knowledge among end-users, represent significant challenges to wider adoption.
Emerging Opportunities in Bio-Lubricants Industry
The bio-lubricants industry is rife with emerging opportunities. Expanding into new and niche market segments, particularly in emerging economies with rapidly growing industrial sectors, offers substantial growth potential. The development of advanced bio-lubricants with superior performance characteristics, addressing specific application needs, presents significant opportunities for market differentiation. Further research and development in bio-based raw materials that are both cost-effective and sustainable presents ongoing opportunities for innovation and market expansion.
Leading Players in the Bio-Lubricants Industry Market
- Carl Bechem Lubricants India Private Limited
- Shell plc
- TotalEnergies
- Exxon Mobil Corporation
- Cortec Corporation
- FUCHS
- Cargill
- KCM Petro Chemicals
- Chevron Corporation
- Novvi LLC
- Axel Christiernsson
- Environmental Lubricants Manufacturing Inc
- PANOLIN AG
- BP plc
Key Developments in Bio-Lubricants Industry Industry
- November 2022: Shell plc acquires Panolin Group's environmentally considerate lubricants (ECLs) business, significantly expanding its biodegradable lubricant portfolio.
- February 2022: BP acquires a 30% stake in Green Biofuels Ltd, collaborating to decarbonize construction, freight, off-road, and maritime sectors using renewable HVO fuels.
Strategic Outlook for Bio-Lubricants Industry Market
The bio-lubricants market is poised for sustained growth, driven by increasing environmental concerns and stringent regulations. The focus on innovation, particularly in developing high-performance, cost-effective, and readily available bio-based raw materials, will be crucial for future success. Expansion into new markets and application areas, coupled with strategic partnerships and M&A activities, will shape the competitive landscape and drive further market expansion in the coming years.
Bio-Lubricants Industry Segmentation
-
1. Product Type
- 1.1. Engine Oil
- 1.2. Transmission and Hydraulic Fluid
- 1.3. Metalworking Fluid
- 1.4. General Industrial Oil
- 1.5. Gear Oil
- 1.6. Grease
- 1.7. Process Oil
- 1.8. Other Product Types
-
2. End-user Industry
- 2.1. Power Generation
- 2.2. Automotive and Other Transportation
- 2.3. Heavy Equipment
- 2.4. Food & Beverage
- 2.5. Metallurgy & Metalworking
- 2.6. Chemical Manufacturing
- 2.7. Other End-user Industries
Bio-Lubricants Industry Segmentation By Geography
-
1. Asia Pacific
- 1.1. China
- 1.2. India
- 1.3. Japan
- 1.4. South Korea
- 1.5. Rest of Asia Pacific
-
2. North America
- 2.1. United States
- 2.2. Canada
- 2.3. Mexico
- 2.4. Rest of North America
-
3. Europe
- 3.1. Germany
- 3.2. United Kingdom
- 3.3. Italy
- 3.4. France
- 3.5. Russia
- 3.6. Rest of Europe
-
4. South America
- 4.1. Brazil
- 4.2. Argentina
- 4.3. Rest of South America
- 5. Middle East
-
6. Saudi Arabia
- 6.1. South Africa
- 6.2. United Arab Emirates
- 6.3. Rest of Middle East
Bio-Lubricants Industry REPORT HIGHLIGHTS
| Aspects | Details |
|---|---|
| Study Period | 2019-2033 |
| Base Year | 2024 |
| Estimated Year | 2025 |
| Forecast Period | 2025-2033 |
| Historical Period | 2019-2024 |
| Growth Rate | CAGR of > 3.00% from 2019-2033 |
| Segmentation |
|
Table of Contents
- 1. Introduction
- 1.1. Research Scope
- 1.2. Market Segmentation
- 1.3. Research Methodology
- 1.4. Definitions and Assumptions
- 2. Executive Summary
- 2.1. Introduction
- 3. Market Dynamics
- 3.1. Introduction
- 3.2. Market Drivers
- 3.2.1. Regulatory Norms Driving the Demand for Bio-based Lubricants; Other Drivers
- 3.3. Market Restrains
- 3.3.1. High Price of Bio-based Lubricants; Other Restraints
- 3.4. Market Trends
- 3.4.1. Increase in Demand for Bio-Lubricants in Automotive and Transportation Sector
- 4. Market Factor Analysis
- 4.1. Porters Five Forces
- 4.2. Supply/Value Chain
- 4.3. PESTEL analysis
- 4.4. Market Entropy
- 4.5. Patent/Trademark Analysis
- 5. Global Bio-Lubricants Industry Analysis, Insights and Forecast, 2019-2031
- 5.1. Market Analysis, Insights and Forecast - by Product Type
- 5.1.1. Engine Oil
- 5.1.2. Transmission and Hydraulic Fluid
- 5.1.3. Metalworking Fluid
- 5.1.4. General Industrial Oil
- 5.1.5. Gear Oil
- 5.1.6. Grease
- 5.1.7. Process Oil
- 5.1.8. Other Product Types
- 5.2. Market Analysis, Insights and Forecast - by End-user Industry
- 5.2.1. Power Generation
- 5.2.2. Automotive and Other Transportation
- 5.2.3. Heavy Equipment
- 5.2.4. Food & Beverage
- 5.2.5. Metallurgy & Metalworking
- 5.2.6. Chemical Manufacturing
- 5.2.7. Other End-user Industries
- 5.3. Market Analysis, Insights and Forecast - by Region
- 5.3.1. Asia Pacific
- 5.3.2. North America
- 5.3.3. Europe
- 5.3.4. South America
- 5.3.5. Middle East
- 5.3.6. Saudi Arabia
- 5.1. Market Analysis, Insights and Forecast - by Product Type
- 6. Asia Pacific Bio-Lubricants Industry Analysis, Insights and Forecast, 2019-2031
- 6.1. Market Analysis, Insights and Forecast - by Product Type
- 6.1.1. Engine Oil
- 6.1.2. Transmission and Hydraulic Fluid
- 6.1.3. Metalworking Fluid
- 6.1.4. General Industrial Oil
- 6.1.5. Gear Oil
- 6.1.6. Grease
- 6.1.7. Process Oil
- 6.1.8. Other Product Types
- 6.2. Market Analysis, Insights and Forecast - by End-user Industry
- 6.2.1. Power Generation
- 6.2.2. Automotive and Other Transportation
- 6.2.3. Heavy Equipment
- 6.2.4. Food & Beverage
- 6.2.5. Metallurgy & Metalworking
- 6.2.6. Chemical Manufacturing
- 6.2.7. Other End-user Industries
- 6.1. Market Analysis, Insights and Forecast - by Product Type
- 7. North America Bio-Lubricants Industry Analysis, Insights and Forecast, 2019-2031
- 7.1. Market Analysis, Insights and Forecast - by Product Type
- 7.1.1. Engine Oil
- 7.1.2. Transmission and Hydraulic Fluid
- 7.1.3. Metalworking Fluid
- 7.1.4. General Industrial Oil
- 7.1.5. Gear Oil
- 7.1.6. Grease
- 7.1.7. Process Oil
- 7.1.8. Other Product Types
- 7.2. Market Analysis, Insights and Forecast - by End-user Industry
- 7.2.1. Power Generation
- 7.2.2. Automotive and Other Transportation
- 7.2.3. Heavy Equipment
- 7.2.4. Food & Beverage
- 7.2.5. Metallurgy & Metalworking
- 7.2.6. Chemical Manufacturing
- 7.2.7. Other End-user Industries
- 7.1. Market Analysis, Insights and Forecast - by Product Type
- 8. Europe Bio-Lubricants Industry Analysis, Insights and Forecast, 2019-2031
- 8.1. Market Analysis, Insights and Forecast - by Product Type
- 8.1.1. Engine Oil
- 8.1.2. Transmission and Hydraulic Fluid
- 8.1.3. Metalworking Fluid
- 8.1.4. General Industrial Oil
- 8.1.5. Gear Oil
- 8.1.6. Grease
- 8.1.7. Process Oil
- 8.1.8. Other Product Types
- 8.2. Market Analysis, Insights and Forecast - by End-user Industry
- 8.2.1. Power Generation
- 8.2.2. Automotive and Other Transportation
- 8.2.3. Heavy Equipment
- 8.2.4. Food & Beverage
- 8.2.5. Metallurgy & Metalworking
- 8.2.6. Chemical Manufacturing
- 8.2.7. Other End-user Industries
- 8.1. Market Analysis, Insights and Forecast - by Product Type
- 9. South America Bio-Lubricants Industry Analysis, Insights and Forecast, 2019-2031
- 9.1. Market Analysis, Insights and Forecast - by Product Type
- 9.1.1. Engine Oil
- 9.1.2. Transmission and Hydraulic Fluid
- 9.1.3. Metalworking Fluid
- 9.1.4. General Industrial Oil
- 9.1.5. Gear Oil
- 9.1.6. Grease
- 9.1.7. Process Oil
- 9.1.8. Other Product Types
- 9.2. Market Analysis, Insights and Forecast - by End-user Industry
- 9.2.1. Power Generation
- 9.2.2. Automotive and Other Transportation
- 9.2.3. Heavy Equipment
- 9.2.4. Food & Beverage
- 9.2.5. Metallurgy & Metalworking
- 9.2.6. Chemical Manufacturing
- 9.2.7. Other End-user Industries
- 9.1. Market Analysis, Insights and Forecast - by Product Type
- 10. Middle East Bio-Lubricants Industry Analysis, Insights and Forecast, 2019-2031
- 10.1. Market Analysis, Insights and Forecast - by Product Type
- 10.1.1. Engine Oil
- 10.1.2. Transmission and Hydraulic Fluid
- 10.1.3. Metalworking Fluid
- 10.1.4. General Industrial Oil
- 10.1.5. Gear Oil
- 10.1.6. Grease
- 10.1.7. Process Oil
- 10.1.8. Other Product Types
- 10.2. Market Analysis, Insights and Forecast - by End-user Industry
- 10.2.1. Power Generation
- 10.2.2. Automotive and Other Transportation
- 10.2.3. Heavy Equipment
- 10.2.4. Food & Beverage
- 10.2.5. Metallurgy & Metalworking
- 10.2.6. Chemical Manufacturing
- 10.2.7. Other End-user Industries
- 10.1. Market Analysis, Insights and Forecast - by Product Type
- 11. Saudi Arabia Bio-Lubricants Industry Analysis, Insights and Forecast, 2019-2031
- 11.1. Market Analysis, Insights and Forecast - by Product Type
- 11.1.1. Engine Oil
- 11.1.2. Transmission and Hydraulic Fluid
- 11.1.3. Metalworking Fluid
- 11.1.4. General Industrial Oil
- 11.1.5. Gear Oil
- 11.1.6. Grease
- 11.1.7. Process Oil
- 11.1.8. Other Product Types
- 11.2. Market Analysis, Insights and Forecast - by End-user Industry
- 11.2.1. Power Generation
- 11.2.2. Automotive and Other Transportation
- 11.2.3. Heavy Equipment
- 11.2.4. Food & Beverage
- 11.2.5. Metallurgy & Metalworking
- 11.2.6. Chemical Manufacturing
- 11.2.7. Other End-user Industries
- 11.1. Market Analysis, Insights and Forecast - by Product Type
- 12. Asia Pacific Bio-Lubricants Industry Analysis, Insights and Forecast, 2019-2031
- 12.1. Market Analysis, Insights and Forecast - By Country/Sub-region
- 12.1.1 China
- 12.1.2 India
- 12.1.3 Japan
- 12.1.4 South Korea
- 12.1.5 Rest of Asia Pacific
- 13. North America Bio-Lubricants Industry Analysis, Insights and Forecast, 2019-2031
- 13.1. Market Analysis, Insights and Forecast - By Country/Sub-region
- 13.1.1 United States
- 13.1.2 Canada
- 13.1.3 Mexico
- 13.1.4 Rest of North America
- 14. Europe Bio-Lubricants Industry Analysis, Insights and Forecast, 2019-2031
- 14.1. Market Analysis, Insights and Forecast - By Country/Sub-region
- 14.1.1 Germany
- 14.1.2 United Kingdom
- 14.1.3 Italy
- 14.1.4 France
- 14.1.5 Russia
- 14.1.6 Rest of Europe
- 15. South America Bio-Lubricants Industry Analysis, Insights and Forecast, 2019-2031
- 15.1. Market Analysis, Insights and Forecast - By Country/Sub-region
- 15.1.1 Brazil
- 15.1.2 Argentina
- 15.1.3 Rest of South America
- 16. Middle East Bio-Lubricants Industry Analysis, Insights and Forecast, 2019-2031
- 16.1. Market Analysis, Insights and Forecast - By Country/Sub-region
- 16.1.1.
- 17. Saudi Arabia Bio-Lubricants Industry Analysis, Insights and Forecast, 2019-2031
- 17.1. Market Analysis, Insights and Forecast - By Country/Sub-region
- 17.1.1 South Africa
- 17.1.2 United Arab Emirates
- 17.1.3 Rest of Middle East
- 18. Competitive Analysis
- 18.1. Global Market Share Analysis 2024
- 18.2. Company Profiles
- 18.2.1 Carl Bechem Lubricants India Private Limited
- 18.2.1.1. Overview
- 18.2.1.2. Products
- 18.2.1.3. SWOT Analysis
- 18.2.1.4. Recent Developments
- 18.2.1.5. Financials (Based on Availability)
- 18.2.2 Shell plc
- 18.2.2.1. Overview
- 18.2.2.2. Products
- 18.2.2.3. SWOT Analysis
- 18.2.2.4. Recent Developments
- 18.2.2.5. Financials (Based on Availability)
- 18.2.3 TotalEnergies*List Not Exhaustive
- 18.2.3.1. Overview
- 18.2.3.2. Products
- 18.2.3.3. SWOT Analysis
- 18.2.3.4. Recent Developments
- 18.2.3.5. Financials (Based on Availability)
- 18.2.4 Exxon Mobil Corporation
- 18.2.4.1. Overview
- 18.2.4.2. Products
- 18.2.4.3. SWOT Analysis
- 18.2.4.4. Recent Developments
- 18.2.4.5. Financials (Based on Availability)
- 18.2.5 Cortec Corporation
- 18.2.5.1. Overview
- 18.2.5.2. Products
- 18.2.5.3. SWOT Analysis
- 18.2.5.4. Recent Developments
- 18.2.5.5. Financials (Based on Availability)
- 18.2.6 FUCHS
- 18.2.6.1. Overview
- 18.2.6.2. Products
- 18.2.6.3. SWOT Analysis
- 18.2.6.4. Recent Developments
- 18.2.6.5. Financials (Based on Availability)
- 18.2.7 Cargill
- 18.2.7.1. Overview
- 18.2.7.2. Products
- 18.2.7.3. SWOT Analysis
- 18.2.7.4. Recent Developments
- 18.2.7.5. Financials (Based on Availability)
- 18.2.8 KCM Petro Chemicals
- 18.2.8.1. Overview
- 18.2.8.2. Products
- 18.2.8.3. SWOT Analysis
- 18.2.8.4. Recent Developments
- 18.2.8.5. Financials (Based on Availability)
- 18.2.9 Chevron Corporation
- 18.2.9.1. Overview
- 18.2.9.2. Products
- 18.2.9.3. SWOT Analysis
- 18.2.9.4. Recent Developments
- 18.2.9.5. Financials (Based on Availability)
- 18.2.10 Novvi LLC
- 18.2.10.1. Overview
- 18.2.10.2. Products
- 18.2.10.3. SWOT Analysis
- 18.2.10.4. Recent Developments
- 18.2.10.5. Financials (Based on Availability)
- 18.2.11 Axel Christiernsson
- 18.2.11.1. Overview
- 18.2.11.2. Products
- 18.2.11.3. SWOT Analysis
- 18.2.11.4. Recent Developments
- 18.2.11.5. Financials (Based on Availability)
- 18.2.12 Environmental Lubricants Manufacturing Inc
- 18.2.12.1. Overview
- 18.2.12.2. Products
- 18.2.12.3. SWOT Analysis
- 18.2.12.4. Recent Developments
- 18.2.12.5. Financials (Based on Availability)
- 18.2.13 PANOLIN AG
- 18.2.13.1. Overview
- 18.2.13.2. Products
- 18.2.13.3. SWOT Analysis
- 18.2.13.4. Recent Developments
- 18.2.13.5. Financials (Based on Availability)
- 18.2.14 BP p l c
- 18.2.14.1. Overview
- 18.2.14.2. Products
- 18.2.14.3. SWOT Analysis
- 18.2.14.4. Recent Developments
- 18.2.14.5. Financials (Based on Availability)
- 18.2.1 Carl Bechem Lubricants India Private Limited
List of Figures
- Figure 1: Global Bio-Lubricants Industry Revenue Breakdown (Million, %) by Region 2024 & 2032
- Figure 2: Global Bio-Lubricants Industry Volume Breakdown (K Tons, %) by Region 2024 & 2032
- Figure 3: Asia Pacific Bio-Lubricants Industry Revenue (Million), by Country 2024 & 2032
- Figure 4: Asia Pacific Bio-Lubricants Industry Volume (K Tons), by Country 2024 & 2032
- Figure 5: Asia Pacific Bio-Lubricants Industry Revenue Share (%), by Country 2024 & 2032
- Figure 6: Asia Pacific Bio-Lubricants Industry Volume Share (%), by Country 2024 & 2032
- Figure 7: North America Bio-Lubricants Industry Revenue (Million), by Country 2024 & 2032
- Figure 8: North America Bio-Lubricants Industry Volume (K Tons), by Country 2024 & 2032
- Figure 9: North America Bio-Lubricants Industry Revenue Share (%), by Country 2024 & 2032
- Figure 10: North America Bio-Lubricants Industry Volume Share (%), by Country 2024 & 2032
- Figure 11: Europe Bio-Lubricants Industry Revenue (Million), by Country 2024 & 2032
- Figure 12: Europe Bio-Lubricants Industry Volume (K Tons), by Country 2024 & 2032
- Figure 13: Europe Bio-Lubricants Industry Revenue Share (%), by Country 2024 & 2032
- Figure 14: Europe Bio-Lubricants Industry Volume Share (%), by Country 2024 & 2032
- Figure 15: South America Bio-Lubricants Industry Revenue (Million), by Country 2024 & 2032
- Figure 16: South America Bio-Lubricants Industry Volume (K Tons), by Country 2024 & 2032
- Figure 17: South America Bio-Lubricants Industry Revenue Share (%), by Country 2024 & 2032
- Figure 18: South America Bio-Lubricants Industry Volume Share (%), by Country 2024 & 2032
- Figure 19: Middle East Bio-Lubricants Industry Revenue (Million), by Country 2024 & 2032
- Figure 20: Middle East Bio-Lubricants Industry Volume (K Tons), by Country 2024 & 2032
- Figure 21: Middle East Bio-Lubricants Industry Revenue Share (%), by Country 2024 & 2032
- Figure 22: Middle East Bio-Lubricants Industry Volume Share (%), by Country 2024 & 2032
- Figure 23: Saudi Arabia Bio-Lubricants Industry Revenue (Million), by Country 2024 & 2032
- Figure 24: Saudi Arabia Bio-Lubricants Industry Volume (K Tons), by Country 2024 & 2032
- Figure 25: Saudi Arabia Bio-Lubricants Industry Revenue Share (%), by Country 2024 & 2032
- Figure 26: Saudi Arabia Bio-Lubricants Industry Volume Share (%), by Country 2024 & 2032
- Figure 27: Asia Pacific Bio-Lubricants Industry Revenue (Million), by Product Type 2024 & 2032
- Figure 28: Asia Pacific Bio-Lubricants Industry Volume (K Tons), by Product Type 2024 & 2032
- Figure 29: Asia Pacific Bio-Lubricants Industry Revenue Share (%), by Product Type 2024 & 2032
- Figure 30: Asia Pacific Bio-Lubricants Industry Volume Share (%), by Product Type 2024 & 2032
- Figure 31: Asia Pacific Bio-Lubricants Industry Revenue (Million), by End-user Industry 2024 & 2032
- Figure 32: Asia Pacific Bio-Lubricants Industry Volume (K Tons), by End-user Industry 2024 & 2032
- Figure 33: Asia Pacific Bio-Lubricants Industry Revenue Share (%), by End-user Industry 2024 & 2032
- Figure 34: Asia Pacific Bio-Lubricants Industry Volume Share (%), by End-user Industry 2024 & 2032
- Figure 35: Asia Pacific Bio-Lubricants Industry Revenue (Million), by Country 2024 & 2032
- Figure 36: Asia Pacific Bio-Lubricants Industry Volume (K Tons), by Country 2024 & 2032
- Figure 37: Asia Pacific Bio-Lubricants Industry Revenue Share (%), by Country 2024 & 2032
- Figure 38: Asia Pacific Bio-Lubricants Industry Volume Share (%), by Country 2024 & 2032
- Figure 39: North America Bio-Lubricants Industry Revenue (Million), by Product Type 2024 & 2032
- Figure 40: North America Bio-Lubricants Industry Volume (K Tons), by Product Type 2024 & 2032
- Figure 41: North America Bio-Lubricants Industry Revenue Share (%), by Product Type 2024 & 2032
- Figure 42: North America Bio-Lubricants Industry Volume Share (%), by Product Type 2024 & 2032
- Figure 43: North America Bio-Lubricants Industry Revenue (Million), by End-user Industry 2024 & 2032
- Figure 44: North America Bio-Lubricants Industry Volume (K Tons), by End-user Industry 2024 & 2032
- Figure 45: North America Bio-Lubricants Industry Revenue Share (%), by End-user Industry 2024 & 2032
- Figure 46: North America Bio-Lubricants Industry Volume Share (%), by End-user Industry 2024 & 2032
- Figure 47: North America Bio-Lubricants Industry Revenue (Million), by Country 2024 & 2032
- Figure 48: North America Bio-Lubricants Industry Volume (K Tons), by Country 2024 & 2032
- Figure 49: North America Bio-Lubricants Industry Revenue Share (%), by Country 2024 & 2032
- Figure 50: North America Bio-Lubricants Industry Volume Share (%), by Country 2024 & 2032
- Figure 51: Europe Bio-Lubricants Industry Revenue (Million), by Product Type 2024 & 2032
- Figure 52: Europe Bio-Lubricants Industry Volume (K Tons), by Product Type 2024 & 2032
- Figure 53: Europe Bio-Lubricants Industry Revenue Share (%), by Product Type 2024 & 2032
- Figure 54: Europe Bio-Lubricants Industry Volume Share (%), by Product Type 2024 & 2032
- Figure 55: Europe Bio-Lubricants Industry Revenue (Million), by End-user Industry 2024 & 2032
- Figure 56: Europe Bio-Lubricants Industry Volume (K Tons), by End-user Industry 2024 & 2032
- Figure 57: Europe Bio-Lubricants Industry Revenue Share (%), by End-user Industry 2024 & 2032
- Figure 58: Europe Bio-Lubricants Industry Volume Share (%), by End-user Industry 2024 & 2032
- Figure 59: Europe Bio-Lubricants Industry Revenue (Million), by Country 2024 & 2032
- Figure 60: Europe Bio-Lubricants Industry Volume (K Tons), by Country 2024 & 2032
- Figure 61: Europe Bio-Lubricants Industry Revenue Share (%), by Country 2024 & 2032
- Figure 62: Europe Bio-Lubricants Industry Volume Share (%), by Country 2024 & 2032
- Figure 63: South America Bio-Lubricants Industry Revenue (Million), by Product Type 2024 & 2032
- Figure 64: South America Bio-Lubricants Industry Volume (K Tons), by Product Type 2024 & 2032
- Figure 65: South America Bio-Lubricants Industry Revenue Share (%), by Product Type 2024 & 2032
- Figure 66: South America Bio-Lubricants Industry Volume Share (%), by Product Type 2024 & 2032
- Figure 67: South America Bio-Lubricants Industry Revenue (Million), by End-user Industry 2024 & 2032
- Figure 68: South America Bio-Lubricants Industry Volume (K Tons), by End-user Industry 2024 & 2032
- Figure 69: South America Bio-Lubricants Industry Revenue Share (%), by End-user Industry 2024 & 2032
- Figure 70: South America Bio-Lubricants Industry Volume Share (%), by End-user Industry 2024 & 2032
- Figure 71: South America Bio-Lubricants Industry Revenue (Million), by Country 2024 & 2032
- Figure 72: South America Bio-Lubricants Industry Volume (K Tons), by Country 2024 & 2032
- Figure 73: South America Bio-Lubricants Industry Revenue Share (%), by Country 2024 & 2032
- Figure 74: South America Bio-Lubricants Industry Volume Share (%), by Country 2024 & 2032
- Figure 75: Middle East Bio-Lubricants Industry Revenue (Million), by Product Type 2024 & 2032
- Figure 76: Middle East Bio-Lubricants Industry Volume (K Tons), by Product Type 2024 & 2032
- Figure 77: Middle East Bio-Lubricants Industry Revenue Share (%), by Product Type 2024 & 2032
- Figure 78: Middle East Bio-Lubricants Industry Volume Share (%), by Product Type 2024 & 2032
- Figure 79: Middle East Bio-Lubricants Industry Revenue (Million), by End-user Industry 2024 & 2032
- Figure 80: Middle East Bio-Lubricants Industry Volume (K Tons), by End-user Industry 2024 & 2032
- Figure 81: Middle East Bio-Lubricants Industry Revenue Share (%), by End-user Industry 2024 & 2032
- Figure 82: Middle East Bio-Lubricants Industry Volume Share (%), by End-user Industry 2024 & 2032
- Figure 83: Middle East Bio-Lubricants Industry Revenue (Million), by Country 2024 & 2032
- Figure 84: Middle East Bio-Lubricants Industry Volume (K Tons), by Country 2024 & 2032
- Figure 85: Middle East Bio-Lubricants Industry Revenue Share (%), by Country 2024 & 2032
- Figure 86: Middle East Bio-Lubricants Industry Volume Share (%), by Country 2024 & 2032
- Figure 87: Saudi Arabia Bio-Lubricants Industry Revenue (Million), by Product Type 2024 & 2032
- Figure 88: Saudi Arabia Bio-Lubricants Industry Volume (K Tons), by Product Type 2024 & 2032
- Figure 89: Saudi Arabia Bio-Lubricants Industry Revenue Share (%), by Product Type 2024 & 2032
- Figure 90: Saudi Arabia Bio-Lubricants Industry Volume Share (%), by Product Type 2024 & 2032
- Figure 91: Saudi Arabia Bio-Lubricants Industry Revenue (Million), by End-user Industry 2024 & 2032
- Figure 92: Saudi Arabia Bio-Lubricants Industry Volume (K Tons), by End-user Industry 2024 & 2032
- Figure 93: Saudi Arabia Bio-Lubricants Industry Revenue Share (%), by End-user Industry 2024 & 2032
- Figure 94: Saudi Arabia Bio-Lubricants Industry Volume Share (%), by End-user Industry 2024 & 2032
- Figure 95: Saudi Arabia Bio-Lubricants Industry Revenue (Million), by Country 2024 & 2032
- Figure 96: Saudi Arabia Bio-Lubricants Industry Volume (K Tons), by Country 2024 & 2032
- Figure 97: Saudi Arabia Bio-Lubricants Industry Revenue Share (%), by Country 2024 & 2032
- Figure 98: Saudi Arabia Bio-Lubricants Industry Volume Share (%), by Country 2024 & 2032
List of Tables
- Table 1: Global Bio-Lubricants Industry Revenue Million Forecast, by Region 2019 & 2032
- Table 2: Global Bio-Lubricants Industry Volume K Tons Forecast, by Region 2019 & 2032
- Table 3: Global Bio-Lubricants Industry Revenue Million Forecast, by Product Type 2019 & 2032
- Table 4: Global Bio-Lubricants Industry Volume K Tons Forecast, by Product Type 2019 & 2032
- Table 5: Global Bio-Lubricants Industry Revenue Million Forecast, by End-user Industry 2019 & 2032
- Table 6: Global Bio-Lubricants Industry Volume K Tons Forecast, by End-user Industry 2019 & 2032
- Table 7: Global Bio-Lubricants Industry Revenue Million Forecast, by Region 2019 & 2032
- Table 8: Global Bio-Lubricants Industry Volume K Tons Forecast, by Region 2019 & 2032
- Table 9: Global Bio-Lubricants Industry Revenue Million Forecast, by Country 2019 & 2032
- Table 10: Global Bio-Lubricants Industry Volume K Tons Forecast, by Country 2019 & 2032
- Table 11: China Bio-Lubricants Industry Revenue (Million) Forecast, by Application 2019 & 2032
- Table 12: China Bio-Lubricants Industry Volume (K Tons) Forecast, by Application 2019 & 2032
- Table 13: India Bio-Lubricants Industry Revenue (Million) Forecast, by Application 2019 & 2032
- Table 14: India Bio-Lubricants Industry Volume (K Tons) Forecast, by Application 2019 & 2032
- Table 15: Japan Bio-Lubricants Industry Revenue (Million) Forecast, by Application 2019 & 2032
- Table 16: Japan Bio-Lubricants Industry Volume (K Tons) Forecast, by Application 2019 & 2032
- Table 17: South Korea Bio-Lubricants Industry Revenue (Million) Forecast, by Application 2019 & 2032
- Table 18: South Korea Bio-Lubricants Industry Volume (K Tons) Forecast, by Application 2019 & 2032
- Table 19: Rest of Asia Pacific Bio-Lubricants Industry Revenue (Million) Forecast, by Application 2019 & 2032
- Table 20: Rest of Asia Pacific Bio-Lubricants Industry Volume (K Tons) Forecast, by Application 2019 & 2032
- Table 21: Global Bio-Lubricants Industry Revenue Million Forecast, by Country 2019 & 2032
- Table 22: Global Bio-Lubricants Industry Volume K Tons Forecast, by Country 2019 & 2032
- Table 23: United States Bio-Lubricants Industry Revenue (Million) Forecast, by Application 2019 & 2032
- Table 24: United States Bio-Lubricants Industry Volume (K Tons) Forecast, by Application 2019 & 2032
- Table 25: Canada Bio-Lubricants Industry Revenue (Million) Forecast, by Application 2019 & 2032
- Table 26: Canada Bio-Lubricants Industry Volume (K Tons) Forecast, by Application 2019 & 2032
- Table 27: Mexico Bio-Lubricants Industry Revenue (Million) Forecast, by Application 2019 & 2032
- Table 28: Mexico Bio-Lubricants Industry Volume (K Tons) Forecast, by Application 2019 & 2032
- Table 29: Rest of North America Bio-Lubricants Industry Revenue (Million) Forecast, by Application 2019 & 2032
- Table 30: Rest of North America Bio-Lubricants Industry Volume (K Tons) Forecast, by Application 2019 & 2032
- Table 31: Global Bio-Lubricants Industry Revenue Million Forecast, by Country 2019 & 2032
- Table 32: Global Bio-Lubricants Industry Volume K Tons Forecast, by Country 2019 & 2032
- Table 33: Germany Bio-Lubricants Industry Revenue (Million) Forecast, by Application 2019 & 2032
- Table 34: Germany Bio-Lubricants Industry Volume (K Tons) Forecast, by Application 2019 & 2032
- Table 35: United Kingdom Bio-Lubricants Industry Revenue (Million) Forecast, by Application 2019 & 2032
- Table 36: United Kingdom Bio-Lubricants Industry Volume (K Tons) Forecast, by Application 2019 & 2032
- Table 37: Italy Bio-Lubricants Industry Revenue (Million) Forecast, by Application 2019 & 2032
- Table 38: Italy Bio-Lubricants Industry Volume (K Tons) Forecast, by Application 2019 & 2032
- Table 39: France Bio-Lubricants Industry Revenue (Million) Forecast, by Application 2019 & 2032
- Table 40: France Bio-Lubricants Industry Volume (K Tons) Forecast, by Application 2019 & 2032
- Table 41: Russia Bio-Lubricants Industry Revenue (Million) Forecast, by Application 2019 & 2032
- Table 42: Russia Bio-Lubricants Industry Volume (K Tons) Forecast, by Application 2019 & 2032
- Table 43: Rest of Europe Bio-Lubricants Industry Revenue (Million) Forecast, by Application 2019 & 2032
- Table 44: Rest of Europe Bio-Lubricants Industry Volume (K Tons) Forecast, by Application 2019 & 2032
- Table 45: Global Bio-Lubricants Industry Revenue Million Forecast, by Country 2019 & 2032
- Table 46: Global Bio-Lubricants Industry Volume K Tons Forecast, by Country 2019 & 2032
- Table 47: Brazil Bio-Lubricants Industry Revenue (Million) Forecast, by Application 2019 & 2032
- Table 48: Brazil Bio-Lubricants Industry Volume (K Tons) Forecast, by Application 2019 & 2032
- Table 49: Argentina Bio-Lubricants Industry Revenue (Million) Forecast, by Application 2019 & 2032
- Table 50: Argentina Bio-Lubricants Industry Volume (K Tons) Forecast, by Application 2019 & 2032
- Table 51: Rest of South America Bio-Lubricants Industry Revenue (Million) Forecast, by Application 2019 & 2032
- Table 52: Rest of South America Bio-Lubricants Industry Volume (K Tons) Forecast, by Application 2019 & 2032
- Table 53: Global Bio-Lubricants Industry Revenue Million Forecast, by Country 2019 & 2032
- Table 54: Global Bio-Lubricants Industry Volume K Tons Forecast, by Country 2019 & 2032
- Table 55: Bio-Lubricants Industry Revenue (Million) Forecast, by Application 2019 & 2032
- Table 56: Bio-Lubricants Industry Volume (K Tons) Forecast, by Application 2019 & 2032
- Table 57: Global Bio-Lubricants Industry Revenue Million Forecast, by Country 2019 & 2032
- Table 58: Global Bio-Lubricants Industry Volume K Tons Forecast, by Country 2019 & 2032
- Table 59: South Africa Bio-Lubricants Industry Revenue (Million) Forecast, by Application 2019 & 2032
- Table 60: South Africa Bio-Lubricants Industry Volume (K Tons) Forecast, by Application 2019 & 2032
- Table 61: United Arab Emirates Bio-Lubricants Industry Revenue (Million) Forecast, by Application 2019 & 2032
- Table 62: United Arab Emirates Bio-Lubricants Industry Volume (K Tons) Forecast, by Application 2019 & 2032
- Table 63: Rest of Middle East Bio-Lubricants Industry Revenue (Million) Forecast, by Application 2019 & 2032
- Table 64: Rest of Middle East Bio-Lubricants Industry Volume (K Tons) Forecast, by Application 2019 & 2032
- Table 65: Global Bio-Lubricants Industry Revenue Million Forecast, by Product Type 2019 & 2032
- Table 66: Global Bio-Lubricants Industry Volume K Tons Forecast, by Product Type 2019 & 2032
- Table 67: Global Bio-Lubricants Industry Revenue Million Forecast, by End-user Industry 2019 & 2032
- Table 68: Global Bio-Lubricants Industry Volume K Tons Forecast, by End-user Industry 2019 & 2032
- Table 69: Global Bio-Lubricants Industry Revenue Million Forecast, by Country 2019 & 2032
- Table 70: Global Bio-Lubricants Industry Volume K Tons Forecast, by Country 2019 & 2032
- Table 71: China Bio-Lubricants Industry Revenue (Million) Forecast, by Application 2019 & 2032
- Table 72: China Bio-Lubricants Industry Volume (K Tons) Forecast, by Application 2019 & 2032
- Table 73: India Bio-Lubricants Industry Revenue (Million) Forecast, by Application 2019 & 2032
- Table 74: India Bio-Lubricants Industry Volume (K Tons) Forecast, by Application 2019 & 2032
- Table 75: Japan Bio-Lubricants Industry Revenue (Million) Forecast, by Application 2019 & 2032
- Table 76: Japan Bio-Lubricants Industry Volume (K Tons) Forecast, by Application 2019 & 2032
- Table 77: South Korea Bio-Lubricants Industry Revenue (Million) Forecast, by Application 2019 & 2032
- Table 78: South Korea Bio-Lubricants Industry Volume (K Tons) Forecast, by Application 2019 & 2032
- Table 79: Rest of Asia Pacific Bio-Lubricants Industry Revenue (Million) Forecast, by Application 2019 & 2032
- Table 80: Rest of Asia Pacific Bio-Lubricants Industry Volume (K Tons) Forecast, by Application 2019 & 2032
- Table 81: Global Bio-Lubricants Industry Revenue Million Forecast, by Product Type 2019 & 2032
- Table 82: Global Bio-Lubricants Industry Volume K Tons Forecast, by Product Type 2019 & 2032
- Table 83: Global Bio-Lubricants Industry Revenue Million Forecast, by End-user Industry 2019 & 2032
- Table 84: Global Bio-Lubricants Industry Volume K Tons Forecast, by End-user Industry 2019 & 2032
- Table 85: Global Bio-Lubricants Industry Revenue Million Forecast, by Country 2019 & 2032
- Table 86: Global Bio-Lubricants Industry Volume K Tons Forecast, by Country 2019 & 2032
- Table 87: United States Bio-Lubricants Industry Revenue (Million) Forecast, by Application 2019 & 2032
- Table 88: United States Bio-Lubricants Industry Volume (K Tons) Forecast, by Application 2019 & 2032
- Table 89: Canada Bio-Lubricants Industry Revenue (Million) Forecast, by Application 2019 & 2032
- Table 90: Canada Bio-Lubricants Industry Volume (K Tons) Forecast, by Application 2019 & 2032
- Table 91: Mexico Bio-Lubricants Industry Revenue (Million) Forecast, by Application 2019 & 2032
- Table 92: Mexico Bio-Lubricants Industry Volume (K Tons) Forecast, by Application 2019 & 2032
- Table 93: Rest of North America Bio-Lubricants Industry Revenue (Million) Forecast, by Application 2019 & 2032
- Table 94: Rest of North America Bio-Lubricants Industry Volume (K Tons) Forecast, by Application 2019 & 2032
- Table 95: Global Bio-Lubricants Industry Revenue Million Forecast, by Product Type 2019 & 2032
- Table 96: Global Bio-Lubricants Industry Volume K Tons Forecast, by Product Type 2019 & 2032
- Table 97: Global Bio-Lubricants Industry Revenue Million Forecast, by End-user Industry 2019 & 2032
- Table 98: Global Bio-Lubricants Industry Volume K Tons Forecast, by End-user Industry 2019 & 2032
- Table 99: Global Bio-Lubricants Industry Revenue Million Forecast, by Country 2019 & 2032
- Table 100: Global Bio-Lubricants Industry Volume K Tons Forecast, by Country 2019 & 2032
- Table 101: Germany Bio-Lubricants Industry Revenue (Million) Forecast, by Application 2019 & 2032
- Table 102: Germany Bio-Lubricants Industry Volume (K Tons) Forecast, by Application 2019 & 2032
- Table 103: United Kingdom Bio-Lubricants Industry Revenue (Million) Forecast, by Application 2019 & 2032
- Table 104: United Kingdom Bio-Lubricants Industry Volume (K Tons) Forecast, by Application 2019 & 2032
- Table 105: Italy Bio-Lubricants Industry Revenue (Million) Forecast, by Application 2019 & 2032
- Table 106: Italy Bio-Lubricants Industry Volume (K Tons) Forecast, by Application 2019 & 2032
- Table 107: France Bio-Lubricants Industry Revenue (Million) Forecast, by Application 2019 & 2032
- Table 108: France Bio-Lubricants Industry Volume (K Tons) Forecast, by Application 2019 & 2032
- Table 109: Russia Bio-Lubricants Industry Revenue (Million) Forecast, by Application 2019 & 2032
- Table 110: Russia Bio-Lubricants Industry Volume (K Tons) Forecast, by Application 2019 & 2032
- Table 111: Rest of Europe Bio-Lubricants Industry Revenue (Million) Forecast, by Application 2019 & 2032
- Table 112: Rest of Europe Bio-Lubricants Industry Volume (K Tons) Forecast, by Application 2019 & 2032
- Table 113: Global Bio-Lubricants Industry Revenue Million Forecast, by Product Type 2019 & 2032
- Table 114: Global Bio-Lubricants Industry Volume K Tons Forecast, by Product Type 2019 & 2032
- Table 115: Global Bio-Lubricants Industry Revenue Million Forecast, by End-user Industry 2019 & 2032
- Table 116: Global Bio-Lubricants Industry Volume K Tons Forecast, by End-user Industry 2019 & 2032
- Table 117: Global Bio-Lubricants Industry Revenue Million Forecast, by Country 2019 & 2032
- Table 118: Global Bio-Lubricants Industry Volume K Tons Forecast, by Country 2019 & 2032
- Table 119: Brazil Bio-Lubricants Industry Revenue (Million) Forecast, by Application 2019 & 2032
- Table 120: Brazil Bio-Lubricants Industry Volume (K Tons) Forecast, by Application 2019 & 2032
- Table 121: Argentina Bio-Lubricants Industry Revenue (Million) Forecast, by Application 2019 & 2032
- Table 122: Argentina Bio-Lubricants Industry Volume (K Tons) Forecast, by Application 2019 & 2032
- Table 123: Rest of South America Bio-Lubricants Industry Revenue (Million) Forecast, by Application 2019 & 2032
- Table 124: Rest of South America Bio-Lubricants Industry Volume (K Tons) Forecast, by Application 2019 & 2032
- Table 125: Global Bio-Lubricants Industry Revenue Million Forecast, by Product Type 2019 & 2032
- Table 126: Global Bio-Lubricants Industry Volume K Tons Forecast, by Product Type 2019 & 2032
- Table 127: Global Bio-Lubricants Industry Revenue Million Forecast, by End-user Industry 2019 & 2032
- Table 128: Global Bio-Lubricants Industry Volume K Tons Forecast, by End-user Industry 2019 & 2032
- Table 129: Global Bio-Lubricants Industry Revenue Million Forecast, by Country 2019 & 2032
- Table 130: Global Bio-Lubricants Industry Volume K Tons Forecast, by Country 2019 & 2032
- Table 131: Global Bio-Lubricants Industry Revenue Million Forecast, by Product Type 2019 & 2032
- Table 132: Global Bio-Lubricants Industry Volume K Tons Forecast, by Product Type 2019 & 2032
- Table 133: Global Bio-Lubricants Industry Revenue Million Forecast, by End-user Industry 2019 & 2032
- Table 134: Global Bio-Lubricants Industry Volume K Tons Forecast, by End-user Industry 2019 & 2032
- Table 135: Global Bio-Lubricants Industry Revenue Million Forecast, by Country 2019 & 2032
- Table 136: Global Bio-Lubricants Industry Volume K Tons Forecast, by Country 2019 & 2032
- Table 137: South Africa Bio-Lubricants Industry Revenue (Million) Forecast, by Application 2019 & 2032
- Table 138: South Africa Bio-Lubricants Industry Volume (K Tons) Forecast, by Application 2019 & 2032
- Table 139: United Arab Emirates Bio-Lubricants Industry Revenue (Million) Forecast, by Application 2019 & 2032
- Table 140: United Arab Emirates Bio-Lubricants Industry Volume (K Tons) Forecast, by Application 2019 & 2032
- Table 141: Rest of Middle East Bio-Lubricants Industry Revenue (Million) Forecast, by Application 2019 & 2032
- Table 142: Rest of Middle East Bio-Lubricants Industry Volume (K Tons) Forecast, by Application 2019 & 2032
Frequently Asked Questions
1. What is the projected Compound Annual Growth Rate (CAGR) of the Bio-Lubricants Industry?
The projected CAGR is approximately > 3.00%.
2. Which companies are prominent players in the Bio-Lubricants Industry?
Key companies in the market include Carl Bechem Lubricants India Private Limited, Shell plc, TotalEnergies*List Not Exhaustive, Exxon Mobil Corporation, Cortec Corporation, FUCHS, Cargill, KCM Petro Chemicals, Chevron Corporation, Novvi LLC, Axel Christiernsson, Environmental Lubricants Manufacturing Inc, PANOLIN AG, BP p l c.
3. What are the main segments of the Bio-Lubricants Industry?
The market segments include Product Type, End-user Industry.
4. Can you provide details about the market size?
The market size is estimated to be USD XX Million as of 2022.
5. What are some drivers contributing to market growth?
Regulatory Norms Driving the Demand for Bio-based Lubricants; Other Drivers.
6. What are the notable trends driving market growth?
Increase in Demand for Bio-Lubricants in Automotive and Transportation Sector.
7. Are there any restraints impacting market growth?
High Price of Bio-based Lubricants; Other Restraints.
8. Can you provide examples of recent developments in the market?
November 2022: Wholly-owned subsidiaries of Shell plc in Switzerland, the United Kingdom, the United States, and Sweden entered into agreements to acquire the environmentally considerate lubricants (ECLs) business of the Panolin Group. This transaction brings with it an offering of biodegradable lubricants.
9. What pricing options are available for accessing the report?
Pricing options include single-user, multi-user, and enterprise licenses priced at USD 4750, USD 5250, and USD 8750 respectively.
10. Is the market size provided in terms of value or volume?
The market size is provided in terms of value, measured in Million and volume, measured in K Tons.
11. Are there any specific market keywords associated with the report?
Yes, the market keyword associated with the report is "Bio-Lubricants Industry," which aids in identifying and referencing the specific market segment covered.
12. How do I determine which pricing option suits my needs best?
The pricing options vary based on user requirements and access needs. Individual users may opt for single-user licenses, while businesses requiring broader access may choose multi-user or enterprise licenses for cost-effective access to the report.
13. Are there any additional resources or data provided in the Bio-Lubricants Industry report?
While the report offers comprehensive insights, it's advisable to review the specific contents or supplementary materials provided to ascertain if additional resources or data are available.
14. How can I stay updated on further developments or reports in the Bio-Lubricants Industry?
To stay informed about further developments, trends, and reports in the Bio-Lubricants Industry, consider subscribing to industry newsletters, following relevant companies and organizations, or regularly checking reputable industry news sources and publications.
Methodology
Step 1 - Identification of Relevant Samples Size from Population Database


Step 2 - Approaches for Defining Global Market Size (Value, Volume* & Price*)

Note*: In applicable scenarios
Step 3 - Data Sources
Primary Research
- Web Analytics
- Survey Reports
- Research Institute
- Latest Research Reports
- Opinion Leaders
Secondary Research
- Annual Reports
- White Paper
- Latest Press Release
- Industry Association
- Paid Database
- Investor Presentations

Step 4 - Data Triangulation
Involves using different sources of information in order to increase the validity of a study
These sources are likely to be stakeholders in a program - participants, other researchers, program staff, other community members, and so on.
Then we put all data in single framework & apply various statistical tools to find out the dynamic on the market.
During the analysis stage, feedback from the stakeholder groups would be compared to determine areas of agreement as well as areas of divergence


