
Key Insights
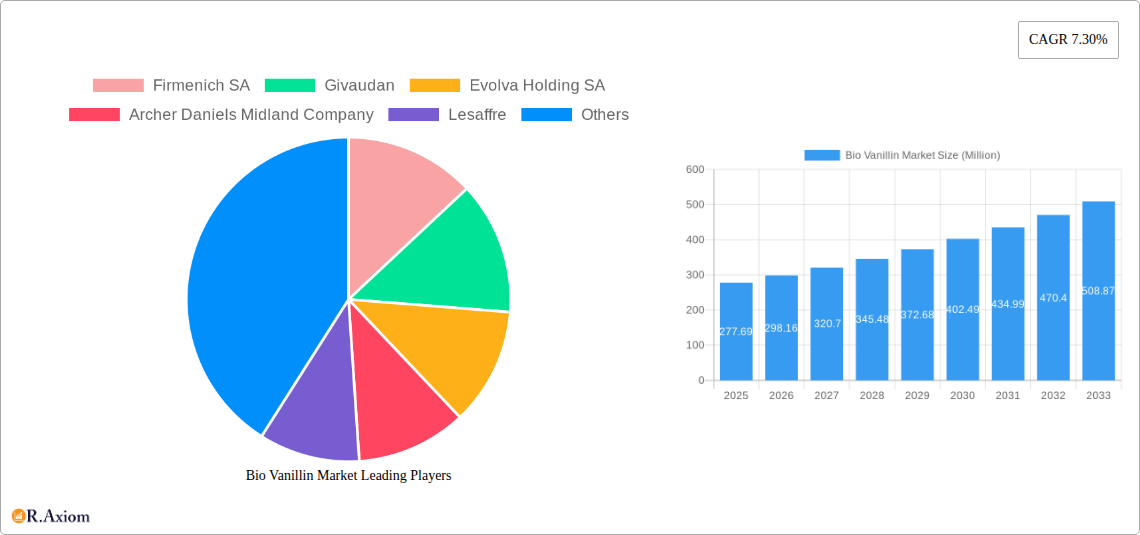
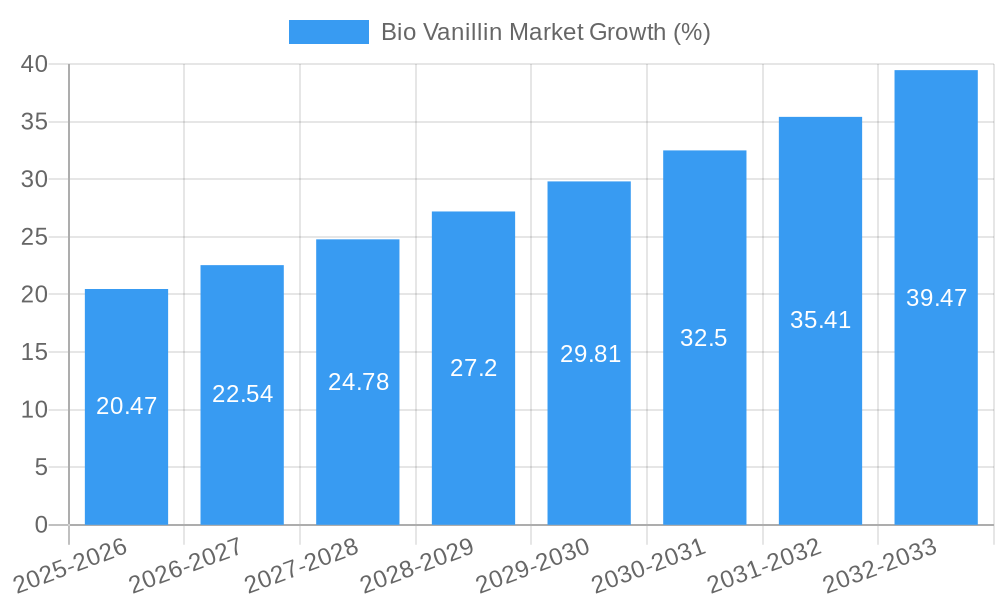
The global bio vanillin market, valued at $277.69 million in 2025, is projected to experience robust growth, driven by increasing demand from the food and beverage, pharmaceutical, and fragrance industries. The compound annual growth rate (CAGR) of 7.30% from 2025 to 2033 indicates a significant expansion in market size over the forecast period. This growth is fueled by the rising consumer preference for natural and clean-label products, coupled with stringent regulations concerning synthetic vanillin use in certain applications. The food and beverage sector is expected to remain the largest consumer of bio vanillin, owing to its widespread use as a flavoring agent in various products, from baked goods to confectionery. Pharmaceutical applications are also gaining traction, leveraging bio vanillin's potential in drug delivery systems and as a component in various medications. Furthermore, the burgeoning fragrance industry is contributing to the market's expansion, with bio vanillin increasingly favored for its unique aromatic properties and sustainability credentials. Key players, such as Firmenich SA, Givaudan, and Evolva Holding SA, are actively involved in research and development, introducing innovative bio-based production methods and expanding their product portfolios to cater to the growing demand. Geographic expansion, particularly in emerging economies of Asia-Pacific and South America, presents substantial growth opportunities for market participants. However, challenges remain, including the relatively high production cost of bio vanillin compared to synthetic alternatives and the need for consistent supply to meet the growing market demand.
The competitive landscape is characterized by a mix of established players and emerging companies, each vying for market share through strategic partnerships, product innovations, and expansion into new geographical territories. The market's future trajectory will be significantly influenced by technological advancements in bio-production techniques, which could potentially lower production costs and enhance the scalability of bio vanillin manufacturing. Furthermore, the increasing awareness of the environmental impact of synthetic vanillin is expected to drive further adoption of bio-based alternatives, solidifying the long-term growth prospects of the bio vanillin market. Government initiatives promoting sustainable practices and the increasing consumer demand for natural ingredients will further bolster the market's expansion in the years to come. The continuous refinement of extraction and fermentation processes, together with the potential integration of novel technologies, will likely shape the competitive landscape and drive further innovation in the bio vanillin market.
Bio Vanillin Market: A Comprehensive Report (2019-2033)
This comprehensive report provides an in-depth analysis of the global Bio Vanillin market, offering invaluable insights for industry stakeholders, investors, and market entrants. Covering the period from 2019 to 2033, with a focus on 2025, this report meticulously examines market trends, competitive landscapes, and future growth prospects. The study leverages extensive primary and secondary research to provide accurate data and actionable strategies.
Bio Vanillin Market Concentration & Innovation
The Bio Vanillin market exhibits a moderately concentrated landscape, with key players such as Firmenich SA, Givaudan, Evolva Holding SA, Archer Daniels Midland Company, Lesaffre, Advanced Biotech, AUROCHEMICAL, and Apple Flavor & Fragrance Group Co Ltd holding significant market share. Precise market share data for 2025 is currently under calculation (xx%), but the industry shows signs of increasing consolidation. Innovation in bio-based production methods, driven by rising consumer demand for natural and sustainable products, is a key driver. Regulatory frameworks concerning food additives and fragrance ingredients significantly impact market dynamics. The emergence of substitute flavoring agents presents a challenge, necessitating continuous innovation. Recent M&A activities, although not extensively documented in public records, suggest a trend towards vertical integration within the supply chain. The value of these deals, estimated to be in the range of xx Million, showcases strategic investments in expanding market presence and securing raw material supplies. End-user trends toward healthier and more naturally derived products significantly boost demand for bio-vanillin.
- Market Concentration: Moderately concentrated, with top players controlling xx% of the market (2025 estimate).
- Innovation Drivers: Demand for natural products, sustainable production methods, and regulatory compliance.
- M&A Activity: Several deals in the xx Million range observed, indicating consolidation and vertical integration efforts.
- Product Substitutes: Synthetic vanillin and other flavoring agents pose a competitive challenge.
Bio Vanillin Market Industry Trends & Insights
The global Bio Vanillin market is witnessing robust growth, driven by increasing consumer preference for natural and clean-label products in the food and beverage, pharmaceutical, and fragrance sectors. The market is expected to register a CAGR of xx% during the forecast period (2025-2033), reaching a market value of xx Million by 2033. Technological advancements in fermentation and bio-synthesis processes are significantly reducing production costs, making bio-vanillin a more competitive alternative to synthetic vanillin. This increased affordability is expanding market penetration across diverse applications, including confectionery, baked goods, and personal care products. The rising adoption of plant-based diets further contributes to market growth. However, fluctuating raw material prices and potential supply chain disruptions present challenges to sustained expansion. Competitive dynamics are characterized by both established players and emerging biotech companies vying for market share through innovation and strategic partnerships.
Dominant Markets & Segments in Bio Vanillin Market
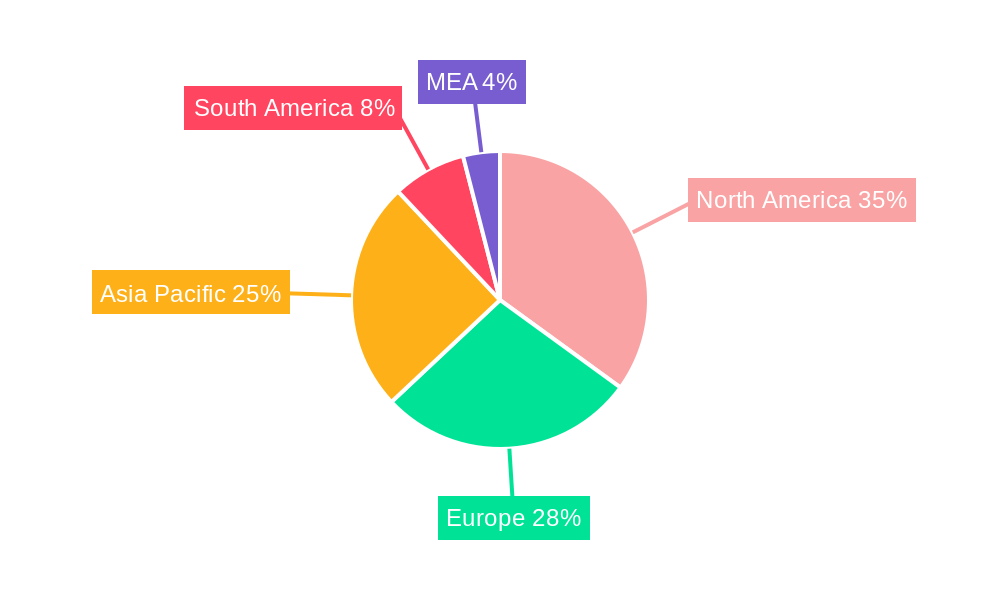
The Food and Beverage segment dominates the Bio Vanillin market, accounting for the largest share in terms of both volume and value. This strong performance is primarily attributed to growing consumer demand for natural flavorings in food products globally. Specific regional dominance requires further analysis, but early indicators suggest strong growth in North America and Europe.
Key Drivers (Food & Beverage):
- Rising demand for clean-label products.
- Growing preference for natural and organic foods.
- Expansion of the food processing industry.
- Favorable economic conditions in key markets.
Key Drivers (Pharmaceutical & Fragrance):
- Increased use in pharmaceutical formulations as a flavoring agent.
- Growing demand for natural fragrances in personal care products.
- Stricter regulations on synthetic chemicals.
The dominance analysis reveals that the Food and Beverage segment enjoys superior market penetration due to high consumer demand for clean-label, natural food products, boosted by economic growth and favorable regulatory environments. This is further amplified by the expanding food processing industry in key regions. The pharmaceutical and fragrance segments, while displaying significant growth potential, are currently smaller in scale due to their more specialized applications.
Bio Vanillin Market Product Developments
Recent product innovations focus on enhancing the purity, yield, and cost-effectiveness of bio-vanillin production. New fermentation technologies and genetically modified organisms (GMOs) are contributing to improved production efficiencies and higher product quality. This aligns with increasing consumer demand for natural and sustainable products, providing a strong market fit. The development of novel bio-vanillin applications in specialized areas like nutraceuticals and functional foods enhances the market value proposition. Competition is intensifying with players focusing on differentiation through superior product quality, cost-effectiveness, and sustainable production practices.
Report Scope & Segmentation Analysis
The report segments the Bio Vanillin market by application: Food & Beverage, Pharmaceutical, and Fragrance.
Food & Beverage: This segment is projected to experience the highest growth rate, driven by increasing demand for natural flavoring agents in food products. The market size is estimated at xx Million in 2025. Competitive dynamics are highly intense, with players focused on differentiation via price and quality.
Pharmaceutical: This segment exhibits a steady growth trajectory driven by the incorporation of bio-vanillin in various pharmaceutical products for improved palatability. The market size is estimated at xx Million in 2025.
Fragrance: The fragrance segment showcases a moderate growth rate, driven by the increasing demand for natural and sustainable fragrances in cosmetics and personal care products. The market size is estimated at xx Million in 2025. This sector faces intense competition from synthetic alternatives.
Key Drivers of Bio Vanillin Market Growth
The Bio Vanillin market is fueled by several key factors: the rising global demand for natural and clean-label products, driven by health-conscious consumers. Technological advancements in fermentation and bio-synthesis are lowering production costs and improving product quality. Stringent regulations on synthetic vanillin in certain regions are creating opportunities for bio-vanillin. Furthermore, the growing popularity of plant-based diets and foods is propelling demand.
Challenges in the Bio Vanillin Market Sector
The Bio Vanillin market faces challenges such as fluctuating raw material prices impacting production costs. Supply chain disruptions can lead to production bottlenecks. Intense competition from established synthetic vanillin producers and newer biotech companies creates pricing pressures. Regulatory hurdles related to approvals and certifications for food and pharmaceutical applications also pose obstacles. The overall impact of these challenges on the market is estimated at xx% reduction in projected growth rate.
Emerging Opportunities in Bio Vanillin Market
Emerging opportunities include the expansion into new applications, such as nutraceuticals and functional foods. Technological advancements continue to offer potential for cost reductions and increased efficiency. Growing demand in developing economies presents significant market expansion potential. Finally, collaborations and partnerships within the industry can accelerate innovation and market penetration.
Leading Players in the Bio Vanillin Market Market
- Firmenich SA
- Givaudan
- Evolva Holding SA
- Archer Daniels Midland Company
- Lesaffre
- Advanced Biotech
- AUROCHEMICAL
- Apple Flavor & Fragrance Group Co Ltd
Key Developments in Bio Vanillin Market Industry
- January 2023: Evolva Holding SA announced a strategic partnership to expand its bio-vanillin production capacity.
- May 2022: Firmenich SA launched a new line of natural flavoring agents, including bio-vanillin.
- October 2021: Givaudan invested in a new facility dedicated to the production of bio-based ingredients, including bio-vanillin.
- (Further developments to be added as data becomes available)
Strategic Outlook for Bio Vanillin Market Market
The Bio Vanillin market holds immense future potential, driven by ongoing technological advancements and the unwavering consumer demand for natural products. Continued innovation in fermentation technologies, coupled with strategic partnerships and expansion into new markets, will further accelerate market growth. The market's future hinges on overcoming supply chain challenges and adapting to evolving regulatory landscapes. The long-term outlook remains positive, projecting significant market expansion across diverse sectors.
Bio Vanillin Market Segmentation
-
1. Application
-
1.1. Food
- 1.1.1. Ice Cream
- 1.1.2. Baked Goods
- 1.1.3. Chocolate
- 1.1.4. Other Foods
- 1.2. Beverage
- 1.3. Pharmaceutical
- 1.4. Fragrance
-
1.1. Food
Bio Vanillin Market Segmentation By Geography
-
1. North America
- 1.1. United States
- 1.2. Canada
- 1.3. Mexico
- 1.4. Rest of North America
-
2. Europe
- 2.1. United Kingdom
- 2.2. Germany
- 2.3. France
- 2.4. Russia
- 2.5. Italy
- 2.6. Rest of Europe
-
3. Asia Pacific
- 3.1. India
- 3.2. China
- 3.3. Japan
- 3.4. Australia
- 3.5. Rest of Asia Pacific
-
4. Rest of the World
- 4.1. South America
- 4.2. Middle East
Bio Vanillin Market REPORT HIGHLIGHTS
| Aspects | Details |
|---|---|
| Study Period | 2019-2033 |
| Base Year | 2024 |
| Estimated Year | 2025 |
| Forecast Period | 2025-2033 |
| Historical Period | 2019-2024 |
| Growth Rate | CAGR of 7.30% from 2019-2033 |
| Segmentation |
|
Table of Contents
- 1. Introduction
- 1.1. Research Scope
- 1.2. Market Segmentation
- 1.3. Research Methodology
- 1.4. Definitions and Assumptions
- 2. Executive Summary
- 2.1. Introduction
- 3. Market Dynamics
- 3.1. Introduction
- 3.2. Market Drivers
- 3.2.1. Surge in Demand for 'Free-from' Food Products; Demand For Convenient And Healthy On-the-go Snacking Options
- 3.3. Market Restrains
- 3.3.1. Health Risk Associated with Certain Ingredients
- 3.4. Market Trends
- 3.4.1. Growing Demand for Bio Vanillin in the Food and Beverage Industry
- 4. Market Factor Analysis
- 4.1. Porters Five Forces
- 4.2. Supply/Value Chain
- 4.3. PESTEL analysis
- 4.4. Market Entropy
- 4.5. Patent/Trademark Analysis
- 5. Global Bio Vanillin Market Analysis, Insights and Forecast, 2019-2031
- 5.1. Market Analysis, Insights and Forecast - by Application
- 5.1.1. Food
- 5.1.1.1. Ice Cream
- 5.1.1.2. Baked Goods
- 5.1.1.3. Chocolate
- 5.1.1.4. Other Foods
- 5.1.2. Beverage
- 5.1.3. Pharmaceutical
- 5.1.4. Fragrance
- 5.1.1. Food
- 5.2. Market Analysis, Insights and Forecast - by Region
- 5.2.1. North America
- 5.2.2. Europe
- 5.2.3. Asia Pacific
- 5.2.4. Rest of the World
- 5.1. Market Analysis, Insights and Forecast - by Application
- 6. North America Bio Vanillin Market Analysis, Insights and Forecast, 2019-2031
- 6.1. Market Analysis, Insights and Forecast - by Application
- 6.1.1. Food
- 6.1.1.1. Ice Cream
- 6.1.1.2. Baked Goods
- 6.1.1.3. Chocolate
- 6.1.1.4. Other Foods
- 6.1.2. Beverage
- 6.1.3. Pharmaceutical
- 6.1.4. Fragrance
- 6.1.1. Food
- 6.1. Market Analysis, Insights and Forecast - by Application
- 7. Europe Bio Vanillin Market Analysis, Insights and Forecast, 2019-2031
- 7.1. Market Analysis, Insights and Forecast - by Application
- 7.1.1. Food
- 7.1.1.1. Ice Cream
- 7.1.1.2. Baked Goods
- 7.1.1.3. Chocolate
- 7.1.1.4. Other Foods
- 7.1.2. Beverage
- 7.1.3. Pharmaceutical
- 7.1.4. Fragrance
- 7.1.1. Food
- 7.1. Market Analysis, Insights and Forecast - by Application
- 8. Asia Pacific Bio Vanillin Market Analysis, Insights and Forecast, 2019-2031
- 8.1. Market Analysis, Insights and Forecast - by Application
- 8.1.1. Food
- 8.1.1.1. Ice Cream
- 8.1.1.2. Baked Goods
- 8.1.1.3. Chocolate
- 8.1.1.4. Other Foods
- 8.1.2. Beverage
- 8.1.3. Pharmaceutical
- 8.1.4. Fragrance
- 8.1.1. Food
- 8.1. Market Analysis, Insights and Forecast - by Application
- 9. Rest of the World Bio Vanillin Market Analysis, Insights and Forecast, 2019-2031
- 9.1. Market Analysis, Insights and Forecast - by Application
- 9.1.1. Food
- 9.1.1.1. Ice Cream
- 9.1.1.2. Baked Goods
- 9.1.1.3. Chocolate
- 9.1.1.4. Other Foods
- 9.1.2. Beverage
- 9.1.3. Pharmaceutical
- 9.1.4. Fragrance
- 9.1.1. Food
- 9.1. Market Analysis, Insights and Forecast - by Application
- 10. North America Bio Vanillin Market Analysis, Insights and Forecast, 2019-2031
- 10.1. Market Analysis, Insights and Forecast - By Country/Sub-region
- 10.1.1 United States
- 10.1.2 Canada
- 10.1.3 Mexico
- 11. Europe Bio Vanillin Market Analysis, Insights and Forecast, 2019-2031
- 11.1. Market Analysis, Insights and Forecast - By Country/Sub-region
- 11.1.1 Germany
- 11.1.2 United Kingdom
- 11.1.3 France
- 11.1.4 Spain
- 11.1.5 Italy
- 11.1.6 Spain
- 11.1.7 Belgium
- 11.1.8 Netherland
- 11.1.9 Nordics
- 11.1.10 Rest of Europe
- 12. Asia Pacific Bio Vanillin Market Analysis, Insights and Forecast, 2019-2031
- 12.1. Market Analysis, Insights and Forecast - By Country/Sub-region
- 12.1.1 China
- 12.1.2 Japan
- 12.1.3 India
- 12.1.4 South Korea
- 12.1.5 Southeast Asia
- 12.1.6 Australia
- 12.1.7 Indonesia
- 12.1.8 Phillipes
- 12.1.9 Singapore
- 12.1.10 Thailandc
- 12.1.11 Rest of Asia Pacific
- 13. South America Bio Vanillin Market Analysis, Insights and Forecast, 2019-2031
- 13.1. Market Analysis, Insights and Forecast - By Country/Sub-region
- 13.1.1 Brazil
- 13.1.2 Argentina
- 13.1.3 Peru
- 13.1.4 Chile
- 13.1.5 Colombia
- 13.1.6 Ecuador
- 13.1.7 Venezuela
- 13.1.8 Rest of South America
- 14. MEA Bio Vanillin Market Analysis, Insights and Forecast, 2019-2031
- 14.1. Market Analysis, Insights and Forecast - By Country/Sub-region
- 14.1.1 United Arab Emirates
- 14.1.2 Saudi Arabia
- 14.1.3 South Africa
- 14.1.4 Rest of Middle East and Africa
- 15. Competitive Analysis
- 15.1. Global Market Share Analysis 2024
- 15.2. Company Profiles
- 15.2.1 Firmenich SA
- 15.2.1.1. Overview
- 15.2.1.2. Products
- 15.2.1.3. SWOT Analysis
- 15.2.1.4. Recent Developments
- 15.2.1.5. Financials (Based on Availability)
- 15.2.2 Givaudan
- 15.2.2.1. Overview
- 15.2.2.2. Products
- 15.2.2.3. SWOT Analysis
- 15.2.2.4. Recent Developments
- 15.2.2.5. Financials (Based on Availability)
- 15.2.3 Evolva Holding SA
- 15.2.3.1. Overview
- 15.2.3.2. Products
- 15.2.3.3. SWOT Analysis
- 15.2.3.4. Recent Developments
- 15.2.3.5. Financials (Based on Availability)
- 15.2.4 Archer Daniels Midland Company
- 15.2.4.1. Overview
- 15.2.4.2. Products
- 15.2.4.3. SWOT Analysis
- 15.2.4.4. Recent Developments
- 15.2.4.5. Financials (Based on Availability)
- 15.2.5 Lesaffre
- 15.2.5.1. Overview
- 15.2.5.2. Products
- 15.2.5.3. SWOT Analysis
- 15.2.5.4. Recent Developments
- 15.2.5.5. Financials (Based on Availability)
- 15.2.6 Advanced Biotech
- 15.2.6.1. Overview
- 15.2.6.2. Products
- 15.2.6.3. SWOT Analysis
- 15.2.6.4. Recent Developments
- 15.2.6.5. Financials (Based on Availability)
- 15.2.7 AUROCHEMICAL
- 15.2.7.1. Overview
- 15.2.7.2. Products
- 15.2.7.3. SWOT Analysis
- 15.2.7.4. Recent Developments
- 15.2.7.5. Financials (Based on Availability)
- 15.2.8 Apple Flavor & Fragrance Group Co Ltd
- 15.2.8.1. Overview
- 15.2.8.2. Products
- 15.2.8.3. SWOT Analysis
- 15.2.8.4. Recent Developments
- 15.2.8.5. Financials (Based on Availability)
- 15.2.1 Firmenich SA
List of Figures
- Figure 1: Global Bio Vanillin Market Revenue Breakdown (Million, %) by Region 2024 & 2032
- Figure 2: Global Bio Vanillin Market Volume Breakdown (K Units, %) by Region 2024 & 2032
- Figure 3: North America Bio Vanillin Market Revenue (Million), by Country 2024 & 2032
- Figure 4: North America Bio Vanillin Market Volume (K Units), by Country 2024 & 2032
- Figure 5: North America Bio Vanillin Market Revenue Share (%), by Country 2024 & 2032
- Figure 6: North America Bio Vanillin Market Volume Share (%), by Country 2024 & 2032
- Figure 7: Europe Bio Vanillin Market Revenue (Million), by Country 2024 & 2032
- Figure 8: Europe Bio Vanillin Market Volume (K Units), by Country 2024 & 2032
- Figure 9: Europe Bio Vanillin Market Revenue Share (%), by Country 2024 & 2032
- Figure 10: Europe Bio Vanillin Market Volume Share (%), by Country 2024 & 2032
- Figure 11: Asia Pacific Bio Vanillin Market Revenue (Million), by Country 2024 & 2032
- Figure 12: Asia Pacific Bio Vanillin Market Volume (K Units), by Country 2024 & 2032
- Figure 13: Asia Pacific Bio Vanillin Market Revenue Share (%), by Country 2024 & 2032
- Figure 14: Asia Pacific Bio Vanillin Market Volume Share (%), by Country 2024 & 2032
- Figure 15: South America Bio Vanillin Market Revenue (Million), by Country 2024 & 2032
- Figure 16: South America Bio Vanillin Market Volume (K Units), by Country 2024 & 2032
- Figure 17: South America Bio Vanillin Market Revenue Share (%), by Country 2024 & 2032
- Figure 18: South America Bio Vanillin Market Volume Share (%), by Country 2024 & 2032
- Figure 19: MEA Bio Vanillin Market Revenue (Million), by Country 2024 & 2032
- Figure 20: MEA Bio Vanillin Market Volume (K Units), by Country 2024 & 2032
- Figure 21: MEA Bio Vanillin Market Revenue Share (%), by Country 2024 & 2032
- Figure 22: MEA Bio Vanillin Market Volume Share (%), by Country 2024 & 2032
- Figure 23: North America Bio Vanillin Market Revenue (Million), by Application 2024 & 2032
- Figure 24: North America Bio Vanillin Market Volume (K Units), by Application 2024 & 2032
- Figure 25: North America Bio Vanillin Market Revenue Share (%), by Application 2024 & 2032
- Figure 26: North America Bio Vanillin Market Volume Share (%), by Application 2024 & 2032
- Figure 27: North America Bio Vanillin Market Revenue (Million), by Country 2024 & 2032
- Figure 28: North America Bio Vanillin Market Volume (K Units), by Country 2024 & 2032
- Figure 29: North America Bio Vanillin Market Revenue Share (%), by Country 2024 & 2032
- Figure 30: North America Bio Vanillin Market Volume Share (%), by Country 2024 & 2032
- Figure 31: Europe Bio Vanillin Market Revenue (Million), by Application 2024 & 2032
- Figure 32: Europe Bio Vanillin Market Volume (K Units), by Application 2024 & 2032
- Figure 33: Europe Bio Vanillin Market Revenue Share (%), by Application 2024 & 2032
- Figure 34: Europe Bio Vanillin Market Volume Share (%), by Application 2024 & 2032
- Figure 35: Europe Bio Vanillin Market Revenue (Million), by Country 2024 & 2032
- Figure 36: Europe Bio Vanillin Market Volume (K Units), by Country 2024 & 2032
- Figure 37: Europe Bio Vanillin Market Revenue Share (%), by Country 2024 & 2032
- Figure 38: Europe Bio Vanillin Market Volume Share (%), by Country 2024 & 2032
- Figure 39: Asia Pacific Bio Vanillin Market Revenue (Million), by Application 2024 & 2032
- Figure 40: Asia Pacific Bio Vanillin Market Volume (K Units), by Application 2024 & 2032
- Figure 41: Asia Pacific Bio Vanillin Market Revenue Share (%), by Application 2024 & 2032
- Figure 42: Asia Pacific Bio Vanillin Market Volume Share (%), by Application 2024 & 2032
- Figure 43: Asia Pacific Bio Vanillin Market Revenue (Million), by Country 2024 & 2032
- Figure 44: Asia Pacific Bio Vanillin Market Volume (K Units), by Country 2024 & 2032
- Figure 45: Asia Pacific Bio Vanillin Market Revenue Share (%), by Country 2024 & 2032
- Figure 46: Asia Pacific Bio Vanillin Market Volume Share (%), by Country 2024 & 2032
- Figure 47: Rest of the World Bio Vanillin Market Revenue (Million), by Application 2024 & 2032
- Figure 48: Rest of the World Bio Vanillin Market Volume (K Units), by Application 2024 & 2032
- Figure 49: Rest of the World Bio Vanillin Market Revenue Share (%), by Application 2024 & 2032
- Figure 50: Rest of the World Bio Vanillin Market Volume Share (%), by Application 2024 & 2032
- Figure 51: Rest of the World Bio Vanillin Market Revenue (Million), by Country 2024 & 2032
- Figure 52: Rest of the World Bio Vanillin Market Volume (K Units), by Country 2024 & 2032
- Figure 53: Rest of the World Bio Vanillin Market Revenue Share (%), by Country 2024 & 2032
- Figure 54: Rest of the World Bio Vanillin Market Volume Share (%), by Country 2024 & 2032
List of Tables
- Table 1: Global Bio Vanillin Market Revenue Million Forecast, by Region 2019 & 2032
- Table 2: Global Bio Vanillin Market Volume K Units Forecast, by Region 2019 & 2032
- Table 3: Global Bio Vanillin Market Revenue Million Forecast, by Application 2019 & 2032
- Table 4: Global Bio Vanillin Market Volume K Units Forecast, by Application 2019 & 2032
- Table 5: Global Bio Vanillin Market Revenue Million Forecast, by Region 2019 & 2032
- Table 6: Global Bio Vanillin Market Volume K Units Forecast, by Region 2019 & 2032
- Table 7: Global Bio Vanillin Market Revenue Million Forecast, by Country 2019 & 2032
- Table 8: Global Bio Vanillin Market Volume K Units Forecast, by Country 2019 & 2032
- Table 9: United States Bio Vanillin Market Revenue (Million) Forecast, by Application 2019 & 2032
- Table 10: United States Bio Vanillin Market Volume (K Units) Forecast, by Application 2019 & 2032
- Table 11: Canada Bio Vanillin Market Revenue (Million) Forecast, by Application 2019 & 2032
- Table 12: Canada Bio Vanillin Market Volume (K Units) Forecast, by Application 2019 & 2032
- Table 13: Mexico Bio Vanillin Market Revenue (Million) Forecast, by Application 2019 & 2032
- Table 14: Mexico Bio Vanillin Market Volume (K Units) Forecast, by Application 2019 & 2032
- Table 15: Global Bio Vanillin Market Revenue Million Forecast, by Country 2019 & 2032
- Table 16: Global Bio Vanillin Market Volume K Units Forecast, by Country 2019 & 2032
- Table 17: Germany Bio Vanillin Market Revenue (Million) Forecast, by Application 2019 & 2032
- Table 18: Germany Bio Vanillin Market Volume (K Units) Forecast, by Application 2019 & 2032
- Table 19: United Kingdom Bio Vanillin Market Revenue (Million) Forecast, by Application 2019 & 2032
- Table 20: United Kingdom Bio Vanillin Market Volume (K Units) Forecast, by Application 2019 & 2032
- Table 21: France Bio Vanillin Market Revenue (Million) Forecast, by Application 2019 & 2032
- Table 22: France Bio Vanillin Market Volume (K Units) Forecast, by Application 2019 & 2032
- Table 23: Spain Bio Vanillin Market Revenue (Million) Forecast, by Application 2019 & 2032
- Table 24: Spain Bio Vanillin Market Volume (K Units) Forecast, by Application 2019 & 2032
- Table 25: Italy Bio Vanillin Market Revenue (Million) Forecast, by Application 2019 & 2032
- Table 26: Italy Bio Vanillin Market Volume (K Units) Forecast, by Application 2019 & 2032
- Table 27: Spain Bio Vanillin Market Revenue (Million) Forecast, by Application 2019 & 2032
- Table 28: Spain Bio Vanillin Market Volume (K Units) Forecast, by Application 2019 & 2032
- Table 29: Belgium Bio Vanillin Market Revenue (Million) Forecast, by Application 2019 & 2032
- Table 30: Belgium Bio Vanillin Market Volume (K Units) Forecast, by Application 2019 & 2032
- Table 31: Netherland Bio Vanillin Market Revenue (Million) Forecast, by Application 2019 & 2032
- Table 32: Netherland Bio Vanillin Market Volume (K Units) Forecast, by Application 2019 & 2032
- Table 33: Nordics Bio Vanillin Market Revenue (Million) Forecast, by Application 2019 & 2032
- Table 34: Nordics Bio Vanillin Market Volume (K Units) Forecast, by Application 2019 & 2032
- Table 35: Rest of Europe Bio Vanillin Market Revenue (Million) Forecast, by Application 2019 & 2032
- Table 36: Rest of Europe Bio Vanillin Market Volume (K Units) Forecast, by Application 2019 & 2032
- Table 37: Global Bio Vanillin Market Revenue Million Forecast, by Country 2019 & 2032
- Table 38: Global Bio Vanillin Market Volume K Units Forecast, by Country 2019 & 2032
- Table 39: China Bio Vanillin Market Revenue (Million) Forecast, by Application 2019 & 2032
- Table 40: China Bio Vanillin Market Volume (K Units) Forecast, by Application 2019 & 2032
- Table 41: Japan Bio Vanillin Market Revenue (Million) Forecast, by Application 2019 & 2032
- Table 42: Japan Bio Vanillin Market Volume (K Units) Forecast, by Application 2019 & 2032
- Table 43: India Bio Vanillin Market Revenue (Million) Forecast, by Application 2019 & 2032
- Table 44: India Bio Vanillin Market Volume (K Units) Forecast, by Application 2019 & 2032
- Table 45: South Korea Bio Vanillin Market Revenue (Million) Forecast, by Application 2019 & 2032
- Table 46: South Korea Bio Vanillin Market Volume (K Units) Forecast, by Application 2019 & 2032
- Table 47: Southeast Asia Bio Vanillin Market Revenue (Million) Forecast, by Application 2019 & 2032
- Table 48: Southeast Asia Bio Vanillin Market Volume (K Units) Forecast, by Application 2019 & 2032
- Table 49: Australia Bio Vanillin Market Revenue (Million) Forecast, by Application 2019 & 2032
- Table 50: Australia Bio Vanillin Market Volume (K Units) Forecast, by Application 2019 & 2032
- Table 51: Indonesia Bio Vanillin Market Revenue (Million) Forecast, by Application 2019 & 2032
- Table 52: Indonesia Bio Vanillin Market Volume (K Units) Forecast, by Application 2019 & 2032
- Table 53: Phillipes Bio Vanillin Market Revenue (Million) Forecast, by Application 2019 & 2032
- Table 54: Phillipes Bio Vanillin Market Volume (K Units) Forecast, by Application 2019 & 2032
- Table 55: Singapore Bio Vanillin Market Revenue (Million) Forecast, by Application 2019 & 2032
- Table 56: Singapore Bio Vanillin Market Volume (K Units) Forecast, by Application 2019 & 2032
- Table 57: Thailandc Bio Vanillin Market Revenue (Million) Forecast, by Application 2019 & 2032
- Table 58: Thailandc Bio Vanillin Market Volume (K Units) Forecast, by Application 2019 & 2032
- Table 59: Rest of Asia Pacific Bio Vanillin Market Revenue (Million) Forecast, by Application 2019 & 2032
- Table 60: Rest of Asia Pacific Bio Vanillin Market Volume (K Units) Forecast, by Application 2019 & 2032
- Table 61: Global Bio Vanillin Market Revenue Million Forecast, by Country 2019 & 2032
- Table 62: Global Bio Vanillin Market Volume K Units Forecast, by Country 2019 & 2032
- Table 63: Brazil Bio Vanillin Market Revenue (Million) Forecast, by Application 2019 & 2032
- Table 64: Brazil Bio Vanillin Market Volume (K Units) Forecast, by Application 2019 & 2032
- Table 65: Argentina Bio Vanillin Market Revenue (Million) Forecast, by Application 2019 & 2032
- Table 66: Argentina Bio Vanillin Market Volume (K Units) Forecast, by Application 2019 & 2032
- Table 67: Peru Bio Vanillin Market Revenue (Million) Forecast, by Application 2019 & 2032
- Table 68: Peru Bio Vanillin Market Volume (K Units) Forecast, by Application 2019 & 2032
- Table 69: Chile Bio Vanillin Market Revenue (Million) Forecast, by Application 2019 & 2032
- Table 70: Chile Bio Vanillin Market Volume (K Units) Forecast, by Application 2019 & 2032
- Table 71: Colombia Bio Vanillin Market Revenue (Million) Forecast, by Application 2019 & 2032
- Table 72: Colombia Bio Vanillin Market Volume (K Units) Forecast, by Application 2019 & 2032
- Table 73: Ecuador Bio Vanillin Market Revenue (Million) Forecast, by Application 2019 & 2032
- Table 74: Ecuador Bio Vanillin Market Volume (K Units) Forecast, by Application 2019 & 2032
- Table 75: Venezuela Bio Vanillin Market Revenue (Million) Forecast, by Application 2019 & 2032
- Table 76: Venezuela Bio Vanillin Market Volume (K Units) Forecast, by Application 2019 & 2032
- Table 77: Rest of South America Bio Vanillin Market Revenue (Million) Forecast, by Application 2019 & 2032
- Table 78: Rest of South America Bio Vanillin Market Volume (K Units) Forecast, by Application 2019 & 2032
- Table 79: Global Bio Vanillin Market Revenue Million Forecast, by Country 2019 & 2032
- Table 80: Global Bio Vanillin Market Volume K Units Forecast, by Country 2019 & 2032
- Table 81: United Arab Emirates Bio Vanillin Market Revenue (Million) Forecast, by Application 2019 & 2032
- Table 82: United Arab Emirates Bio Vanillin Market Volume (K Units) Forecast, by Application 2019 & 2032
- Table 83: Saudi Arabia Bio Vanillin Market Revenue (Million) Forecast, by Application 2019 & 2032
- Table 84: Saudi Arabia Bio Vanillin Market Volume (K Units) Forecast, by Application 2019 & 2032
- Table 85: South Africa Bio Vanillin Market Revenue (Million) Forecast, by Application 2019 & 2032
- Table 86: South Africa Bio Vanillin Market Volume (K Units) Forecast, by Application 2019 & 2032
- Table 87: Rest of Middle East and Africa Bio Vanillin Market Revenue (Million) Forecast, by Application 2019 & 2032
- Table 88: Rest of Middle East and Africa Bio Vanillin Market Volume (K Units) Forecast, by Application 2019 & 2032
- Table 89: Global Bio Vanillin Market Revenue Million Forecast, by Application 2019 & 2032
- Table 90: Global Bio Vanillin Market Volume K Units Forecast, by Application 2019 & 2032
- Table 91: Global Bio Vanillin Market Revenue Million Forecast, by Country 2019 & 2032
- Table 92: Global Bio Vanillin Market Volume K Units Forecast, by Country 2019 & 2032
- Table 93: United States Bio Vanillin Market Revenue (Million) Forecast, by Application 2019 & 2032
- Table 94: United States Bio Vanillin Market Volume (K Units) Forecast, by Application 2019 & 2032
- Table 95: Canada Bio Vanillin Market Revenue (Million) Forecast, by Application 2019 & 2032
- Table 96: Canada Bio Vanillin Market Volume (K Units) Forecast, by Application 2019 & 2032
- Table 97: Mexico Bio Vanillin Market Revenue (Million) Forecast, by Application 2019 & 2032
- Table 98: Mexico Bio Vanillin Market Volume (K Units) Forecast, by Application 2019 & 2032
- Table 99: Rest of North America Bio Vanillin Market Revenue (Million) Forecast, by Application 2019 & 2032
- Table 100: Rest of North America Bio Vanillin Market Volume (K Units) Forecast, by Application 2019 & 2032
- Table 101: Global Bio Vanillin Market Revenue Million Forecast, by Application 2019 & 2032
- Table 102: Global Bio Vanillin Market Volume K Units Forecast, by Application 2019 & 2032
- Table 103: Global Bio Vanillin Market Revenue Million Forecast, by Country 2019 & 2032
- Table 104: Global Bio Vanillin Market Volume K Units Forecast, by Country 2019 & 2032
- Table 105: United Kingdom Bio Vanillin Market Revenue (Million) Forecast, by Application 2019 & 2032
- Table 106: United Kingdom Bio Vanillin Market Volume (K Units) Forecast, by Application 2019 & 2032
- Table 107: Germany Bio Vanillin Market Revenue (Million) Forecast, by Application 2019 & 2032
- Table 108: Germany Bio Vanillin Market Volume (K Units) Forecast, by Application 2019 & 2032
- Table 109: France Bio Vanillin Market Revenue (Million) Forecast, by Application 2019 & 2032
- Table 110: France Bio Vanillin Market Volume (K Units) Forecast, by Application 2019 & 2032
- Table 111: Russia Bio Vanillin Market Revenue (Million) Forecast, by Application 2019 & 2032
- Table 112: Russia Bio Vanillin Market Volume (K Units) Forecast, by Application 2019 & 2032
- Table 113: Italy Bio Vanillin Market Revenue (Million) Forecast, by Application 2019 & 2032
- Table 114: Italy Bio Vanillin Market Volume (K Units) Forecast, by Application 2019 & 2032
- Table 115: Rest of Europe Bio Vanillin Market Revenue (Million) Forecast, by Application 2019 & 2032
- Table 116: Rest of Europe Bio Vanillin Market Volume (K Units) Forecast, by Application 2019 & 2032
- Table 117: Global Bio Vanillin Market Revenue Million Forecast, by Application 2019 & 2032
- Table 118: Global Bio Vanillin Market Volume K Units Forecast, by Application 2019 & 2032
- Table 119: Global Bio Vanillin Market Revenue Million Forecast, by Country 2019 & 2032
- Table 120: Global Bio Vanillin Market Volume K Units Forecast, by Country 2019 & 2032
- Table 121: India Bio Vanillin Market Revenue (Million) Forecast, by Application 2019 & 2032
- Table 122: India Bio Vanillin Market Volume (K Units) Forecast, by Application 2019 & 2032
- Table 123: China Bio Vanillin Market Revenue (Million) Forecast, by Application 2019 & 2032
- Table 124: China Bio Vanillin Market Volume (K Units) Forecast, by Application 2019 & 2032
- Table 125: Japan Bio Vanillin Market Revenue (Million) Forecast, by Application 2019 & 2032
- Table 126: Japan Bio Vanillin Market Volume (K Units) Forecast, by Application 2019 & 2032
- Table 127: Australia Bio Vanillin Market Revenue (Million) Forecast, by Application 2019 & 2032
- Table 128: Australia Bio Vanillin Market Volume (K Units) Forecast, by Application 2019 & 2032
- Table 129: Rest of Asia Pacific Bio Vanillin Market Revenue (Million) Forecast, by Application 2019 & 2032
- Table 130: Rest of Asia Pacific Bio Vanillin Market Volume (K Units) Forecast, by Application 2019 & 2032
- Table 131: Global Bio Vanillin Market Revenue Million Forecast, by Application 2019 & 2032
- Table 132: Global Bio Vanillin Market Volume K Units Forecast, by Application 2019 & 2032
- Table 133: Global Bio Vanillin Market Revenue Million Forecast, by Country 2019 & 2032
- Table 134: Global Bio Vanillin Market Volume K Units Forecast, by Country 2019 & 2032
- Table 135: South America Bio Vanillin Market Revenue (Million) Forecast, by Application 2019 & 2032
- Table 136: South America Bio Vanillin Market Volume (K Units) Forecast, by Application 2019 & 2032
- Table 137: Middle East Bio Vanillin Market Revenue (Million) Forecast, by Application 2019 & 2032
- Table 138: Middle East Bio Vanillin Market Volume (K Units) Forecast, by Application 2019 & 2032
Frequently Asked Questions
1. What is the projected Compound Annual Growth Rate (CAGR) of the Bio Vanillin Market?
The projected CAGR is approximately 7.30%.
2. Which companies are prominent players in the Bio Vanillin Market?
Key companies in the market include Firmenich SA, Givaudan, Evolva Holding SA, Archer Daniels Midland Company, Lesaffre, Advanced Biotech, AUROCHEMICAL, Apple Flavor & Fragrance Group Co Ltd.
3. What are the main segments of the Bio Vanillin Market?
The market segments include Application.
4. Can you provide details about the market size?
The market size is estimated to be USD 277.69 Million as of 2022.
5. What are some drivers contributing to market growth?
Surge in Demand for 'Free-from' Food Products; Demand For Convenient And Healthy On-the-go Snacking Options.
6. What are the notable trends driving market growth?
Growing Demand for Bio Vanillin in the Food and Beverage Industry.
7. Are there any restraints impacting market growth?
Health Risk Associated with Certain Ingredients.
8. Can you provide examples of recent developments in the market?
N/A
9. What pricing options are available for accessing the report?
Pricing options include single-user, multi-user, and enterprise licenses priced at USD 4750, USD 5250, and USD 8750 respectively.
10. Is the market size provided in terms of value or volume?
The market size is provided in terms of value, measured in Million and volume, measured in K Units.
11. Are there any specific market keywords associated with the report?
Yes, the market keyword associated with the report is "Bio Vanillin Market," which aids in identifying and referencing the specific market segment covered.
12. How do I determine which pricing option suits my needs best?
The pricing options vary based on user requirements and access needs. Individual users may opt for single-user licenses, while businesses requiring broader access may choose multi-user or enterprise licenses for cost-effective access to the report.
13. Are there any additional resources or data provided in the Bio Vanillin Market report?
While the report offers comprehensive insights, it's advisable to review the specific contents or supplementary materials provided to ascertain if additional resources or data are available.
14. How can I stay updated on further developments or reports in the Bio Vanillin Market?
To stay informed about further developments, trends, and reports in the Bio Vanillin Market, consider subscribing to industry newsletters, following relevant companies and organizations, or regularly checking reputable industry news sources and publications.
Methodology
Step 1 - Identification of Relevant Samples Size from Population Database


Step 2 - Approaches for Defining Global Market Size (Value, Volume* & Price*)

Note*: In applicable scenarios
Step 3 - Data Sources
Primary Research
- Web Analytics
- Survey Reports
- Research Institute
- Latest Research Reports
- Opinion Leaders
Secondary Research
- Annual Reports
- White Paper
- Latest Press Release
- Industry Association
- Paid Database
- Investor Presentations

Step 4 - Data Triangulation
Involves using different sources of information in order to increase the validity of a study
These sources are likely to be stakeholders in a program - participants, other researchers, program staff, other community members, and so on.
Then we put all data in single framework & apply various statistical tools to find out the dynamic on the market.
During the analysis stage, feedback from the stakeholder groups would be compared to determine areas of agreement as well as areas of divergence


