
Key Insights
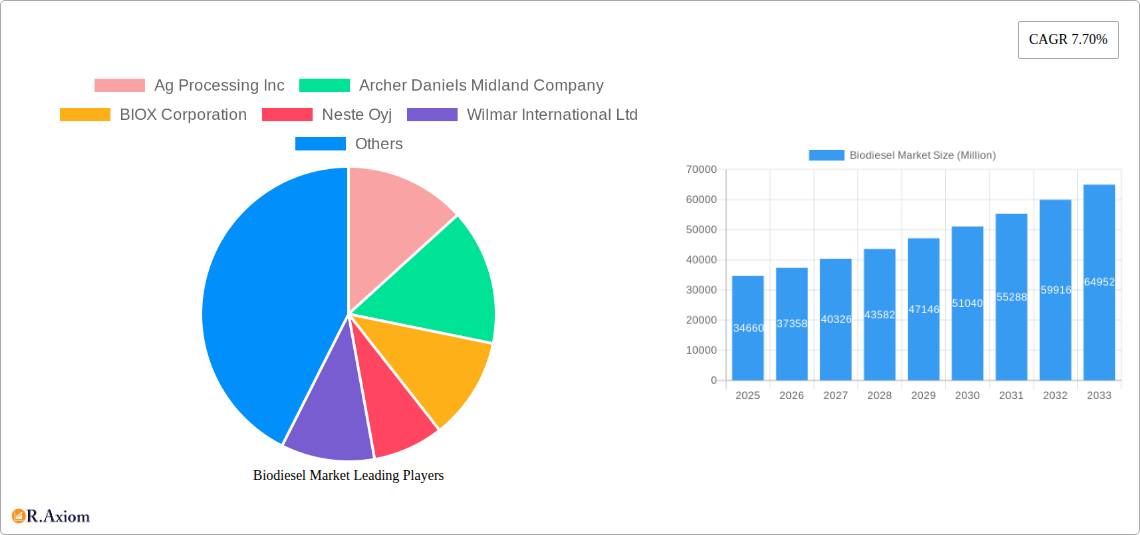
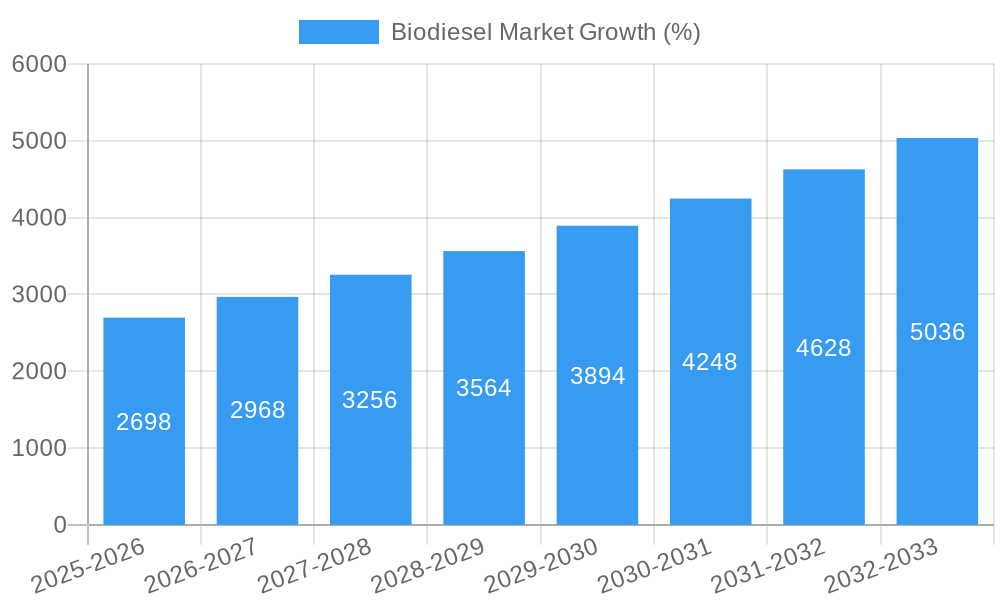
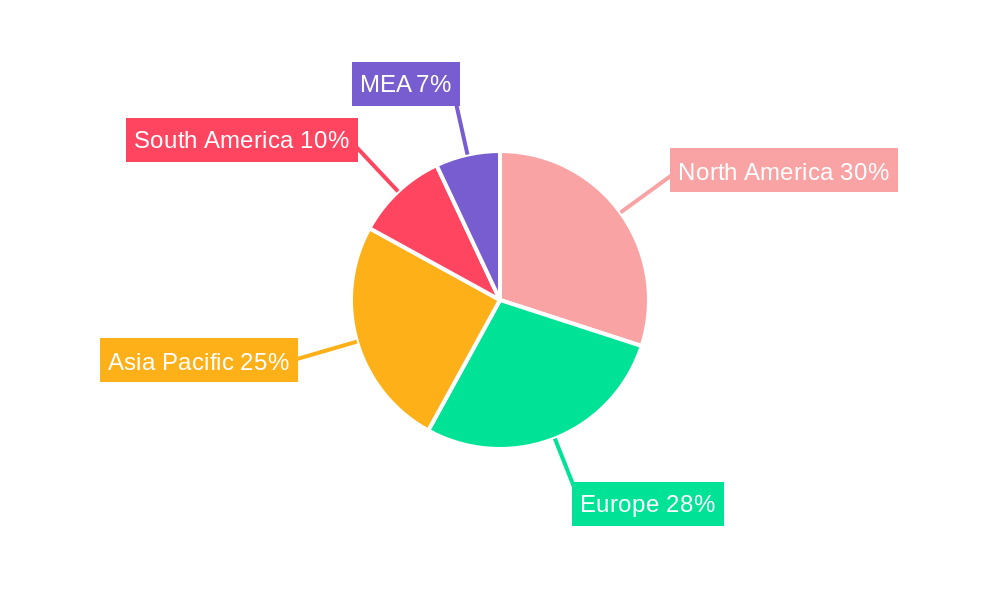
The global biodiesel market, valued at $34.66 billion in 2025, is projected to experience robust growth, driven by increasing environmental concerns and stringent government regulations aimed at reducing carbon emissions from the transportation sector. The market's Compound Annual Growth Rate (CAGR) of 7.70% from 2025 to 2033 signifies a substantial expansion, fueled by the rising demand for renewable and sustainable energy sources. Key drivers include government incentives promoting biodiesel adoption, increasing awareness of the environmental benefits of biofuels, and the growing need for energy security diversification away from fossil fuels. The utilization of diverse feedstocks like animal fats and vegetable oils, alongside technological advancements enhancing biodiesel production efficiency and reducing costs, further contributes to market expansion. However, challenges remain, including feedstock price volatility, potential competition from other renewable fuels, and the need for efficient distribution infrastructure. The segmentation by feedstock (animal fat, vegetable oil, and others) and application (transportation, power generation, and others) highlights the diverse opportunities within the market. North America and Europe are currently leading the market, but Asia-Pacific is expected to show significant growth potential due to its expanding economies and increasing focus on sustainable energy solutions.
The market's regional distribution reflects established biofuel markets in North America and Europe, with significant growth potential in Asia-Pacific. The robust growth is expected to continue through 2033, driven by ongoing policy support, technological progress, and increasing consumer awareness of environmental sustainability. While challenges related to feedstock costs and infrastructure remain, the long-term outlook for the biodiesel market remains positive, indicating a significant role for biodiesel in the transition towards a cleaner energy future. The presence of major players like Cargill, Archer Daniels Midland, and Neste Oyj indicates a high level of competition and investment within the sector. This competitive landscape is likely to spur further innovation and market penetration.
Biodiesel Market: A Comprehensive Report (2019-2033)
This in-depth report provides a comprehensive analysis of the Biodiesel Market, covering its historical performance (2019-2024), current status (2025), and future projections (2025-2033). We delve into market segmentation, competitive dynamics, technological advancements, and key growth drivers, offering actionable insights for industry stakeholders. The report utilizes rigorous data analysis and expert forecasts to paint a clear picture of this dynamic market, encompassing a total market value of xx Million by 2033.
Biodiesel Market Market Concentration & Innovation
This section analyzes the competitive landscape of the Biodiesel Market, exploring market concentration, innovation drivers, regulatory frameworks, product substitutes, end-user trends, and merger & acquisition (M&A) activities. The market exhibits a moderately concentrated structure, with key players like Archer Daniels Midland Company and Neste Oyj holding significant market share. However, the presence of numerous smaller players indicates a competitive environment. Innovation is driven by the need for sustainable alternatives to fossil fuels, with research focusing on enhancing feedstock efficiency, improving biodiesel properties, and exploring novel production technologies. Stringent emission regulations and government incentives are significant market drivers. The increasing adoption of biodiesel in transportation fuels is a major end-user trend, while product substitutes such as renewable diesel and other biofuels present competitive challenges. M&A activities are expected to consolidate the market further, with deal values projected to reach xx Million annually by 2033.
- Market Share: Top 5 players hold approximately 60% market share (estimated).
- M&A Activity: Average annual deal value projected at xx Million during the forecast period.
- Innovation Focus: Enhanced feedstock efficiency, improved biodiesel properties, and novel production technologies.
- Regulatory Landscape: Stringent emission regulations and government incentives play a crucial role.
Biodiesel Market Industry Trends & Insights
The Biodiesel Market is experiencing robust growth, driven by increasing environmental concerns, government mandates to reduce carbon emissions, and rising demand from the transportation sector. The Compound Annual Growth Rate (CAGR) is projected at xx% during the forecast period (2025-2033), with the market penetration rate increasing from xx% in 2025 to xx% by 2033. Technological advancements such as improved catalyst systems and efficient production processes are further boosting the market. Consumer preference for eco-friendly fuels is another important driving force. Competitive dynamics are shaped by technological leadership, feedstock access, and economies of scale. Challenges remain, however, including fluctuating feedstock prices, the intermittent nature of renewable energy sources, and competition from other biofuels.
Dominant Markets & Segments in Biodiesel Market
The Transportation segment dominates the Biodiesel Market, accounting for approximately xx% of the total market value in 2025. Vegetable Oil is the leading feedstock, driven by its relatively high yields and established supply chains. Geographically, North America and Europe represent the largest markets, fueled by strong environmental regulations and government support.
Dominant Segments:
- Application: Transportation (primarily due to increased adoption in blends with conventional diesel fuels).
- Feedstock: Vegetable Oil (due to wider availability and established supply chains).
- Region: North America (owing to strong government support and substantial demand).
Key Drivers:
- Economic Policies: Subsidies, tax incentives, and mandates promoting biodiesel adoption.
- Infrastructure: Established infrastructure for biodiesel production, distribution, and blending.
- Environmental Regulations: Stringent emission norms pushing for cleaner fuel alternatives.
Biodiesel Market Product Developments
Recent product innovations center on improving biodiesel's cold weather performance, reducing its viscosity, and enhancing its fuel properties. These developments improve the fuel's suitability for diverse climates and applications. The focus on producing higher-quality biodiesel with better oxidative stability and lower emissions contributes to increased market acceptance and adoption. Advanced production technologies that reduce waste and improve overall efficiency also contribute to the overall market dynamics.
Report Scope & Segmentation Analysis
The report segments the Biodiesel Market based on feedstock (Animal Fat, Vegetable Oil, Other Feedstocks) and application (Transportation, Power Generation, Other Applications). Each segment is analyzed for market size, growth projections, and competitive dynamics.
Feedstock: Animal Fat, Vegetable Oil, and Other Feedstocks segments demonstrate varying growth rates depending on feedstock availability and cost. Vegetable oil is expected to maintain its dominance, while Animal Fat and Other Feedstocks may see incremental growth based on new technology developments.
Application: The Transportation segment holds significant market share, driven by regulations and government incentives; the Power Generation segment is anticipated to grow significantly as renewable energy demands increase, while Other Applications will have a smaller market share.
Key Drivers of Biodiesel Market Growth
The growth of the Biodiesel Market is propelled by several key factors:
- Government Regulations: Stringent emission standards and supportive policies promoting the adoption of renewable fuels.
- Environmental Concerns: Growing awareness of climate change and the need for sustainable energy solutions.
- Technological Advancements: Improved production processes and feedstock utilization technologies are enhancing efficiency and cost-effectiveness.
Challenges in the Biodiesel Market Sector
The Biodiesel Market faces several challenges:
- Feedstock Price Volatility: Fluctuations in feedstock prices can impact biodiesel production costs and profitability.
- Competition from Other Biofuels: Biodiesel competes with other biofuels like ethanol and renewable diesel, impacting market share.
- Supply Chain Issues: Efficient and reliable supply chains are crucial for ensuring consistent biodiesel production and distribution.
Emerging Opportunities in Biodiesel Market
Emerging opportunities in the Biodiesel Market include:
- Sustainable Aviation Fuel (SAF): Growing demand for SAF opens up a new market segment for biodiesel.
- Advancements in Feedstock Utilization: Research into novel feedstocks can reduce dependence on traditional sources.
- Integration with Smart Grids: Biodiesel can be integrated into smart grids to optimize energy distribution and efficiency.
Leading Players in the Biodiesel Market Market
- Ag Processing Inc
- Archer Daniels Midland Company
- BIOX Corporation
- Neste Oyj
- Wilmar International Ltd
- Cargill Inc
- Bangchak Corporation Public Company Limited
- Renewable Energy Group Inc
Key Developments in Biodiesel Market Industry
November 2022: Technip Energies secured a contract from TotalEnergies to produce SAF, boosting the potential of biodiesel in the aviation sector. This development signals a significant shift towards sustainable aviation fuels.
October 2022: Fluor Corporation's contract with Imperial for a renewable diesel complex signifies a major investment in expanding biodiesel production capacity. This development indicates a strong commitment to renewable fuels.
February 2022: SLD Pumps & Power's switch to biodiesel showcases the growing adoption of biodiesel even within internal company fleets. This demonstrates a positive trend towards biodiesel's practical applicability.
Strategic Outlook for Biodiesel Market Market
The Biodiesel Market is poised for significant growth, driven by increasing environmental concerns, supportive government policies, and technological advancements. The expansion of the SAF market presents a particularly exciting opportunity. Further research and development into efficient and sustainable feedstocks will be crucial for long-term market success. The market's future depends heavily on sustainable sourcing, technological breakthroughs in production and usage, and the continued support of government incentives and environmental regulations.
Biodiesel Market Segmentation
-
1. Feedstock
- 1.1. Animal Fat
- 1.2. Vegetable Oil
- 1.3. Other Feedstocks
-
2. Application
- 2.1. Transportation
- 2.2. Power Generation
- 2.3. Other Applications
-
3. Geogrpahy
-
3.1. North America
- 3.1.1. United States
- 3.1.2. Canada
- 3.1.3. Rest of North America
-
3.2. Europe
- 3.2.1. Germany
- 3.2.2. France
- 3.2.3. United Kingdom
- 3.2.4. Spain
- 3.2.5. NORDIC
- 3.2.6. Turkey
- 3.2.7. Russia
- 3.2.8. Rest of Europe
-
3.3. Asia-Pacific
- 3.3.1. China
- 3.3.2. India
- 3.3.3. Malaysia
- 3.3.4. Indonesia
- 3.3.5. Vietnam
- 3.3.6. Thailand
- 3.3.7. Japan
- 3.3.8. Australia
- 3.3.9. Rest of Asia-Pacific
-
3.4. South America
- 3.4.1. Brazil
- 3.4.2. Argentina
- 3.4.3. Colombia
- 3.4.4. Rest of South America
-
3.5. Middle East and Africa
- 3.5.1. Saudi Arabia
- 3.5.2. United Arab Emirates
- 3.5.3. Egypt
- 3.5.4. Nigeria
- 3.5.5. Qatar
- 3.5.6. Rest of Middle East and Africa
-
3.1. North America
Biodiesel Market Segmentation By Geography
-
1. North America
- 1.1. United States
- 1.2. Canada
- 1.3. Mexico
-
2. South America
- 2.1. Brazil
- 2.2. Argentina
- 2.3. Rest of South America
-
3. Europe
- 3.1. United Kingdom
- 3.2. Germany
- 3.3. France
- 3.4. Italy
- 3.5. Spain
- 3.6. Russia
- 3.7. Benelux
- 3.8. Nordics
- 3.9. Rest of Europe
-
4. Middle East & Africa
- 4.1. Turkey
- 4.2. Israel
- 4.3. GCC
- 4.4. North Africa
- 4.5. South Africa
- 4.6. Rest of Middle East & Africa
-
5. Asia Pacific
- 5.1. China
- 5.2. India
- 5.3. Japan
- 5.4. South Korea
- 5.5. ASEAN
- 5.6. Oceania
- 5.7. Rest of Asia Pacific
Biodiesel Market REPORT HIGHLIGHTS
| Aspects | Details |
|---|---|
| Study Period | 2019-2033 |
| Base Year | 2024 |
| Estimated Year | 2025 |
| Forecast Period | 2025-2033 |
| Historical Period | 2019-2024 |
| Growth Rate | CAGR of 7.70% from 2019-2033 |
| Segmentation |
|
Table of Contents
- 1. Introduction
- 1.1. Research Scope
- 1.2. Market Segmentation
- 1.3. Research Methodology
- 1.4. Definitions and Assumptions
- 2. Executive Summary
- 2.1. Introduction
- 3. Market Dynamics
- 3.1. Introduction
- 3.2. Market Drivers
- 3.2.1. 4.; The Increasing Demand for Eco-friendly Fuels 4.; Government Support for Biodiesel Production
- 3.3. Market Restrains
- 3.3.1. 4.; The Need for More Feedstock Availability for Biodiesel Generation
- 3.4. Market Trends
- 3.4.1. The Transportation Segment Expected to Dominate the Market
- 4. Market Factor Analysis
- 4.1. Porters Five Forces
- 4.2. Supply/Value Chain
- 4.3. PESTEL analysis
- 4.4. Market Entropy
- 4.5. Patent/Trademark Analysis
- 5. Global Biodiesel Market Analysis, Insights and Forecast, 2019-2031
- 5.1. Market Analysis, Insights and Forecast - by Feedstock
- 5.1.1. Animal Fat
- 5.1.2. Vegetable Oil
- 5.1.3. Other Feedstocks
- 5.2. Market Analysis, Insights and Forecast - by Application
- 5.2.1. Transportation
- 5.2.2. Power Generation
- 5.2.3. Other Applications
- 5.3. Market Analysis, Insights and Forecast - by Geogrpahy
- 5.3.1. North America
- 5.3.1.1. United States
- 5.3.1.2. Canada
- 5.3.1.3. Rest of North America
- 5.3.2. Europe
- 5.3.2.1. Germany
- 5.3.2.2. France
- 5.3.2.3. United Kingdom
- 5.3.2.4. Spain
- 5.3.2.5. NORDIC
- 5.3.2.6. Turkey
- 5.3.2.7. Russia
- 5.3.2.8. Rest of Europe
- 5.3.3. Asia-Pacific
- 5.3.3.1. China
- 5.3.3.2. India
- 5.3.3.3. Malaysia
- 5.3.3.4. Indonesia
- 5.3.3.5. Vietnam
- 5.3.3.6. Thailand
- 5.3.3.7. Japan
- 5.3.3.8. Australia
- 5.3.3.9. Rest of Asia-Pacific
- 5.3.4. South America
- 5.3.4.1. Brazil
- 5.3.4.2. Argentina
- 5.3.4.3. Colombia
- 5.3.4.4. Rest of South America
- 5.3.5. Middle East and Africa
- 5.3.5.1. Saudi Arabia
- 5.3.5.2. United Arab Emirates
- 5.3.5.3. Egypt
- 5.3.5.4. Nigeria
- 5.3.5.5. Qatar
- 5.3.5.6. Rest of Middle East and Africa
- 5.3.1. North America
- 5.4. Market Analysis, Insights and Forecast - by Region
- 5.4.1. North America
- 5.4.2. South America
- 5.4.3. Europe
- 5.4.4. Middle East & Africa
- 5.4.5. Asia Pacific
- 5.1. Market Analysis, Insights and Forecast - by Feedstock
- 6. North America Biodiesel Market Analysis, Insights and Forecast, 2019-2031
- 6.1. Market Analysis, Insights and Forecast - by Feedstock
- 6.1.1. Animal Fat
- 6.1.2. Vegetable Oil
- 6.1.3. Other Feedstocks
- 6.2. Market Analysis, Insights and Forecast - by Application
- 6.2.1. Transportation
- 6.2.2. Power Generation
- 6.2.3. Other Applications
- 6.3. Market Analysis, Insights and Forecast - by Geogrpahy
- 6.3.1. North America
- 6.3.1.1. United States
- 6.3.1.2. Canada
- 6.3.1.3. Rest of North America
- 6.3.2. Europe
- 6.3.2.1. Germany
- 6.3.2.2. France
- 6.3.2.3. United Kingdom
- 6.3.2.4. Spain
- 6.3.2.5. NORDIC
- 6.3.2.6. Turkey
- 6.3.2.7. Russia
- 6.3.2.8. Rest of Europe
- 6.3.3. Asia-Pacific
- 6.3.3.1. China
- 6.3.3.2. India
- 6.3.3.3. Malaysia
- 6.3.3.4. Indonesia
- 6.3.3.5. Vietnam
- 6.3.3.6. Thailand
- 6.3.3.7. Japan
- 6.3.3.8. Australia
- 6.3.3.9. Rest of Asia-Pacific
- 6.3.4. South America
- 6.3.4.1. Brazil
- 6.3.4.2. Argentina
- 6.3.4.3. Colombia
- 6.3.4.4. Rest of South America
- 6.3.5. Middle East and Africa
- 6.3.5.1. Saudi Arabia
- 6.3.5.2. United Arab Emirates
- 6.3.5.3. Egypt
- 6.3.5.4. Nigeria
- 6.3.5.5. Qatar
- 6.3.5.6. Rest of Middle East and Africa
- 6.3.1. North America
- 6.1. Market Analysis, Insights and Forecast - by Feedstock
- 7. South America Biodiesel Market Analysis, Insights and Forecast, 2019-2031
- 7.1. Market Analysis, Insights and Forecast - by Feedstock
- 7.1.1. Animal Fat
- 7.1.2. Vegetable Oil
- 7.1.3. Other Feedstocks
- 7.2. Market Analysis, Insights and Forecast - by Application
- 7.2.1. Transportation
- 7.2.2. Power Generation
- 7.2.3. Other Applications
- 7.3. Market Analysis, Insights and Forecast - by Geogrpahy
- 7.3.1. North America
- 7.3.1.1. United States
- 7.3.1.2. Canada
- 7.3.1.3. Rest of North America
- 7.3.2. Europe
- 7.3.2.1. Germany
- 7.3.2.2. France
- 7.3.2.3. United Kingdom
- 7.3.2.4. Spain
- 7.3.2.5. NORDIC
- 7.3.2.6. Turkey
- 7.3.2.7. Russia
- 7.3.2.8. Rest of Europe
- 7.3.3. Asia-Pacific
- 7.3.3.1. China
- 7.3.3.2. India
- 7.3.3.3. Malaysia
- 7.3.3.4. Indonesia
- 7.3.3.5. Vietnam
- 7.3.3.6. Thailand
- 7.3.3.7. Japan
- 7.3.3.8. Australia
- 7.3.3.9. Rest of Asia-Pacific
- 7.3.4. South America
- 7.3.4.1. Brazil
- 7.3.4.2. Argentina
- 7.3.4.3. Colombia
- 7.3.4.4. Rest of South America
- 7.3.5. Middle East and Africa
- 7.3.5.1. Saudi Arabia
- 7.3.5.2. United Arab Emirates
- 7.3.5.3. Egypt
- 7.3.5.4. Nigeria
- 7.3.5.5. Qatar
- 7.3.5.6. Rest of Middle East and Africa
- 7.3.1. North America
- 7.1. Market Analysis, Insights and Forecast - by Feedstock
- 8. Europe Biodiesel Market Analysis, Insights and Forecast, 2019-2031
- 8.1. Market Analysis, Insights and Forecast - by Feedstock
- 8.1.1. Animal Fat
- 8.1.2. Vegetable Oil
- 8.1.3. Other Feedstocks
- 8.2. Market Analysis, Insights and Forecast - by Application
- 8.2.1. Transportation
- 8.2.2. Power Generation
- 8.2.3. Other Applications
- 8.3. Market Analysis, Insights and Forecast - by Geogrpahy
- 8.3.1. North America
- 8.3.1.1. United States
- 8.3.1.2. Canada
- 8.3.1.3. Rest of North America
- 8.3.2. Europe
- 8.3.2.1. Germany
- 8.3.2.2. France
- 8.3.2.3. United Kingdom
- 8.3.2.4. Spain
- 8.3.2.5. NORDIC
- 8.3.2.6. Turkey
- 8.3.2.7. Russia
- 8.3.2.8. Rest of Europe
- 8.3.3. Asia-Pacific
- 8.3.3.1. China
- 8.3.3.2. India
- 8.3.3.3. Malaysia
- 8.3.3.4. Indonesia
- 8.3.3.5. Vietnam
- 8.3.3.6. Thailand
- 8.3.3.7. Japan
- 8.3.3.8. Australia
- 8.3.3.9. Rest of Asia-Pacific
- 8.3.4. South America
- 8.3.4.1. Brazil
- 8.3.4.2. Argentina
- 8.3.4.3. Colombia
- 8.3.4.4. Rest of South America
- 8.3.5. Middle East and Africa
- 8.3.5.1. Saudi Arabia
- 8.3.5.2. United Arab Emirates
- 8.3.5.3. Egypt
- 8.3.5.4. Nigeria
- 8.3.5.5. Qatar
- 8.3.5.6. Rest of Middle East and Africa
- 8.3.1. North America
- 8.1. Market Analysis, Insights and Forecast - by Feedstock
- 9. Middle East & Africa Biodiesel Market Analysis, Insights and Forecast, 2019-2031
- 9.1. Market Analysis, Insights and Forecast - by Feedstock
- 9.1.1. Animal Fat
- 9.1.2. Vegetable Oil
- 9.1.3. Other Feedstocks
- 9.2. Market Analysis, Insights and Forecast - by Application
- 9.2.1. Transportation
- 9.2.2. Power Generation
- 9.2.3. Other Applications
- 9.3. Market Analysis, Insights and Forecast - by Geogrpahy
- 9.3.1. North America
- 9.3.1.1. United States
- 9.3.1.2. Canada
- 9.3.1.3. Rest of North America
- 9.3.2. Europe
- 9.3.2.1. Germany
- 9.3.2.2. France
- 9.3.2.3. United Kingdom
- 9.3.2.4. Spain
- 9.3.2.5. NORDIC
- 9.3.2.6. Turkey
- 9.3.2.7. Russia
- 9.3.2.8. Rest of Europe
- 9.3.3. Asia-Pacific
- 9.3.3.1. China
- 9.3.3.2. India
- 9.3.3.3. Malaysia
- 9.3.3.4. Indonesia
- 9.3.3.5. Vietnam
- 9.3.3.6. Thailand
- 9.3.3.7. Japan
- 9.3.3.8. Australia
- 9.3.3.9. Rest of Asia-Pacific
- 9.3.4. South America
- 9.3.4.1. Brazil
- 9.3.4.2. Argentina
- 9.3.4.3. Colombia
- 9.3.4.4. Rest of South America
- 9.3.5. Middle East and Africa
- 9.3.5.1. Saudi Arabia
- 9.3.5.2. United Arab Emirates
- 9.3.5.3. Egypt
- 9.3.5.4. Nigeria
- 9.3.5.5. Qatar
- 9.3.5.6. Rest of Middle East and Africa
- 9.3.1. North America
- 9.1. Market Analysis, Insights and Forecast - by Feedstock
- 10. Asia Pacific Biodiesel Market Analysis, Insights and Forecast, 2019-2031
- 10.1. Market Analysis, Insights and Forecast - by Feedstock
- 10.1.1. Animal Fat
- 10.1.2. Vegetable Oil
- 10.1.3. Other Feedstocks
- 10.2. Market Analysis, Insights and Forecast - by Application
- 10.2.1. Transportation
- 10.2.2. Power Generation
- 10.2.3. Other Applications
- 10.3. Market Analysis, Insights and Forecast - by Geogrpahy
- 10.3.1. North America
- 10.3.1.1. United States
- 10.3.1.2. Canada
- 10.3.1.3. Rest of North America
- 10.3.2. Europe
- 10.3.2.1. Germany
- 10.3.2.2. France
- 10.3.2.3. United Kingdom
- 10.3.2.4. Spain
- 10.3.2.5. NORDIC
- 10.3.2.6. Turkey
- 10.3.2.7. Russia
- 10.3.2.8. Rest of Europe
- 10.3.3. Asia-Pacific
- 10.3.3.1. China
- 10.3.3.2. India
- 10.3.3.3. Malaysia
- 10.3.3.4. Indonesia
- 10.3.3.5. Vietnam
- 10.3.3.6. Thailand
- 10.3.3.7. Japan
- 10.3.3.8. Australia
- 10.3.3.9. Rest of Asia-Pacific
- 10.3.4. South America
- 10.3.4.1. Brazil
- 10.3.4.2. Argentina
- 10.3.4.3. Colombia
- 10.3.4.4. Rest of South America
- 10.3.5. Middle East and Africa
- 10.3.5.1. Saudi Arabia
- 10.3.5.2. United Arab Emirates
- 10.3.5.3. Egypt
- 10.3.5.4. Nigeria
- 10.3.5.5. Qatar
- 10.3.5.6. Rest of Middle East and Africa
- 10.3.1. North America
- 10.1. Market Analysis, Insights and Forecast - by Feedstock
- 11. North America Biodiesel Market Analysis, Insights and Forecast, 2019-2031
- 11.1. Market Analysis, Insights and Forecast - By Country/Sub-region
- 11.1.1 United States
- 11.1.2 Canada
- 11.1.3 Mexico
- 12. Europe Biodiesel Market Analysis, Insights and Forecast, 2019-2031
- 12.1. Market Analysis, Insights and Forecast - By Country/Sub-region
- 12.1.1 Germany
- 12.1.2 United Kingdom
- 12.1.3 France
- 12.1.4 Spain
- 12.1.5 Italy
- 12.1.6 Spain
- 12.1.7 Belgium
- 12.1.8 Netherland
- 12.1.9 Nordics
- 12.1.10 Rest of Europe
- 13. Asia Pacific Biodiesel Market Analysis, Insights and Forecast, 2019-2031
- 13.1. Market Analysis, Insights and Forecast - By Country/Sub-region
- 13.1.1 China
- 13.1.2 Japan
- 13.1.3 India
- 13.1.4 South Korea
- 13.1.5 Southeast Asia
- 13.1.6 Australia
- 13.1.7 Indonesia
- 13.1.8 Phillipes
- 13.1.9 Singapore
- 13.1.10 Thailandc
- 13.1.11 Rest of Asia Pacific
- 14. South America Biodiesel Market Analysis, Insights and Forecast, 2019-2031
- 14.1. Market Analysis, Insights and Forecast - By Country/Sub-region
- 14.1.1 Brazil
- 14.1.2 Argentina
- 14.1.3 Peru
- 14.1.4 Chile
- 14.1.5 Colombia
- 14.1.6 Ecuador
- 14.1.7 Venezuela
- 14.1.8 Rest of South America
- 15. MEA Biodiesel Market Analysis, Insights and Forecast, 2019-2031
- 15.1. Market Analysis, Insights and Forecast - By Country/Sub-region
- 15.1.1 United Arab Emirates
- 15.1.2 Saudi Arabia
- 15.1.3 South Africa
- 15.1.4 Rest of Middle East and Africa
- 16. Competitive Analysis
- 16.1. Global Market Share Analysis 2024
- 16.2. Company Profiles
- 16.2.1 Ag Processing Inc
- 16.2.1.1. Overview
- 16.2.1.2. Products
- 16.2.1.3. SWOT Analysis
- 16.2.1.4. Recent Developments
- 16.2.1.5. Financials (Based on Availability)
- 16.2.2 Archer Daniels Midland Company
- 16.2.2.1. Overview
- 16.2.2.2. Products
- 16.2.2.3. SWOT Analysis
- 16.2.2.4. Recent Developments
- 16.2.2.5. Financials (Based on Availability)
- 16.2.3 BIOX Corporation
- 16.2.3.1. Overview
- 16.2.3.2. Products
- 16.2.3.3. SWOT Analysis
- 16.2.3.4. Recent Developments
- 16.2.3.5. Financials (Based on Availability)
- 16.2.4 Neste Oyj
- 16.2.4.1. Overview
- 16.2.4.2. Products
- 16.2.4.3. SWOT Analysis
- 16.2.4.4. Recent Developments
- 16.2.4.5. Financials (Based on Availability)
- 16.2.5 Wilmar International Ltd
- 16.2.5.1. Overview
- 16.2.5.2. Products
- 16.2.5.3. SWOT Analysis
- 16.2.5.4. Recent Developments
- 16.2.5.5. Financials (Based on Availability)
- 16.2.6 Cargill Inc
- 16.2.6.1. Overview
- 16.2.6.2. Products
- 16.2.6.3. SWOT Analysis
- 16.2.6.4. Recent Developments
- 16.2.6.5. Financials (Based on Availability)
- 16.2.7 Bangchak Corporation Public Company Limited
- 16.2.7.1. Overview
- 16.2.7.2. Products
- 16.2.7.3. SWOT Analysis
- 16.2.7.4. Recent Developments
- 16.2.7.5. Financials (Based on Availability)
- 16.2.8 Renewable Energy Group Inc
- 16.2.8.1. Overview
- 16.2.8.2. Products
- 16.2.8.3. SWOT Analysis
- 16.2.8.4. Recent Developments
- 16.2.8.5. Financials (Based on Availability)
- 16.2.1 Ag Processing Inc
List of Figures
- Figure 1: Global Biodiesel Market Revenue Breakdown (Million, %) by Region 2024 & 2032
- Figure 2: Global Biodiesel Market Volume Breakdown (Gallons, %) by Region 2024 & 2032
- Figure 3: North America Biodiesel Market Revenue (Million), by Country 2024 & 2032
- Figure 4: North America Biodiesel Market Volume (Gallons), by Country 2024 & 2032
- Figure 5: North America Biodiesel Market Revenue Share (%), by Country 2024 & 2032
- Figure 6: North America Biodiesel Market Volume Share (%), by Country 2024 & 2032
- Figure 7: Europe Biodiesel Market Revenue (Million), by Country 2024 & 2032
- Figure 8: Europe Biodiesel Market Volume (Gallons), by Country 2024 & 2032
- Figure 9: Europe Biodiesel Market Revenue Share (%), by Country 2024 & 2032
- Figure 10: Europe Biodiesel Market Volume Share (%), by Country 2024 & 2032
- Figure 11: Asia Pacific Biodiesel Market Revenue (Million), by Country 2024 & 2032
- Figure 12: Asia Pacific Biodiesel Market Volume (Gallons), by Country 2024 & 2032
- Figure 13: Asia Pacific Biodiesel Market Revenue Share (%), by Country 2024 & 2032
- Figure 14: Asia Pacific Biodiesel Market Volume Share (%), by Country 2024 & 2032
- Figure 15: South America Biodiesel Market Revenue (Million), by Country 2024 & 2032
- Figure 16: South America Biodiesel Market Volume (Gallons), by Country 2024 & 2032
- Figure 17: South America Biodiesel Market Revenue Share (%), by Country 2024 & 2032
- Figure 18: South America Biodiesel Market Volume Share (%), by Country 2024 & 2032
- Figure 19: MEA Biodiesel Market Revenue (Million), by Country 2024 & 2032
- Figure 20: MEA Biodiesel Market Volume (Gallons), by Country 2024 & 2032
- Figure 21: MEA Biodiesel Market Revenue Share (%), by Country 2024 & 2032
- Figure 22: MEA Biodiesel Market Volume Share (%), by Country 2024 & 2032
- Figure 23: North America Biodiesel Market Revenue (Million), by Feedstock 2024 & 2032
- Figure 24: North America Biodiesel Market Volume (Gallons), by Feedstock 2024 & 2032
- Figure 25: North America Biodiesel Market Revenue Share (%), by Feedstock 2024 & 2032
- Figure 26: North America Biodiesel Market Volume Share (%), by Feedstock 2024 & 2032
- Figure 27: North America Biodiesel Market Revenue (Million), by Application 2024 & 2032
- Figure 28: North America Biodiesel Market Volume (Gallons), by Application 2024 & 2032
- Figure 29: North America Biodiesel Market Revenue Share (%), by Application 2024 & 2032
- Figure 30: North America Biodiesel Market Volume Share (%), by Application 2024 & 2032
- Figure 31: North America Biodiesel Market Revenue (Million), by Geogrpahy 2024 & 2032
- Figure 32: North America Biodiesel Market Volume (Gallons), by Geogrpahy 2024 & 2032
- Figure 33: North America Biodiesel Market Revenue Share (%), by Geogrpahy 2024 & 2032
- Figure 34: North America Biodiesel Market Volume Share (%), by Geogrpahy 2024 & 2032
- Figure 35: North America Biodiesel Market Revenue (Million), by Country 2024 & 2032
- Figure 36: North America Biodiesel Market Volume (Gallons), by Country 2024 & 2032
- Figure 37: North America Biodiesel Market Revenue Share (%), by Country 2024 & 2032
- Figure 38: North America Biodiesel Market Volume Share (%), by Country 2024 & 2032
- Figure 39: South America Biodiesel Market Revenue (Million), by Feedstock 2024 & 2032
- Figure 40: South America Biodiesel Market Volume (Gallons), by Feedstock 2024 & 2032
- Figure 41: South America Biodiesel Market Revenue Share (%), by Feedstock 2024 & 2032
- Figure 42: South America Biodiesel Market Volume Share (%), by Feedstock 2024 & 2032
- Figure 43: South America Biodiesel Market Revenue (Million), by Application 2024 & 2032
- Figure 44: South America Biodiesel Market Volume (Gallons), by Application 2024 & 2032
- Figure 45: South America Biodiesel Market Revenue Share (%), by Application 2024 & 2032
- Figure 46: South America Biodiesel Market Volume Share (%), by Application 2024 & 2032
- Figure 47: South America Biodiesel Market Revenue (Million), by Geogrpahy 2024 & 2032
- Figure 48: South America Biodiesel Market Volume (Gallons), by Geogrpahy 2024 & 2032
- Figure 49: South America Biodiesel Market Revenue Share (%), by Geogrpahy 2024 & 2032
- Figure 50: South America Biodiesel Market Volume Share (%), by Geogrpahy 2024 & 2032
- Figure 51: South America Biodiesel Market Revenue (Million), by Country 2024 & 2032
- Figure 52: South America Biodiesel Market Volume (Gallons), by Country 2024 & 2032
- Figure 53: South America Biodiesel Market Revenue Share (%), by Country 2024 & 2032
- Figure 54: South America Biodiesel Market Volume Share (%), by Country 2024 & 2032
- Figure 55: Europe Biodiesel Market Revenue (Million), by Feedstock 2024 & 2032
- Figure 56: Europe Biodiesel Market Volume (Gallons), by Feedstock 2024 & 2032
- Figure 57: Europe Biodiesel Market Revenue Share (%), by Feedstock 2024 & 2032
- Figure 58: Europe Biodiesel Market Volume Share (%), by Feedstock 2024 & 2032
- Figure 59: Europe Biodiesel Market Revenue (Million), by Application 2024 & 2032
- Figure 60: Europe Biodiesel Market Volume (Gallons), by Application 2024 & 2032
- Figure 61: Europe Biodiesel Market Revenue Share (%), by Application 2024 & 2032
- Figure 62: Europe Biodiesel Market Volume Share (%), by Application 2024 & 2032
- Figure 63: Europe Biodiesel Market Revenue (Million), by Geogrpahy 2024 & 2032
- Figure 64: Europe Biodiesel Market Volume (Gallons), by Geogrpahy 2024 & 2032
- Figure 65: Europe Biodiesel Market Revenue Share (%), by Geogrpahy 2024 & 2032
- Figure 66: Europe Biodiesel Market Volume Share (%), by Geogrpahy 2024 & 2032
- Figure 67: Europe Biodiesel Market Revenue (Million), by Country 2024 & 2032
- Figure 68: Europe Biodiesel Market Volume (Gallons), by Country 2024 & 2032
- Figure 69: Europe Biodiesel Market Revenue Share (%), by Country 2024 & 2032
- Figure 70: Europe Biodiesel Market Volume Share (%), by Country 2024 & 2032
- Figure 71: Middle East & Africa Biodiesel Market Revenue (Million), by Feedstock 2024 & 2032
- Figure 72: Middle East & Africa Biodiesel Market Volume (Gallons), by Feedstock 2024 & 2032
- Figure 73: Middle East & Africa Biodiesel Market Revenue Share (%), by Feedstock 2024 & 2032
- Figure 74: Middle East & Africa Biodiesel Market Volume Share (%), by Feedstock 2024 & 2032
- Figure 75: Middle East & Africa Biodiesel Market Revenue (Million), by Application 2024 & 2032
- Figure 76: Middle East & Africa Biodiesel Market Volume (Gallons), by Application 2024 & 2032
- Figure 77: Middle East & Africa Biodiesel Market Revenue Share (%), by Application 2024 & 2032
- Figure 78: Middle East & Africa Biodiesel Market Volume Share (%), by Application 2024 & 2032
- Figure 79: Middle East & Africa Biodiesel Market Revenue (Million), by Geogrpahy 2024 & 2032
- Figure 80: Middle East & Africa Biodiesel Market Volume (Gallons), by Geogrpahy 2024 & 2032
- Figure 81: Middle East & Africa Biodiesel Market Revenue Share (%), by Geogrpahy 2024 & 2032
- Figure 82: Middle East & Africa Biodiesel Market Volume Share (%), by Geogrpahy 2024 & 2032
- Figure 83: Middle East & Africa Biodiesel Market Revenue (Million), by Country 2024 & 2032
- Figure 84: Middle East & Africa Biodiesel Market Volume (Gallons), by Country 2024 & 2032
- Figure 85: Middle East & Africa Biodiesel Market Revenue Share (%), by Country 2024 & 2032
- Figure 86: Middle East & Africa Biodiesel Market Volume Share (%), by Country 2024 & 2032
- Figure 87: Asia Pacific Biodiesel Market Revenue (Million), by Feedstock 2024 & 2032
- Figure 88: Asia Pacific Biodiesel Market Volume (Gallons), by Feedstock 2024 & 2032
- Figure 89: Asia Pacific Biodiesel Market Revenue Share (%), by Feedstock 2024 & 2032
- Figure 90: Asia Pacific Biodiesel Market Volume Share (%), by Feedstock 2024 & 2032
- Figure 91: Asia Pacific Biodiesel Market Revenue (Million), by Application 2024 & 2032
- Figure 92: Asia Pacific Biodiesel Market Volume (Gallons), by Application 2024 & 2032
- Figure 93: Asia Pacific Biodiesel Market Revenue Share (%), by Application 2024 & 2032
- Figure 94: Asia Pacific Biodiesel Market Volume Share (%), by Application 2024 & 2032
- Figure 95: Asia Pacific Biodiesel Market Revenue (Million), by Geogrpahy 2024 & 2032
- Figure 96: Asia Pacific Biodiesel Market Volume (Gallons), by Geogrpahy 2024 & 2032
- Figure 97: Asia Pacific Biodiesel Market Revenue Share (%), by Geogrpahy 2024 & 2032
- Figure 98: Asia Pacific Biodiesel Market Volume Share (%), by Geogrpahy 2024 & 2032
- Figure 99: Asia Pacific Biodiesel Market Revenue (Million), by Country 2024 & 2032
- Figure 100: Asia Pacific Biodiesel Market Volume (Gallons), by Country 2024 & 2032
- Figure 101: Asia Pacific Biodiesel Market Revenue Share (%), by Country 2024 & 2032
- Figure 102: Asia Pacific Biodiesel Market Volume Share (%), by Country 2024 & 2032
List of Tables
- Table 1: Global Biodiesel Market Revenue Million Forecast, by Region 2019 & 2032
- Table 2: Global Biodiesel Market Volume Gallons Forecast, by Region 2019 & 2032
- Table 3: Global Biodiesel Market Revenue Million Forecast, by Feedstock 2019 & 2032
- Table 4: Global Biodiesel Market Volume Gallons Forecast, by Feedstock 2019 & 2032
- Table 5: Global Biodiesel Market Revenue Million Forecast, by Application 2019 & 2032
- Table 6: Global Biodiesel Market Volume Gallons Forecast, by Application 2019 & 2032
- Table 7: Global Biodiesel Market Revenue Million Forecast, by Geogrpahy 2019 & 2032
- Table 8: Global Biodiesel Market Volume Gallons Forecast, by Geogrpahy 2019 & 2032
- Table 9: Global Biodiesel Market Revenue Million Forecast, by Region 2019 & 2032
- Table 10: Global Biodiesel Market Volume Gallons Forecast, by Region 2019 & 2032
- Table 11: Global Biodiesel Market Revenue Million Forecast, by Country 2019 & 2032
- Table 12: Global Biodiesel Market Volume Gallons Forecast, by Country 2019 & 2032
- Table 13: United States Biodiesel Market Revenue (Million) Forecast, by Application 2019 & 2032
- Table 14: United States Biodiesel Market Volume (Gallons) Forecast, by Application 2019 & 2032
- Table 15: Canada Biodiesel Market Revenue (Million) Forecast, by Application 2019 & 2032
- Table 16: Canada Biodiesel Market Volume (Gallons) Forecast, by Application 2019 & 2032
- Table 17: Mexico Biodiesel Market Revenue (Million) Forecast, by Application 2019 & 2032
- Table 18: Mexico Biodiesel Market Volume (Gallons) Forecast, by Application 2019 & 2032
- Table 19: Global Biodiesel Market Revenue Million Forecast, by Country 2019 & 2032
- Table 20: Global Biodiesel Market Volume Gallons Forecast, by Country 2019 & 2032
- Table 21: Germany Biodiesel Market Revenue (Million) Forecast, by Application 2019 & 2032
- Table 22: Germany Biodiesel Market Volume (Gallons) Forecast, by Application 2019 & 2032
- Table 23: United Kingdom Biodiesel Market Revenue (Million) Forecast, by Application 2019 & 2032
- Table 24: United Kingdom Biodiesel Market Volume (Gallons) Forecast, by Application 2019 & 2032
- Table 25: France Biodiesel Market Revenue (Million) Forecast, by Application 2019 & 2032
- Table 26: France Biodiesel Market Volume (Gallons) Forecast, by Application 2019 & 2032
- Table 27: Spain Biodiesel Market Revenue (Million) Forecast, by Application 2019 & 2032
- Table 28: Spain Biodiesel Market Volume (Gallons) Forecast, by Application 2019 & 2032
- Table 29: Italy Biodiesel Market Revenue (Million) Forecast, by Application 2019 & 2032
- Table 30: Italy Biodiesel Market Volume (Gallons) Forecast, by Application 2019 & 2032
- Table 31: Spain Biodiesel Market Revenue (Million) Forecast, by Application 2019 & 2032
- Table 32: Spain Biodiesel Market Volume (Gallons) Forecast, by Application 2019 & 2032
- Table 33: Belgium Biodiesel Market Revenue (Million) Forecast, by Application 2019 & 2032
- Table 34: Belgium Biodiesel Market Volume (Gallons) Forecast, by Application 2019 & 2032
- Table 35: Netherland Biodiesel Market Revenue (Million) Forecast, by Application 2019 & 2032
- Table 36: Netherland Biodiesel Market Volume (Gallons) Forecast, by Application 2019 & 2032
- Table 37: Nordics Biodiesel Market Revenue (Million) Forecast, by Application 2019 & 2032
- Table 38: Nordics Biodiesel Market Volume (Gallons) Forecast, by Application 2019 & 2032
- Table 39: Rest of Europe Biodiesel Market Revenue (Million) Forecast, by Application 2019 & 2032
- Table 40: Rest of Europe Biodiesel Market Volume (Gallons) Forecast, by Application 2019 & 2032
- Table 41: Global Biodiesel Market Revenue Million Forecast, by Country 2019 & 2032
- Table 42: Global Biodiesel Market Volume Gallons Forecast, by Country 2019 & 2032
- Table 43: China Biodiesel Market Revenue (Million) Forecast, by Application 2019 & 2032
- Table 44: China Biodiesel Market Volume (Gallons) Forecast, by Application 2019 & 2032
- Table 45: Japan Biodiesel Market Revenue (Million) Forecast, by Application 2019 & 2032
- Table 46: Japan Biodiesel Market Volume (Gallons) Forecast, by Application 2019 & 2032
- Table 47: India Biodiesel Market Revenue (Million) Forecast, by Application 2019 & 2032
- Table 48: India Biodiesel Market Volume (Gallons) Forecast, by Application 2019 & 2032
- Table 49: South Korea Biodiesel Market Revenue (Million) Forecast, by Application 2019 & 2032
- Table 50: South Korea Biodiesel Market Volume (Gallons) Forecast, by Application 2019 & 2032
- Table 51: Southeast Asia Biodiesel Market Revenue (Million) Forecast, by Application 2019 & 2032
- Table 52: Southeast Asia Biodiesel Market Volume (Gallons) Forecast, by Application 2019 & 2032
- Table 53: Australia Biodiesel Market Revenue (Million) Forecast, by Application 2019 & 2032
- Table 54: Australia Biodiesel Market Volume (Gallons) Forecast, by Application 2019 & 2032
- Table 55: Indonesia Biodiesel Market Revenue (Million) Forecast, by Application 2019 & 2032
- Table 56: Indonesia Biodiesel Market Volume (Gallons) Forecast, by Application 2019 & 2032
- Table 57: Phillipes Biodiesel Market Revenue (Million) Forecast, by Application 2019 & 2032
- Table 58: Phillipes Biodiesel Market Volume (Gallons) Forecast, by Application 2019 & 2032
- Table 59: Singapore Biodiesel Market Revenue (Million) Forecast, by Application 2019 & 2032
- Table 60: Singapore Biodiesel Market Volume (Gallons) Forecast, by Application 2019 & 2032
- Table 61: Thailandc Biodiesel Market Revenue (Million) Forecast, by Application 2019 & 2032
- Table 62: Thailandc Biodiesel Market Volume (Gallons) Forecast, by Application 2019 & 2032
- Table 63: Rest of Asia Pacific Biodiesel Market Revenue (Million) Forecast, by Application 2019 & 2032
- Table 64: Rest of Asia Pacific Biodiesel Market Volume (Gallons) Forecast, by Application 2019 & 2032
- Table 65: Global Biodiesel Market Revenue Million Forecast, by Country 2019 & 2032
- Table 66: Global Biodiesel Market Volume Gallons Forecast, by Country 2019 & 2032
- Table 67: Brazil Biodiesel Market Revenue (Million) Forecast, by Application 2019 & 2032
- Table 68: Brazil Biodiesel Market Volume (Gallons) Forecast, by Application 2019 & 2032
- Table 69: Argentina Biodiesel Market Revenue (Million) Forecast, by Application 2019 & 2032
- Table 70: Argentina Biodiesel Market Volume (Gallons) Forecast, by Application 2019 & 2032
- Table 71: Peru Biodiesel Market Revenue (Million) Forecast, by Application 2019 & 2032
- Table 72: Peru Biodiesel Market Volume (Gallons) Forecast, by Application 2019 & 2032
- Table 73: Chile Biodiesel Market Revenue (Million) Forecast, by Application 2019 & 2032
- Table 74: Chile Biodiesel Market Volume (Gallons) Forecast, by Application 2019 & 2032
- Table 75: Colombia Biodiesel Market Revenue (Million) Forecast, by Application 2019 & 2032
- Table 76: Colombia Biodiesel Market Volume (Gallons) Forecast, by Application 2019 & 2032
- Table 77: Ecuador Biodiesel Market Revenue (Million) Forecast, by Application 2019 & 2032
- Table 78: Ecuador Biodiesel Market Volume (Gallons) Forecast, by Application 2019 & 2032
- Table 79: Venezuela Biodiesel Market Revenue (Million) Forecast, by Application 2019 & 2032
- Table 80: Venezuela Biodiesel Market Volume (Gallons) Forecast, by Application 2019 & 2032
- Table 81: Rest of South America Biodiesel Market Revenue (Million) Forecast, by Application 2019 & 2032
- Table 82: Rest of South America Biodiesel Market Volume (Gallons) Forecast, by Application 2019 & 2032
- Table 83: Global Biodiesel Market Revenue Million Forecast, by Country 2019 & 2032
- Table 84: Global Biodiesel Market Volume Gallons Forecast, by Country 2019 & 2032
- Table 85: United Arab Emirates Biodiesel Market Revenue (Million) Forecast, by Application 2019 & 2032
- Table 86: United Arab Emirates Biodiesel Market Volume (Gallons) Forecast, by Application 2019 & 2032
- Table 87: Saudi Arabia Biodiesel Market Revenue (Million) Forecast, by Application 2019 & 2032
- Table 88: Saudi Arabia Biodiesel Market Volume (Gallons) Forecast, by Application 2019 & 2032
- Table 89: South Africa Biodiesel Market Revenue (Million) Forecast, by Application 2019 & 2032
- Table 90: South Africa Biodiesel Market Volume (Gallons) Forecast, by Application 2019 & 2032
- Table 91: Rest of Middle East and Africa Biodiesel Market Revenue (Million) Forecast, by Application 2019 & 2032
- Table 92: Rest of Middle East and Africa Biodiesel Market Volume (Gallons) Forecast, by Application 2019 & 2032
- Table 93: Global Biodiesel Market Revenue Million Forecast, by Feedstock 2019 & 2032
- Table 94: Global Biodiesel Market Volume Gallons Forecast, by Feedstock 2019 & 2032
- Table 95: Global Biodiesel Market Revenue Million Forecast, by Application 2019 & 2032
- Table 96: Global Biodiesel Market Volume Gallons Forecast, by Application 2019 & 2032
- Table 97: Global Biodiesel Market Revenue Million Forecast, by Geogrpahy 2019 & 2032
- Table 98: Global Biodiesel Market Volume Gallons Forecast, by Geogrpahy 2019 & 2032
- Table 99: Global Biodiesel Market Revenue Million Forecast, by Country 2019 & 2032
- Table 100: Global Biodiesel Market Volume Gallons Forecast, by Country 2019 & 2032
- Table 101: United States Biodiesel Market Revenue (Million) Forecast, by Application 2019 & 2032
- Table 102: United States Biodiesel Market Volume (Gallons) Forecast, by Application 2019 & 2032
- Table 103: Canada Biodiesel Market Revenue (Million) Forecast, by Application 2019 & 2032
- Table 104: Canada Biodiesel Market Volume (Gallons) Forecast, by Application 2019 & 2032
- Table 105: Mexico Biodiesel Market Revenue (Million) Forecast, by Application 2019 & 2032
- Table 106: Mexico Biodiesel Market Volume (Gallons) Forecast, by Application 2019 & 2032
- Table 107: Global Biodiesel Market Revenue Million Forecast, by Feedstock 2019 & 2032
- Table 108: Global Biodiesel Market Volume Gallons Forecast, by Feedstock 2019 & 2032
- Table 109: Global Biodiesel Market Revenue Million Forecast, by Application 2019 & 2032
- Table 110: Global Biodiesel Market Volume Gallons Forecast, by Application 2019 & 2032
- Table 111: Global Biodiesel Market Revenue Million Forecast, by Geogrpahy 2019 & 2032
- Table 112: Global Biodiesel Market Volume Gallons Forecast, by Geogrpahy 2019 & 2032
- Table 113: Global Biodiesel Market Revenue Million Forecast, by Country 2019 & 2032
- Table 114: Global Biodiesel Market Volume Gallons Forecast, by Country 2019 & 2032
- Table 115: Brazil Biodiesel Market Revenue (Million) Forecast, by Application 2019 & 2032
- Table 116: Brazil Biodiesel Market Volume (Gallons) Forecast, by Application 2019 & 2032
- Table 117: Argentina Biodiesel Market Revenue (Million) Forecast, by Application 2019 & 2032
- Table 118: Argentina Biodiesel Market Volume (Gallons) Forecast, by Application 2019 & 2032
- Table 119: Rest of South America Biodiesel Market Revenue (Million) Forecast, by Application 2019 & 2032
- Table 120: Rest of South America Biodiesel Market Volume (Gallons) Forecast, by Application 2019 & 2032
- Table 121: Global Biodiesel Market Revenue Million Forecast, by Feedstock 2019 & 2032
- Table 122: Global Biodiesel Market Volume Gallons Forecast, by Feedstock 2019 & 2032
- Table 123: Global Biodiesel Market Revenue Million Forecast, by Application 2019 & 2032
- Table 124: Global Biodiesel Market Volume Gallons Forecast, by Application 2019 & 2032
- Table 125: Global Biodiesel Market Revenue Million Forecast, by Geogrpahy 2019 & 2032
- Table 126: Global Biodiesel Market Volume Gallons Forecast, by Geogrpahy 2019 & 2032
- Table 127: Global Biodiesel Market Revenue Million Forecast, by Country 2019 & 2032
- Table 128: Global Biodiesel Market Volume Gallons Forecast, by Country 2019 & 2032
- Table 129: United Kingdom Biodiesel Market Revenue (Million) Forecast, by Application 2019 & 2032
- Table 130: United Kingdom Biodiesel Market Volume (Gallons) Forecast, by Application 2019 & 2032
- Table 131: Germany Biodiesel Market Revenue (Million) Forecast, by Application 2019 & 2032
- Table 132: Germany Biodiesel Market Volume (Gallons) Forecast, by Application 2019 & 2032
- Table 133: France Biodiesel Market Revenue (Million) Forecast, by Application 2019 & 2032
- Table 134: France Biodiesel Market Volume (Gallons) Forecast, by Application 2019 & 2032
- Table 135: Italy Biodiesel Market Revenue (Million) Forecast, by Application 2019 & 2032
- Table 136: Italy Biodiesel Market Volume (Gallons) Forecast, by Application 2019 & 2032
- Table 137: Spain Biodiesel Market Revenue (Million) Forecast, by Application 2019 & 2032
- Table 138: Spain Biodiesel Market Volume (Gallons) Forecast, by Application 2019 & 2032
- Table 139: Russia Biodiesel Market Revenue (Million) Forecast, by Application 2019 & 2032
- Table 140: Russia Biodiesel Market Volume (Gallons) Forecast, by Application 2019 & 2032
- Table 141: Benelux Biodiesel Market Revenue (Million) Forecast, by Application 2019 & 2032
- Table 142: Benelux Biodiesel Market Volume (Gallons) Forecast, by Application 2019 & 2032
- Table 143: Nordics Biodiesel Market Revenue (Million) Forecast, by Application 2019 & 2032
- Table 144: Nordics Biodiesel Market Volume (Gallons) Forecast, by Application 2019 & 2032
- Table 145: Rest of Europe Biodiesel Market Revenue (Million) Forecast, by Application 2019 & 2032
- Table 146: Rest of Europe Biodiesel Market Volume (Gallons) Forecast, by Application 2019 & 2032
- Table 147: Global Biodiesel Market Revenue Million Forecast, by Feedstock 2019 & 2032
- Table 148: Global Biodiesel Market Volume Gallons Forecast, by Feedstock 2019 & 2032
- Table 149: Global Biodiesel Market Revenue Million Forecast, by Application 2019 & 2032
- Table 150: Global Biodiesel Market Volume Gallons Forecast, by Application 2019 & 2032
- Table 151: Global Biodiesel Market Revenue Million Forecast, by Geogrpahy 2019 & 2032
- Table 152: Global Biodiesel Market Volume Gallons Forecast, by Geogrpahy 2019 & 2032
- Table 153: Global Biodiesel Market Revenue Million Forecast, by Country 2019 & 2032
- Table 154: Global Biodiesel Market Volume Gallons Forecast, by Country 2019 & 2032
- Table 155: Turkey Biodiesel Market Revenue (Million) Forecast, by Application 2019 & 2032
- Table 156: Turkey Biodiesel Market Volume (Gallons) Forecast, by Application 2019 & 2032
- Table 157: Israel Biodiesel Market Revenue (Million) Forecast, by Application 2019 & 2032
- Table 158: Israel Biodiesel Market Volume (Gallons) Forecast, by Application 2019 & 2032
- Table 159: GCC Biodiesel Market Revenue (Million) Forecast, by Application 2019 & 2032
- Table 160: GCC Biodiesel Market Volume (Gallons) Forecast, by Application 2019 & 2032
- Table 161: North Africa Biodiesel Market Revenue (Million) Forecast, by Application 2019 & 2032
- Table 162: North Africa Biodiesel Market Volume (Gallons) Forecast, by Application 2019 & 2032
- Table 163: South Africa Biodiesel Market Revenue (Million) Forecast, by Application 2019 & 2032
- Table 164: South Africa Biodiesel Market Volume (Gallons) Forecast, by Application 2019 & 2032
- Table 165: Rest of Middle East & Africa Biodiesel Market Revenue (Million) Forecast, by Application 2019 & 2032
- Table 166: Rest of Middle East & Africa Biodiesel Market Volume (Gallons) Forecast, by Application 2019 & 2032
- Table 167: Global Biodiesel Market Revenue Million Forecast, by Feedstock 2019 & 2032
- Table 168: Global Biodiesel Market Volume Gallons Forecast, by Feedstock 2019 & 2032
- Table 169: Global Biodiesel Market Revenue Million Forecast, by Application 2019 & 2032
- Table 170: Global Biodiesel Market Volume Gallons Forecast, by Application 2019 & 2032
- Table 171: Global Biodiesel Market Revenue Million Forecast, by Geogrpahy 2019 & 2032
- Table 172: Global Biodiesel Market Volume Gallons Forecast, by Geogrpahy 2019 & 2032
- Table 173: Global Biodiesel Market Revenue Million Forecast, by Country 2019 & 2032
- Table 174: Global Biodiesel Market Volume Gallons Forecast, by Country 2019 & 2032
- Table 175: China Biodiesel Market Revenue (Million) Forecast, by Application 2019 & 2032
- Table 176: China Biodiesel Market Volume (Gallons) Forecast, by Application 2019 & 2032
- Table 177: India Biodiesel Market Revenue (Million) Forecast, by Application 2019 & 2032
- Table 178: India Biodiesel Market Volume (Gallons) Forecast, by Application 2019 & 2032
- Table 179: Japan Biodiesel Market Revenue (Million) Forecast, by Application 2019 & 2032
- Table 180: Japan Biodiesel Market Volume (Gallons) Forecast, by Application 2019 & 2032
- Table 181: South Korea Biodiesel Market Revenue (Million) Forecast, by Application 2019 & 2032
- Table 182: South Korea Biodiesel Market Volume (Gallons) Forecast, by Application 2019 & 2032
- Table 183: ASEAN Biodiesel Market Revenue (Million) Forecast, by Application 2019 & 2032
- Table 184: ASEAN Biodiesel Market Volume (Gallons) Forecast, by Application 2019 & 2032
- Table 185: Oceania Biodiesel Market Revenue (Million) Forecast, by Application 2019 & 2032
- Table 186: Oceania Biodiesel Market Volume (Gallons) Forecast, by Application 2019 & 2032
- Table 187: Rest of Asia Pacific Biodiesel Market Revenue (Million) Forecast, by Application 2019 & 2032
- Table 188: Rest of Asia Pacific Biodiesel Market Volume (Gallons) Forecast, by Application 2019 & 2032
Frequently Asked Questions
1. What is the projected Compound Annual Growth Rate (CAGR) of the Biodiesel Market?
The projected CAGR is approximately 7.70%.
2. Which companies are prominent players in the Biodiesel Market?
Key companies in the market include Ag Processing Inc, Archer Daniels Midland Company, BIOX Corporation, Neste Oyj, Wilmar International Ltd, Cargill Inc, Bangchak Corporation Public Company Limited, Renewable Energy Group Inc.
3. What are the main segments of the Biodiesel Market?
The market segments include Feedstock, Application, Geogrpahy.
4. Can you provide details about the market size?
The market size is estimated to be USD 34.66 Million as of 2022.
5. What are some drivers contributing to market growth?
4.; The Increasing Demand for Eco-friendly Fuels 4.; Government Support for Biodiesel Production.
6. What are the notable trends driving market growth?
The Transportation Segment Expected to Dominate the Market.
7. Are there any restraints impacting market growth?
4.; The Need for More Feedstock Availability for Biodiesel Generation.
8. Can you provide examples of recent developments in the market?
November 2022: Technip Energies received a contract from TotalEnergies to produce Sustainable Aviation Fuel (SAF) at the Grandpuits platform in France. The contract covers the EPC assistance for converting the refinery into a zero-crude platform focused on SAF. This facility can produce around 210,000 metric tons per year.
9. What pricing options are available for accessing the report?
Pricing options include single-user, multi-user, and enterprise licenses priced at USD 4750, USD 5250, and USD 8750 respectively.
10. Is the market size provided in terms of value or volume?
The market size is provided in terms of value, measured in Million and volume, measured in Gallons.
11. Are there any specific market keywords associated with the report?
Yes, the market keyword associated with the report is "Biodiesel Market," which aids in identifying and referencing the specific market segment covered.
12. How do I determine which pricing option suits my needs best?
The pricing options vary based on user requirements and access needs. Individual users may opt for single-user licenses, while businesses requiring broader access may choose multi-user or enterprise licenses for cost-effective access to the report.
13. Are there any additional resources or data provided in the Biodiesel Market report?
While the report offers comprehensive insights, it's advisable to review the specific contents or supplementary materials provided to ascertain if additional resources or data are available.
14. How can I stay updated on further developments or reports in the Biodiesel Market?
To stay informed about further developments, trends, and reports in the Biodiesel Market, consider subscribing to industry newsletters, following relevant companies and organizations, or regularly checking reputable industry news sources and publications.
Methodology
Step 1 - Identification of Relevant Samples Size from Population Database


Step 2 - Approaches for Defining Global Market Size (Value, Volume* & Price*)

Note*: In applicable scenarios
Step 3 - Data Sources
Primary Research
- Web Analytics
- Survey Reports
- Research Institute
- Latest Research Reports
- Opinion Leaders
Secondary Research
- Annual Reports
- White Paper
- Latest Press Release
- Industry Association
- Paid Database
- Investor Presentations

Step 4 - Data Triangulation
Involves using different sources of information in order to increase the validity of a study
These sources are likely to be stakeholders in a program - participants, other researchers, program staff, other community members, and so on.
Then we put all data in single framework & apply various statistical tools to find out the dynamic on the market.
During the analysis stage, feedback from the stakeholder groups would be compared to determine areas of agreement as well as areas of divergence


