

Key Insights
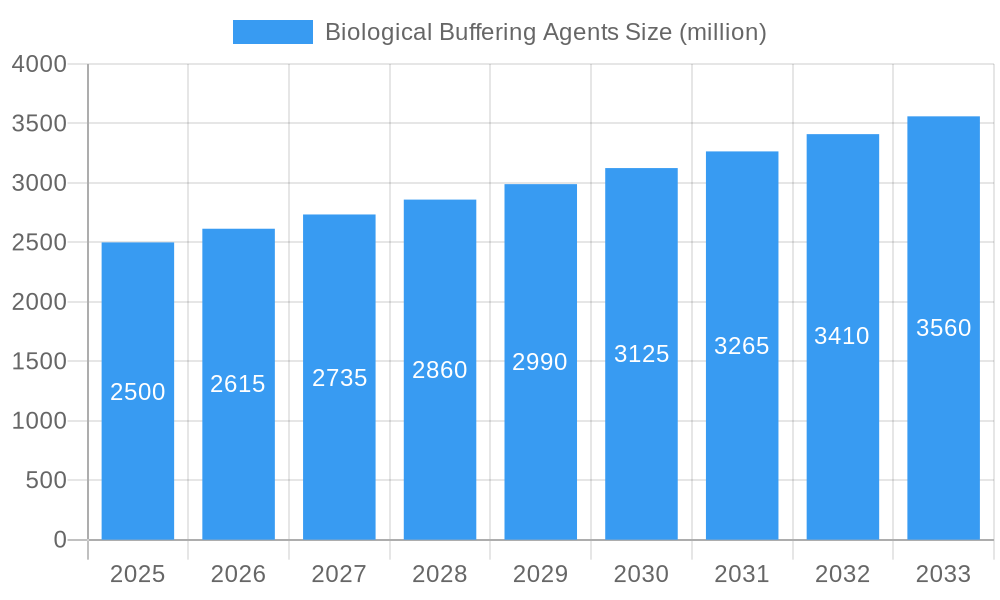
The global biological buffering agents market, valued at approximately $1.945 billion in 2019, is projected to experience robust growth, driven by the expanding biotechnology and pharmaceutical industries. A compound annual growth rate (CAGR) of 4.6% from 2019 to 2024 suggests a market size exceeding $2.4 billion in 2024. This growth is fueled by increasing demand for biological buffers in various applications, including cell culture, protein purification, and drug formulation. The rising prevalence of chronic diseases and the consequent surge in biopharmaceutical development significantly contribute to market expansion. Technological advancements leading to the development of novel buffering agents with improved performance characteristics, such as enhanced stability and biocompatibility, are also key drivers. Furthermore, the increasing adoption of sophisticated analytical techniques for precise buffer selection and optimization further fuels market growth. Competition among major players like Thermo Fisher Scientific, Avantor, and Bio-Rad Laboratories is intense, driving innovation and potentially impacting pricing strategies.
Biological Buffering Agents Market Size (In Billion)
Looking forward to the forecast period (2025-2033), the market is anticipated to continue its upward trajectory, propelled by ongoing R&D efforts and the growing focus on personalized medicine. The market segmentation, while not explicitly detailed, likely includes various buffer types (e.g., phosphate, Tris, HEPES) and applications (e.g., research, therapeutic development). Regional variations in growth rates are probable, reflecting differences in healthcare infrastructure and research funding. Potential restraints could include the cost associated with advanced buffering agents and stringent regulatory requirements for biopharmaceutical applications. However, the long-term outlook for the biological buffering agents market remains positive, promising substantial market expansion over the next decade.
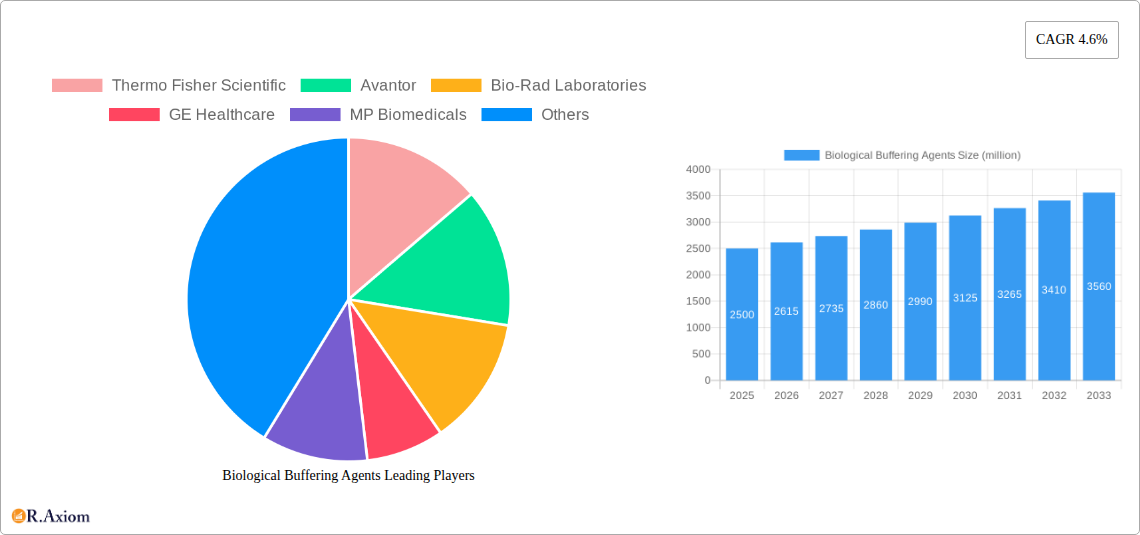
Biological Buffering Agents Company Market Share
Biological Buffering Agents Market Report: 2019-2033
This comprehensive report provides an in-depth analysis of the global Biological Buffering Agents market, offering valuable insights for stakeholders, including manufacturers, researchers, investors, and regulatory bodies. The report covers the period 2019-2033, with a focus on the estimated year 2025 and a forecast period of 2025-2033. The market size is projected in millions of USD.
Biological Buffering Agents Market Concentration & Innovation
The global biological buffering agents market exhibits a moderately consolidated structure, with key players like Thermo Fisher Scientific, Avantor, Bio-Rad Laboratories, and Merck Group holding significant market share. Precise market share data for each company is unavailable and requires further specific research. However, estimations suggest Thermo Fisher Scientific and Avantor collectively control approximately xx% of the market in 2025. This concentration is driven by economies of scale, strong distribution networks, and extensive R&D capabilities.
Innovation is a crucial driver, with companies investing heavily in developing novel buffering agents with improved performance characteristics, such as enhanced stability, broader pH ranges, and reduced toxicity. Regulatory frameworks, particularly those related to safety and efficacy, significantly impact market dynamics. The existence of substitute products, including chemical buffering agents, creates competitive pressure. End-user trends, particularly in the pharmaceutical and biotechnology sectors, influence demand for specific types of buffering agents. M&A activities have played a role in shaping the market landscape, with deal values exceeding $xx million in recent years, though specific transaction details are confidential or unavailable to the public. Further research is needed to determine the actual amount.
- Market Concentration: Moderately Consolidated (Thermo Fisher Scientific, Avantor, Bio-Rad Laboratories, Merck Group hold significant shares)
- Innovation Drivers: Improved performance, broader applications, reduced toxicity
- Regulatory Framework: Stringent safety and efficacy guidelines
- Product Substitutes: Chemical buffering agents
- End-User Trends: Growing demand from pharmaceutical and biotech industries
- M&A Activity: Deal values exceeding $xx million in recent years (exact figures unavailable)
Biological Buffering Agents Industry Trends & Insights
The global biological buffering agents market is experiencing robust growth, driven primarily by the expansion of the pharmaceutical and biotechnology industries. The increasing demand for biologics, biosimilars, and advanced therapeutic modalities is a key factor fueling market expansion. Technological advancements, such as the development of novel buffering agents with enhanced properties, further contribute to market growth. Consumer preferences are shifting towards more environmentally friendly and biocompatible buffering agents, impacting product development strategies. Competitive dynamics are characterized by intense rivalry among established players and the emergence of innovative start-ups. The market is expected to witness a CAGR of xx% during the forecast period (2025-2033), with a market penetration of xx% by 2033. These figures are estimates and require detailed market research to be precise.
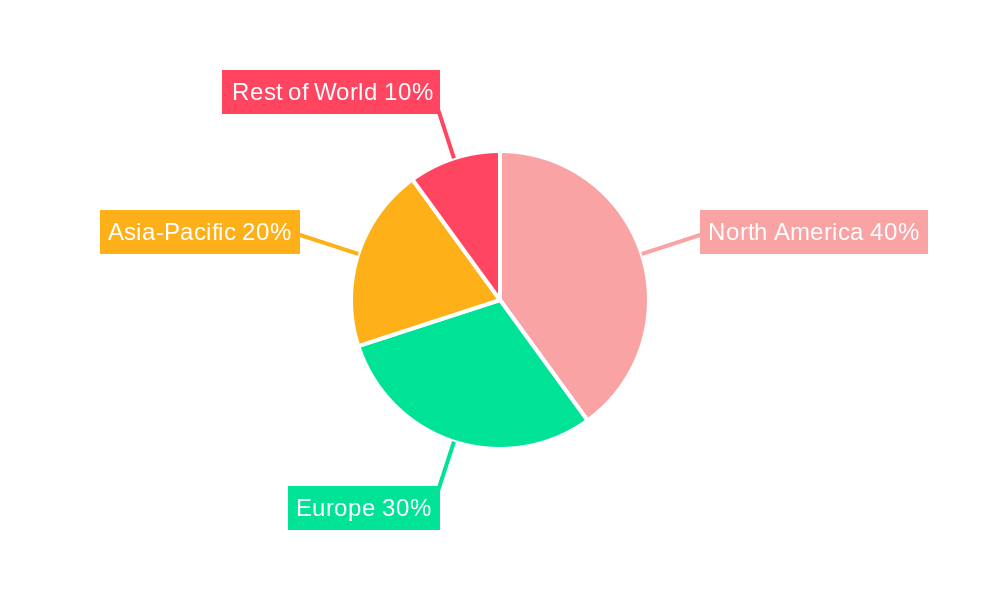
Dominant Markets & Segments in Biological Buffering Agents
The North American region currently dominates the global biological buffering agents market, driven by factors such as a strong pharmaceutical and biotechnology industry, significant R&D investments, and favorable regulatory frameworks. Within North America, the United States holds the largest market share.
- Key Drivers in North America:
- Strong pharmaceutical and biotechnology industry
- High R&D investment
- Favorable regulatory environment
- Well-established infrastructure
The dominance of North America stems from its advanced healthcare infrastructure, high disposable incomes, and robust regulatory support for pharmaceutical and biotechnology research. Europe and Asia-Pacific are also significant markets and are experiencing rapid growth, propelled by increasing healthcare spending and the rise of biopharmaceutical companies in these regions. However, precise market share data for each region requires specific data.
Biological Buffering Agents Product Developments
Recent years have witnessed significant advancements in biological buffering agents, with a focus on developing products with improved stability, enhanced biocompatibility, and broader pH ranges. These innovations cater to the growing demand for high-quality buffering agents in various applications, including biopharmaceutical manufacturing, diagnostics, and research. Technological trends such as the use of advanced materials and bio-based components are reshaping the product landscape.
Report Scope & Segmentation Analysis
The report provides a detailed segmentation analysis of the biological buffering agents market based on product type, application, and end-user. Each segment is analyzed in terms of market size, growth projections, and competitive dynamics. Specific details on individual segment sizes and growth projections are unavailable without extensive market research. Further analysis is required to finalize the data.
Key Drivers of Biological Buffering Agents Growth
The growth of the biological buffering agents market is driven by several key factors, including:
- The increasing demand for biologics and biosimilars.
- Advancements in biotechnology and pharmaceutical research.
- Stringent regulatory requirements for product quality and safety.
- Increasing healthcare spending globally.
These factors collectively contribute to the expansion of the market and drive demand for high-quality buffering agents.
Challenges in the Biological Buffering Agents Sector
The biological buffering agents sector faces certain challenges, including:
- Stringent regulatory hurdles related to the safety and efficacy of buffering agents.
- Supply chain disruptions impacting the availability of raw materials.
- Intense competition among established players and emerging companies. This competition impacts pricing and profit margins.
Addressing these challenges is crucial for sustainable growth in the sector.
Emerging Opportunities in Biological Buffering Agents
Several emerging opportunities exist in the biological buffering agents market, including:
- The growing demand for personalized medicine and targeted therapies.
- The increasing adoption of advanced drug delivery systems.
- The development of novel buffering agents with enhanced properties.
Leading Players in the Biological Buffering Agents Market
- Thermo Fisher Scientific
- Avantor
- Bio-Rad Laboratories
- GE Healthcare
- MP Biomedicals
- Santa Cruz Biotechnology
- Merck Group
- Cytiva
- Revvity
- Sartorius
- BioEcho Life Sciences
- anamed Elektrophorese
- Lonza Group
- FUJIFILM Wako Chemicals
- Takara Bio
- HiMedia Laboratories
Key Developments in Biological Buffering Agents Industry
- [Month, Year]: Company X launches a new buffering agent with improved stability. This launch significantly impacted the competitive landscape.
- [Month, Year]: Company Y acquires Company Z, expanding its product portfolio and market reach. The acquisition impacted market share.
- [Month, Year]: New regulatory guidelines are implemented, affecting the manufacturing and distribution of certain buffering agents. This impacted industry operations.
(Further details on specific key developments require accessing industry news and company announcements)
Strategic Outlook for Biological Buffering Agents Market
The biological buffering agents market is poised for sustained growth, driven by the continued expansion of the pharmaceutical and biotechnology industries, as well as ongoing technological advancements. Opportunities exist for companies to innovate and develop new buffering agents with enhanced properties to meet the evolving needs of various applications. Strategic partnerships, acquisitions, and investments in R&D will be crucial for companies to maintain a competitive edge in this dynamic market.
Biological Buffering Agents Segmentation
-
1. Application
- 1.1. Molecular Biology
- 1.2. Cell & Tissue Culture
- 1.3. Protein Chemistry
- 1.4. Medical Diagnostics
- 1.5. Pharmaceuticals
- 1.6. Others
-
2. Type
- 2.1. HEPES Buffers
- 2.2. MOPS Buffers
- 2.3. Tris Buffers
- 2.4. MES Buffers
- 2.5. PBS Buffers
Biological Buffering Agents Segmentation By Geography
-
1. North America
- 1.1. United States
- 1.2. Canada
- 1.3. Mexico
-
2. South America
- 2.1. Brazil
- 2.2. Argentina
- 2.3. Rest of South America
-
3. Europe
- 3.1. United Kingdom
- 3.2. Germany
- 3.3. France
- 3.4. Italy
- 3.5. Spain
- 3.6. Russia
- 3.7. Benelux
- 3.8. Nordics
- 3.9. Rest of Europe
-
4. Middle East & Africa
- 4.1. Turkey
- 4.2. Israel
- 4.3. GCC
- 4.4. North Africa
- 4.5. South Africa
- 4.6. Rest of Middle East & Africa
-
5. Asia Pacific
- 5.1. China
- 5.2. India
- 5.3. Japan
- 5.4. South Korea
- 5.5. ASEAN
- 5.6. Oceania
- 5.7. Rest of Asia Pacific
Biological Buffering Agents Regional Market Share
Geographic Coverage of Biological Buffering Agents
Biological Buffering Agents REPORT HIGHLIGHTS
| Aspects | Details |
|---|---|
| Study Period | 2020-2034 |
| Base Year | 2025 |
| Estimated Year | 2026 |
| Forecast Period | 2026-2034 |
| Historical Period | 2020-2025 |
| Growth Rate | CAGR of 4.6% from 2020-2034 |
| Segmentation |
|
Table of Contents
- 1. Introduction
- 1.1. Research Scope
- 1.2. Market Segmentation
- 1.3. Research Objective
- 1.4. Definitions and Assumptions
- 2. Executive Summary
- 2.1. Market Snapshot
- 3. Market Dynamics
- 3.1. Market Drivers
- 3.2. Market Restrains
- 3.3. Market Trends
- 3.4. Market Opportunities
- 4. Market Factor Analysis
- 4.1. Porters Five Forces
- 4.1.1. Bargaining Power of Suppliers
- 4.1.2. Bargaining Power of Buyers
- 4.1.3. Threat of New Entrants
- 4.1.4. Threat of Substitutes
- 4.1.5. Competitive Rivalry
- 4.2. PESTEL analysis
- 4.3. BCG Analysis
- 4.3.1. Stars (High Growth, High Market Share)
- 4.3.2. Cash Cows (Low Growth, High Market Share)
- 4.3.3. Question Mark (High Growth, Low Market Share)
- 4.3.4. Dogs (Low Growth, Low Market Share)
- 4.4. Ansoff Matrix Analysis
- 4.5. Supply Chain Analysis
- 4.6. Regulatory Landscape
- 4.7. Current Market Potential and Opportunity Assessment (TAM–SAM–SOM Framework)
- 4.8. RAX Analyst Note
- 4.1. Porters Five Forces
- 5. Market Analysis, Insights and Forecast 2021-2033
- 5.1. Market Analysis, Insights and Forecast - by Application
- 5.1.1. Molecular Biology
- 5.1.2. Cell & Tissue Culture
- 5.1.3. Protein Chemistry
- 5.1.4. Medical Diagnostics
- 5.1.5. Pharmaceuticals
- 5.1.6. Others
- 5.2. Market Analysis, Insights and Forecast - by Type
- 5.2.1. HEPES Buffers
- 5.2.2. MOPS Buffers
- 5.2.3. Tris Buffers
- 5.2.4. MES Buffers
- 5.2.5. PBS Buffers
- 5.3. Market Analysis, Insights and Forecast - by Region
- 5.3.1. North America
- 5.3.2. South America
- 5.3.3. Europe
- 5.3.4. Middle East & Africa
- 5.3.5. Asia Pacific
- 5.1. Market Analysis, Insights and Forecast - by Application
- 6. Global Biological Buffering Agents Analysis, Insights and Forecast, 2021-2033
- 6.1. Market Analysis, Insights and Forecast - by Application
- 6.1.1. Molecular Biology
- 6.1.2. Cell & Tissue Culture
- 6.1.3. Protein Chemistry
- 6.1.4. Medical Diagnostics
- 6.1.5. Pharmaceuticals
- 6.1.6. Others
- 6.2. Market Analysis, Insights and Forecast - by Type
- 6.2.1. HEPES Buffers
- 6.2.2. MOPS Buffers
- 6.2.3. Tris Buffers
- 6.2.4. MES Buffers
- 6.2.5. PBS Buffers
- 6.1. Market Analysis, Insights and Forecast - by Application
- 7. North America Biological Buffering Agents Analysis, Insights and Forecast, 2020-2032
- 7.1. Market Analysis, Insights and Forecast - by Application
- 7.1.1. Molecular Biology
- 7.1.2. Cell & Tissue Culture
- 7.1.3. Protein Chemistry
- 7.1.4. Medical Diagnostics
- 7.1.5. Pharmaceuticals
- 7.1.6. Others
- 7.2. Market Analysis, Insights and Forecast - by Type
- 7.2.1. HEPES Buffers
- 7.2.2. MOPS Buffers
- 7.2.3. Tris Buffers
- 7.2.4. MES Buffers
- 7.2.5. PBS Buffers
- 7.1. Market Analysis, Insights and Forecast - by Application
- 8. South America Biological Buffering Agents Analysis, Insights and Forecast, 2020-2032
- 8.1. Market Analysis, Insights and Forecast - by Application
- 8.1.1. Molecular Biology
- 8.1.2. Cell & Tissue Culture
- 8.1.3. Protein Chemistry
- 8.1.4. Medical Diagnostics
- 8.1.5. Pharmaceuticals
- 8.1.6. Others
- 8.2. Market Analysis, Insights and Forecast - by Type
- 8.2.1. HEPES Buffers
- 8.2.2. MOPS Buffers
- 8.2.3. Tris Buffers
- 8.2.4. MES Buffers
- 8.2.5. PBS Buffers
- 8.1. Market Analysis, Insights and Forecast - by Application
- 9. Europe Biological Buffering Agents Analysis, Insights and Forecast, 2020-2032
- 9.1. Market Analysis, Insights and Forecast - by Application
- 9.1.1. Molecular Biology
- 9.1.2. Cell & Tissue Culture
- 9.1.3. Protein Chemistry
- 9.1.4. Medical Diagnostics
- 9.1.5. Pharmaceuticals
- 9.1.6. Others
- 9.2. Market Analysis, Insights and Forecast - by Type
- 9.2.1. HEPES Buffers
- 9.2.2. MOPS Buffers
- 9.2.3. Tris Buffers
- 9.2.4. MES Buffers
- 9.2.5. PBS Buffers
- 9.1. Market Analysis, Insights and Forecast - by Application
- 10. Middle East & Africa Biological Buffering Agents Analysis, Insights and Forecast, 2020-2032
- 10.1. Market Analysis, Insights and Forecast - by Application
- 10.1.1. Molecular Biology
- 10.1.2. Cell & Tissue Culture
- 10.1.3. Protein Chemistry
- 10.1.4. Medical Diagnostics
- 10.1.5. Pharmaceuticals
- 10.1.6. Others
- 10.2. Market Analysis, Insights and Forecast - by Type
- 10.2.1. HEPES Buffers
- 10.2.2. MOPS Buffers
- 10.2.3. Tris Buffers
- 10.2.4. MES Buffers
- 10.2.5. PBS Buffers
- 10.1. Market Analysis, Insights and Forecast - by Application
- 11. Asia Pacific Biological Buffering Agents Analysis, Insights and Forecast, 2020-2032
- 11.1. Market Analysis, Insights and Forecast - by Application
- 11.1.1. Molecular Biology
- 11.1.2. Cell & Tissue Culture
- 11.1.3. Protein Chemistry
- 11.1.4. Medical Diagnostics
- 11.1.5. Pharmaceuticals
- 11.1.6. Others
- 11.2. Market Analysis, Insights and Forecast - by Type
- 11.2.1. HEPES Buffers
- 11.2.2. MOPS Buffers
- 11.2.3. Tris Buffers
- 11.2.4. MES Buffers
- 11.2.5. PBS Buffers
- 11.1. Market Analysis, Insights and Forecast - by Application
- 12. Competitive Analysis
- 12.1. Company Profiles
- 12.1.1 Thermo Fisher Scientific
- 12.1.1.1. Company Overview
- 12.1.1.2. Products
- 12.1.1.3. Company Financials
- 12.1.1.4. SWOT Analysis
- 12.1.2 Avantor
- 12.1.2.1. Company Overview
- 12.1.2.2. Products
- 12.1.2.3. Company Financials
- 12.1.2.4. SWOT Analysis
- 12.1.3 Bio-Rad Laboratories
- 12.1.3.1. Company Overview
- 12.1.3.2. Products
- 12.1.3.3. Company Financials
- 12.1.3.4. SWOT Analysis
- 12.1.4 GE Healthcare
- 12.1.4.1. Company Overview
- 12.1.4.2. Products
- 12.1.4.3. Company Financials
- 12.1.4.4. SWOT Analysis
- 12.1.5 MP Biomedicals
- 12.1.5.1. Company Overview
- 12.1.5.2. Products
- 12.1.5.3. Company Financials
- 12.1.5.4. SWOT Analysis
- 12.1.6 Santa Cruz Biotechnology
- 12.1.6.1. Company Overview
- 12.1.6.2. Products
- 12.1.6.3. Company Financials
- 12.1.6.4. SWOT Analysis
- 12.1.7 Merck Group
- 12.1.7.1. Company Overview
- 12.1.7.2. Products
- 12.1.7.3. Company Financials
- 12.1.7.4. SWOT Analysis
- 12.1.8 Cytiva
- 12.1.8.1. Company Overview
- 12.1.8.2. Products
- 12.1.8.3. Company Financials
- 12.1.8.4. SWOT Analysis
- 12.1.9 Revvity
- 12.1.9.1. Company Overview
- 12.1.9.2. Products
- 12.1.9.3. Company Financials
- 12.1.9.4. SWOT Analysis
- 12.1.10 Sartorius
- 12.1.10.1. Company Overview
- 12.1.10.2. Products
- 12.1.10.3. Company Financials
- 12.1.10.4. SWOT Analysis
- 12.1.11 BioEcho Life Sciences
- 12.1.11.1. Company Overview
- 12.1.11.2. Products
- 12.1.11.3. Company Financials
- 12.1.11.4. SWOT Analysis
- 12.1.12 anamed Elektrophorese
- 12.1.12.1. Company Overview
- 12.1.12.2. Products
- 12.1.12.3. Company Financials
- 12.1.12.4. SWOT Analysis
- 12.1.13 Lonza Group
- 12.1.13.1. Company Overview
- 12.1.13.2. Products
- 12.1.13.3. Company Financials
- 12.1.13.4. SWOT Analysis
- 12.1.14 FUJIFILM Wako Chemicals
- 12.1.14.1. Company Overview
- 12.1.14.2. Products
- 12.1.14.3. Company Financials
- 12.1.14.4. SWOT Analysis
- 12.1.15 Takara Bio
- 12.1.15.1. Company Overview
- 12.1.15.2. Products
- 12.1.15.3. Company Financials
- 12.1.15.4. SWOT Analysis
- 12.1.16 HiMedia Laboratories
- 12.1.16.1. Company Overview
- 12.1.16.2. Products
- 12.1.16.3. Company Financials
- 12.1.16.4. SWOT Analysis
- 12.1.1 Thermo Fisher Scientific
- 12.2. Market Entropy
- 12.2.1 Company's Key Areas Served
- 12.2.2 Recent Developments
- 12.3. Company Market Share Analysis 2025
- 12.3.1 Top 5 Companies Market Share Analysis
- 12.3.2 Top 3 Companies Market Share Analysis
- 12.4. List of Potential Customers
- 13. Research Methodology
List of Figures
- Figure 1: Global Biological Buffering Agents Revenue Breakdown (million, %) by Region 2025 & 2033
- Figure 2: Global Biological Buffering Agents Volume Breakdown (K, %) by Region 2025 & 2033
- Figure 3: North America Biological Buffering Agents Revenue (million), by Application 2025 & 2033
- Figure 4: North America Biological Buffering Agents Volume (K), by Application 2025 & 2033
- Figure 5: North America Biological Buffering Agents Revenue Share (%), by Application 2025 & 2033
- Figure 6: North America Biological Buffering Agents Volume Share (%), by Application 2025 & 2033
- Figure 7: North America Biological Buffering Agents Revenue (million), by Type 2025 & 2033
- Figure 8: North America Biological Buffering Agents Volume (K), by Type 2025 & 2033
- Figure 9: North America Biological Buffering Agents Revenue Share (%), by Type 2025 & 2033
- Figure 10: North America Biological Buffering Agents Volume Share (%), by Type 2025 & 2033
- Figure 11: North America Biological Buffering Agents Revenue (million), by Country 2025 & 2033
- Figure 12: North America Biological Buffering Agents Volume (K), by Country 2025 & 2033
- Figure 13: North America Biological Buffering Agents Revenue Share (%), by Country 2025 & 2033
- Figure 14: North America Biological Buffering Agents Volume Share (%), by Country 2025 & 2033
- Figure 15: South America Biological Buffering Agents Revenue (million), by Application 2025 & 2033
- Figure 16: South America Biological Buffering Agents Volume (K), by Application 2025 & 2033
- Figure 17: South America Biological Buffering Agents Revenue Share (%), by Application 2025 & 2033
- Figure 18: South America Biological Buffering Agents Volume Share (%), by Application 2025 & 2033
- Figure 19: South America Biological Buffering Agents Revenue (million), by Type 2025 & 2033
- Figure 20: South America Biological Buffering Agents Volume (K), by Type 2025 & 2033
- Figure 21: South America Biological Buffering Agents Revenue Share (%), by Type 2025 & 2033
- Figure 22: South America Biological Buffering Agents Volume Share (%), by Type 2025 & 2033
- Figure 23: South America Biological Buffering Agents Revenue (million), by Country 2025 & 2033
- Figure 24: South America Biological Buffering Agents Volume (K), by Country 2025 & 2033
- Figure 25: South America Biological Buffering Agents Revenue Share (%), by Country 2025 & 2033
- Figure 26: South America Biological Buffering Agents Volume Share (%), by Country 2025 & 2033
- Figure 27: Europe Biological Buffering Agents Revenue (million), by Application 2025 & 2033
- Figure 28: Europe Biological Buffering Agents Volume (K), by Application 2025 & 2033
- Figure 29: Europe Biological Buffering Agents Revenue Share (%), by Application 2025 & 2033
- Figure 30: Europe Biological Buffering Agents Volume Share (%), by Application 2025 & 2033
- Figure 31: Europe Biological Buffering Agents Revenue (million), by Type 2025 & 2033
- Figure 32: Europe Biological Buffering Agents Volume (K), by Type 2025 & 2033
- Figure 33: Europe Biological Buffering Agents Revenue Share (%), by Type 2025 & 2033
- Figure 34: Europe Biological Buffering Agents Volume Share (%), by Type 2025 & 2033
- Figure 35: Europe Biological Buffering Agents Revenue (million), by Country 2025 & 2033
- Figure 36: Europe Biological Buffering Agents Volume (K), by Country 2025 & 2033
- Figure 37: Europe Biological Buffering Agents Revenue Share (%), by Country 2025 & 2033
- Figure 38: Europe Biological Buffering Agents Volume Share (%), by Country 2025 & 2033
- Figure 39: Middle East & Africa Biological Buffering Agents Revenue (million), by Application 2025 & 2033
- Figure 40: Middle East & Africa Biological Buffering Agents Volume (K), by Application 2025 & 2033
- Figure 41: Middle East & Africa Biological Buffering Agents Revenue Share (%), by Application 2025 & 2033
- Figure 42: Middle East & Africa Biological Buffering Agents Volume Share (%), by Application 2025 & 2033
- Figure 43: Middle East & Africa Biological Buffering Agents Revenue (million), by Type 2025 & 2033
- Figure 44: Middle East & Africa Biological Buffering Agents Volume (K), by Type 2025 & 2033
- Figure 45: Middle East & Africa Biological Buffering Agents Revenue Share (%), by Type 2025 & 2033
- Figure 46: Middle East & Africa Biological Buffering Agents Volume Share (%), by Type 2025 & 2033
- Figure 47: Middle East & Africa Biological Buffering Agents Revenue (million), by Country 2025 & 2033
- Figure 48: Middle East & Africa Biological Buffering Agents Volume (K), by Country 2025 & 2033
- Figure 49: Middle East & Africa Biological Buffering Agents Revenue Share (%), by Country 2025 & 2033
- Figure 50: Middle East & Africa Biological Buffering Agents Volume Share (%), by Country 2025 & 2033
- Figure 51: Asia Pacific Biological Buffering Agents Revenue (million), by Application 2025 & 2033
- Figure 52: Asia Pacific Biological Buffering Agents Volume (K), by Application 2025 & 2033
- Figure 53: Asia Pacific Biological Buffering Agents Revenue Share (%), by Application 2025 & 2033
- Figure 54: Asia Pacific Biological Buffering Agents Volume Share (%), by Application 2025 & 2033
- Figure 55: Asia Pacific Biological Buffering Agents Revenue (million), by Type 2025 & 2033
- Figure 56: Asia Pacific Biological Buffering Agents Volume (K), by Type 2025 & 2033
- Figure 57: Asia Pacific Biological Buffering Agents Revenue Share (%), by Type 2025 & 2033
- Figure 58: Asia Pacific Biological Buffering Agents Volume Share (%), by Type 2025 & 2033
- Figure 59: Asia Pacific Biological Buffering Agents Revenue (million), by Country 2025 & 2033
- Figure 60: Asia Pacific Biological Buffering Agents Volume (K), by Country 2025 & 2033
- Figure 61: Asia Pacific Biological Buffering Agents Revenue Share (%), by Country 2025 & 2033
- Figure 62: Asia Pacific Biological Buffering Agents Volume Share (%), by Country 2025 & 2033
List of Tables
- Table 1: Global Biological Buffering Agents Revenue million Forecast, by Application 2020 & 2033
- Table 2: Global Biological Buffering Agents Volume K Forecast, by Application 2020 & 2033
- Table 3: Global Biological Buffering Agents Revenue million Forecast, by Type 2020 & 2033
- Table 4: Global Biological Buffering Agents Volume K Forecast, by Type 2020 & 2033
- Table 5: Global Biological Buffering Agents Revenue million Forecast, by Region 2020 & 2033
- Table 6: Global Biological Buffering Agents Volume K Forecast, by Region 2020 & 2033
- Table 7: Global Biological Buffering Agents Revenue million Forecast, by Application 2020 & 2033
- Table 8: Global Biological Buffering Agents Volume K Forecast, by Application 2020 & 2033
- Table 9: Global Biological Buffering Agents Revenue million Forecast, by Type 2020 & 2033
- Table 10: Global Biological Buffering Agents Volume K Forecast, by Type 2020 & 2033
- Table 11: Global Biological Buffering Agents Revenue million Forecast, by Country 2020 & 2033
- Table 12: Global Biological Buffering Agents Volume K Forecast, by Country 2020 & 2033
- Table 13: United States Biological Buffering Agents Revenue (million) Forecast, by Application 2020 & 2033
- Table 14: United States Biological Buffering Agents Volume (K) Forecast, by Application 2020 & 2033
- Table 15: Canada Biological Buffering Agents Revenue (million) Forecast, by Application 2020 & 2033
- Table 16: Canada Biological Buffering Agents Volume (K) Forecast, by Application 2020 & 2033
- Table 17: Mexico Biological Buffering Agents Revenue (million) Forecast, by Application 2020 & 2033
- Table 18: Mexico Biological Buffering Agents Volume (K) Forecast, by Application 2020 & 2033
- Table 19: Global Biological Buffering Agents Revenue million Forecast, by Application 2020 & 2033
- Table 20: Global Biological Buffering Agents Volume K Forecast, by Application 2020 & 2033
- Table 21: Global Biological Buffering Agents Revenue million Forecast, by Type 2020 & 2033
- Table 22: Global Biological Buffering Agents Volume K Forecast, by Type 2020 & 2033
- Table 23: Global Biological Buffering Agents Revenue million Forecast, by Country 2020 & 2033
- Table 24: Global Biological Buffering Agents Volume K Forecast, by Country 2020 & 2033
- Table 25: Brazil Biological Buffering Agents Revenue (million) Forecast, by Application 2020 & 2033
- Table 26: Brazil Biological Buffering Agents Volume (K) Forecast, by Application 2020 & 2033
- Table 27: Argentina Biological Buffering Agents Revenue (million) Forecast, by Application 2020 & 2033
- Table 28: Argentina Biological Buffering Agents Volume (K) Forecast, by Application 2020 & 2033
- Table 29: Rest of South America Biological Buffering Agents Revenue (million) Forecast, by Application 2020 & 2033
- Table 30: Rest of South America Biological Buffering Agents Volume (K) Forecast, by Application 2020 & 2033
- Table 31: Global Biological Buffering Agents Revenue million Forecast, by Application 2020 & 2033
- Table 32: Global Biological Buffering Agents Volume K Forecast, by Application 2020 & 2033
- Table 33: Global Biological Buffering Agents Revenue million Forecast, by Type 2020 & 2033
- Table 34: Global Biological Buffering Agents Volume K Forecast, by Type 2020 & 2033
- Table 35: Global Biological Buffering Agents Revenue million Forecast, by Country 2020 & 2033
- Table 36: Global Biological Buffering Agents Volume K Forecast, by Country 2020 & 2033
- Table 37: United Kingdom Biological Buffering Agents Revenue (million) Forecast, by Application 2020 & 2033
- Table 38: United Kingdom Biological Buffering Agents Volume (K) Forecast, by Application 2020 & 2033
- Table 39: Germany Biological Buffering Agents Revenue (million) Forecast, by Application 2020 & 2033
- Table 40: Germany Biological Buffering Agents Volume (K) Forecast, by Application 2020 & 2033
- Table 41: France Biological Buffering Agents Revenue (million) Forecast, by Application 2020 & 2033
- Table 42: France Biological Buffering Agents Volume (K) Forecast, by Application 2020 & 2033
- Table 43: Italy Biological Buffering Agents Revenue (million) Forecast, by Application 2020 & 2033
- Table 44: Italy Biological Buffering Agents Volume (K) Forecast, by Application 2020 & 2033
- Table 45: Spain Biological Buffering Agents Revenue (million) Forecast, by Application 2020 & 2033
- Table 46: Spain Biological Buffering Agents Volume (K) Forecast, by Application 2020 & 2033
- Table 47: Russia Biological Buffering Agents Revenue (million) Forecast, by Application 2020 & 2033
- Table 48: Russia Biological Buffering Agents Volume (K) Forecast, by Application 2020 & 2033
- Table 49: Benelux Biological Buffering Agents Revenue (million) Forecast, by Application 2020 & 2033
- Table 50: Benelux Biological Buffering Agents Volume (K) Forecast, by Application 2020 & 2033
- Table 51: Nordics Biological Buffering Agents Revenue (million) Forecast, by Application 2020 & 2033
- Table 52: Nordics Biological Buffering Agents Volume (K) Forecast, by Application 2020 & 2033
- Table 53: Rest of Europe Biological Buffering Agents Revenue (million) Forecast, by Application 2020 & 2033
- Table 54: Rest of Europe Biological Buffering Agents Volume (K) Forecast, by Application 2020 & 2033
- Table 55: Global Biological Buffering Agents Revenue million Forecast, by Application 2020 & 2033
- Table 56: Global Biological Buffering Agents Volume K Forecast, by Application 2020 & 2033
- Table 57: Global Biological Buffering Agents Revenue million Forecast, by Type 2020 & 2033
- Table 58: Global Biological Buffering Agents Volume K Forecast, by Type 2020 & 2033
- Table 59: Global Biological Buffering Agents Revenue million Forecast, by Country 2020 & 2033
- Table 60: Global Biological Buffering Agents Volume K Forecast, by Country 2020 & 2033
- Table 61: Turkey Biological Buffering Agents Revenue (million) Forecast, by Application 2020 & 2033
- Table 62: Turkey Biological Buffering Agents Volume (K) Forecast, by Application 2020 & 2033
- Table 63: Israel Biological Buffering Agents Revenue (million) Forecast, by Application 2020 & 2033
- Table 64: Israel Biological Buffering Agents Volume (K) Forecast, by Application 2020 & 2033
- Table 65: GCC Biological Buffering Agents Revenue (million) Forecast, by Application 2020 & 2033
- Table 66: GCC Biological Buffering Agents Volume (K) Forecast, by Application 2020 & 2033
- Table 67: North Africa Biological Buffering Agents Revenue (million) Forecast, by Application 2020 & 2033
- Table 68: North Africa Biological Buffering Agents Volume (K) Forecast, by Application 2020 & 2033
- Table 69: South Africa Biological Buffering Agents Revenue (million) Forecast, by Application 2020 & 2033
- Table 70: South Africa Biological Buffering Agents Volume (K) Forecast, by Application 2020 & 2033
- Table 71: Rest of Middle East & Africa Biological Buffering Agents Revenue (million) Forecast, by Application 2020 & 2033
- Table 72: Rest of Middle East & Africa Biological Buffering Agents Volume (K) Forecast, by Application 2020 & 2033
- Table 73: Global Biological Buffering Agents Revenue million Forecast, by Application 2020 & 2033
- Table 74: Global Biological Buffering Agents Volume K Forecast, by Application 2020 & 2033
- Table 75: Global Biological Buffering Agents Revenue million Forecast, by Type 2020 & 2033
- Table 76: Global Biological Buffering Agents Volume K Forecast, by Type 2020 & 2033
- Table 77: Global Biological Buffering Agents Revenue million Forecast, by Country 2020 & 2033
- Table 78: Global Biological Buffering Agents Volume K Forecast, by Country 2020 & 2033
- Table 79: China Biological Buffering Agents Revenue (million) Forecast, by Application 2020 & 2033
- Table 80: China Biological Buffering Agents Volume (K) Forecast, by Application 2020 & 2033
- Table 81: India Biological Buffering Agents Revenue (million) Forecast, by Application 2020 & 2033
- Table 82: India Biological Buffering Agents Volume (K) Forecast, by Application 2020 & 2033
- Table 83: Japan Biological Buffering Agents Revenue (million) Forecast, by Application 2020 & 2033
- Table 84: Japan Biological Buffering Agents Volume (K) Forecast, by Application 2020 & 2033
- Table 85: South Korea Biological Buffering Agents Revenue (million) Forecast, by Application 2020 & 2033
- Table 86: South Korea Biological Buffering Agents Volume (K) Forecast, by Application 2020 & 2033
- Table 87: ASEAN Biological Buffering Agents Revenue (million) Forecast, by Application 2020 & 2033
- Table 88: ASEAN Biological Buffering Agents Volume (K) Forecast, by Application 2020 & 2033
- Table 89: Oceania Biological Buffering Agents Revenue (million) Forecast, by Application 2020 & 2033
- Table 90: Oceania Biological Buffering Agents Volume (K) Forecast, by Application 2020 & 2033
- Table 91: Rest of Asia Pacific Biological Buffering Agents Revenue (million) Forecast, by Application 2020 & 2033
- Table 92: Rest of Asia Pacific Biological Buffering Agents Volume (K) Forecast, by Application 2020 & 2033
Frequently Asked Questions
1. What is the projected Compound Annual Growth Rate (CAGR) of the Biological Buffering Agents?
The projected CAGR is approximately 4.6%.
2. Which companies are prominent players in the Biological Buffering Agents?
Key companies in the market include Thermo Fisher Scientific, Avantor, Bio-Rad Laboratories, GE Healthcare, MP Biomedicals, Santa Cruz Biotechnology, Merck Group, Cytiva, Revvity, Sartorius, BioEcho Life Sciences, anamed Elektrophorese, Lonza Group, FUJIFILM Wako Chemicals, Takara Bio, HiMedia Laboratories.
3. What are the main segments of the Biological Buffering Agents?
The market segments include Application, Type.
4. Can you provide details about the market size?
The market size is estimated to be USD 1945 million as of 2022.
5. What are some drivers contributing to market growth?
N/A
6. What are the notable trends driving market growth?
N/A
7. Are there any restraints impacting market growth?
N/A
8. Can you provide examples of recent developments in the market?
N/A
9. What pricing options are available for accessing the report?
Pricing options include single-user, multi-user, and enterprise licenses priced at USD 3950.00, USD 5925.00, and USD 7900.00 respectively.
10. Is the market size provided in terms of value or volume?
The market size is provided in terms of value, measured in million and volume, measured in K.
11. Are there any specific market keywords associated with the report?
Yes, the market keyword associated with the report is "Biological Buffering Agents," which aids in identifying and referencing the specific market segment covered.
12. How do I determine which pricing option suits my needs best?
The pricing options vary based on user requirements and access needs. Individual users may opt for single-user licenses, while businesses requiring broader access may choose multi-user or enterprise licenses for cost-effective access to the report.
13. Are there any additional resources or data provided in the Biological Buffering Agents report?
While the report offers comprehensive insights, it's advisable to review the specific contents or supplementary materials provided to ascertain if additional resources or data are available.
14. How can I stay updated on further developments or reports in the Biological Buffering Agents?
To stay informed about further developments, trends, and reports in the Biological Buffering Agents, consider subscribing to industry newsletters, following relevant companies and organizations, or regularly checking reputable industry news sources and publications.
Methodology
Step 1 - Identification of Relevant Samples Size from Population Database


Step 2 - Approaches for Defining Global Market Size (Value, Volume* & Price*)

Note*: In applicable scenarios
Step 3 - Data Sources
Primary Research
- Web Analytics
- Survey Reports
- Research Institute
- Latest Research Reports
- Opinion Leaders
Secondary Research
- Annual Reports
- White Paper
- Latest Press Release
- Industry Association
- Paid Database
- Investor Presentations

Step 4 - Data Triangulation
Involves using different sources of information in order to increase the validity of a study
These sources are likely to be stakeholders in a program - participants, other researchers, program staff, other community members, and so on.
Then we put all data in single framework & apply various statistical tools to find out the dynamic on the market.
During the analysis stage, feedback from the stakeholder groups would be compared to determine areas of agreement as well as areas of divergence