

Key Insights
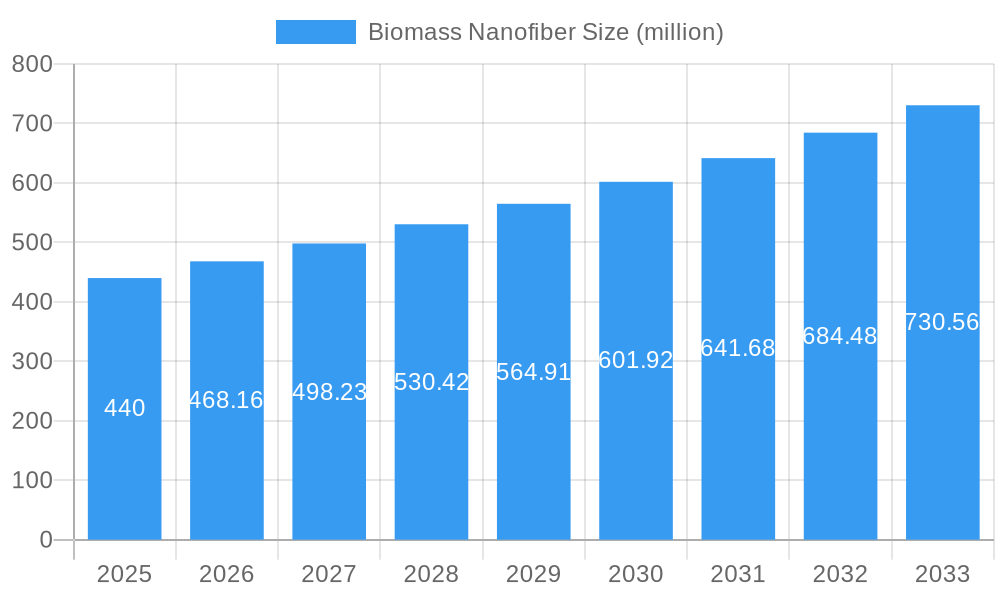
The biomass nanofiber market, currently valued at $440 million in 2025, is projected to experience robust growth, driven by the increasing demand for sustainable and eco-friendly materials across various sectors. A compound annual growth rate (CAGR) of 6.4% from 2025 to 2033 indicates a significant expansion in market size over the forecast period. This growth is fueled by several key factors. The rising awareness of environmental concerns and the urgent need to reduce reliance on petroleum-based materials are major drivers. Furthermore, the unique properties of biomass nanofibers, including high strength, lightweight nature, and biodegradability, make them attractive alternatives in applications ranging from composites and packaging to biomedical devices and filtration systems. Technological advancements in nanofiber production and processing are further contributing to market expansion, making the material more cost-effective and accessible. While challenges remain, such as scalability and standardization of production processes, the overall market outlook is positive, with substantial opportunities for growth across various regions and applications.
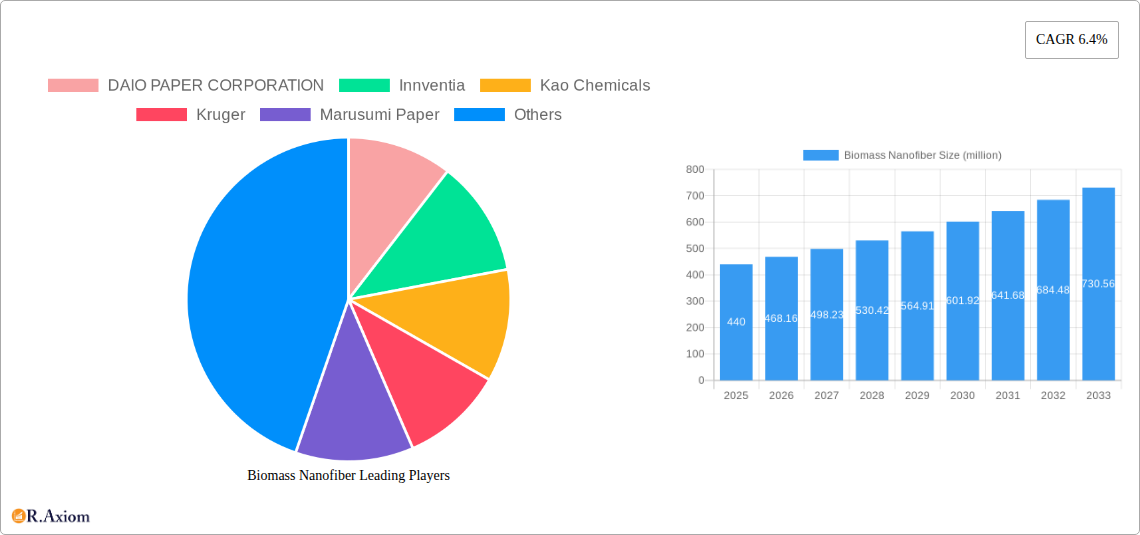
Biomass Nanofiber Market Size (In Million)
The competitive landscape is marked by a blend of established players and emerging companies. Key players like Daio Paper Corporation, Innventia, Kao Chemicals, Kruger, and Nippon Paper Group are actively involved in research and development, as well as commercialization efforts, driving innovation and competition within the sector. The market is segmented by various factors including fiber type (cellulose, lignin, etc.), application (composites, biomedical, etc.), and region. Although specific segmental data is unavailable, it's likely that the growth will be distributed across these segments, with some potentially exhibiting faster growth than others due to their specific applications and market needs. Regional differences in adoption rates and regulatory environments will also shape the growth trajectory across North America, Europe, Asia-Pacific, and other regions. The forecast period of 2025-2033 presents significant opportunities for companies to capitalize on this growing market by focusing on innovation, cost reduction, and strategic partnerships.
Biomass Nanofiber Company Market Share
Biomass Nanofiber Market Report: 2019-2033
This comprehensive report provides an in-depth analysis of the global biomass nanofiber market, offering crucial insights for stakeholders, investors, and industry professionals. The study covers the historical period (2019-2024), base year (2025), and forecast period (2025-2033), projecting market trends and growth opportunities across various segments. The report's detailed analysis, encompassing market size, concentration, innovation, key players, and future prospects, makes it an indispensable resource for navigating this rapidly evolving market. The report value is predicted to be in millions.
Biomass Nanofiber Market Concentration & Innovation
This section analyzes the competitive landscape of the biomass nanofiber market, examining market concentration, innovation drivers, regulatory influences, and key industry activities. The study period (2019-2024) reveals a moderately concentrated market, with a few major players holding significant market share. The estimated market share for the top five players in 2025 is predicted to be xx%. Innovation is driven by advancements in nanocellulose production techniques, leading to improved material properties and expanded applications. Stringent environmental regulations are pushing the adoption of sustainable materials, fostering innovation within the sector. Significant M&A activities, with a total deal value of approximately $xx million in the last five years, are reshaping the market landscape.
- Market Concentration: Top 5 players hold xx% market share in 2025.
- Innovation Drivers: Advancements in nanocellulose production, demand for sustainable materials.
- Regulatory Framework: Stringent environmental regulations are driving adoption.
- Product Substitutes: Competition from synthetic nanofibers and other materials.
- End-User Trends: Growing demand from packaging, construction, and automotive industries.
- M&A Activities: Total deal value of approximately $xx million (2019-2024).
Biomass Nanofiber Industry Trends & Insights
The global biomass nanofiber market is experiencing robust growth, driven by the increasing demand for sustainable and high-performance materials. The compound annual growth rate (CAGR) from 2025 to 2033 is projected to be xx%, with market penetration reaching xx% by 2033. Technological advancements, such as improved production methods and functionalization techniques, are further fueling market expansion. Consumer preferences are shifting towards eco-friendly products, contributing significantly to the market's growth. Competitive dynamics are shaped by ongoing innovations, strategic partnerships, and the expansion of applications across diverse industries. Significant price reductions in production costs will contribute to the increasing demand in the forecast period.
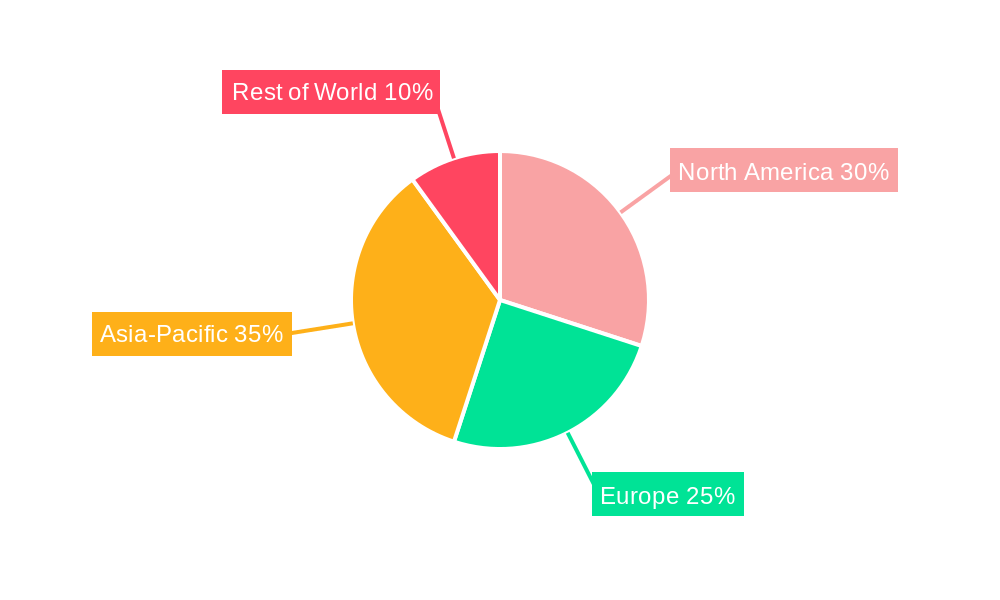
Dominant Markets & Segments in Biomass Nanofiber
Asia-Pacific dominates the biomass nanofiber market, driven by strong economic growth, rapid industrialization, and favorable government policies promoting the use of sustainable materials. China and Japan are leading contributors to this regional dominance.
- Key Drivers in Asia-Pacific:
- Rapid industrialization and economic growth.
- Government support for sustainable materials.
- Significant investments in research and development.
- Growing demand from various end-use sectors.
The dominance of Asia-Pacific stems from a confluence of factors, including massive production capacities, strong demand from diverse sectors (packaging, construction, automotive), and supportive government initiatives fostering innovation and sustainable development. Other regions, including North America and Europe, are expected to witness considerable growth, albeit at a slower pace compared to Asia-Pacific.
Biomass Nanofiber Product Developments
Recent innovations focus on enhancing the properties of biomass nanofibers, such as improved strength, flexibility, and biodegradability. New applications are continuously emerging in various sectors, including advanced composites, biomedicine, and filtration. The market is witnessing a shift towards high-performance, functionalized nanofibers that cater to specific application needs. This drives differentiation and creates competitive advantages for companies leading in material science and production efficiency.
Report Scope & Segmentation Analysis
This report provides a comprehensive segmentation analysis of the biomass nanofiber market, encompassing various aspects: by type (cellulose nanofibers, lignin nanofibers, chitin nanofibers, others), by application (packaging, construction, automotive, biomedical, others), and by region (Asia-Pacific, North America, Europe, Rest of the World). Each segment's growth projection, market size, and competitive dynamics are thoroughly analyzed. The market is witnessing varied growth rates across segments, shaped by factors like demand from specific end-use industries, availability of raw materials, and technological advancements.
Key Drivers of Biomass Nanofiber Growth
Several factors fuel the growth of the biomass nanofiber market. The rising demand for sustainable and biodegradable materials is a key driver. Government regulations promoting the use of eco-friendly products are accelerating adoption. Technological advancements in production and functionalization methods improve the properties of nanofibers, broadening their applications. Cost reduction in production also enhances the commercial viability of this material.
Challenges in the Biomass Nanofiber Sector
Despite its potential, the biomass nanofiber industry faces challenges. High production costs compared to conventional materials pose a barrier to widespread adoption. Ensuring consistent product quality and standardization is crucial. Competition from established materials in certain applications requires effective differentiation strategies. Scaling up production to meet growing demand presents a significant challenge, requiring investments in advanced manufacturing technologies.
Emerging Opportunities in Biomass Nanofiber
Significant opportunities exist in developing innovative applications for biomass nanofibers in emerging fields such as flexible electronics and advanced biomaterials. Further research and development efforts are critical to optimize the properties and cost-effectiveness of these materials, expanding market penetration in established and novel applications. Collaboration between research institutions and industrial players is crucial for accelerating technological advancements and market growth.
Leading Players in the Biomass Nanofiber Market
- DAIO PAPER CORPORATION
- Innventia
- Kao Chemicals
- Kruger
- Marusumi Paper
- MIKI & CO., LTD
- NEDO
- Nippon Paper Group
- ScienceK
- Sugino
Key Developments in Biomass Nanofiber Industry
- 2022 Q3: Nippon Paper Group announces a new production facility for cellulose nanofibers.
- 2021 Q4: DAIO PAPER CORPORATION launches a new line of bio-based packaging materials.
- 2020 Q2: A significant M&A deal consolidates two key players in the market. (Further details are available within the full report)
Strategic Outlook for Biomass Nanofiber Market
The biomass nanofiber market is poised for significant growth over the forecast period. Continuous innovation in production techniques and applications will drive market expansion. Strategic partnerships and collaborations will play a crucial role in accelerating market penetration. The industry's commitment to sustainability and environmental friendliness will further boost market growth, creating a positive outlook for the future.
Biomass Nanofiber Segmentation
-
1. Application
- 1.1. Optical and Chemical Sensors
- 1.2. Energy Storage
- 1.3. Aerospace
- 1.4. Nanocatalysis
- 1.5. Others
-
2. Type
- 2.1. Cellulose Nanofiber
- 2.2. Chitin Nanofiber
- 2.3. Chitosan Nanofiber
Biomass Nanofiber Segmentation By Geography
-
1. North America
- 1.1. United States
- 1.2. Canada
- 1.3. Mexico
-
2. South America
- 2.1. Brazil
- 2.2. Argentina
- 2.3. Rest of South America
-
3. Europe
- 3.1. United Kingdom
- 3.2. Germany
- 3.3. France
- 3.4. Italy
- 3.5. Spain
- 3.6. Russia
- 3.7. Benelux
- 3.8. Nordics
- 3.9. Rest of Europe
-
4. Middle East & Africa
- 4.1. Turkey
- 4.2. Israel
- 4.3. GCC
- 4.4. North Africa
- 4.5. South Africa
- 4.6. Rest of Middle East & Africa
-
5. Asia Pacific
- 5.1. China
- 5.2. India
- 5.3. Japan
- 5.4. South Korea
- 5.5. ASEAN
- 5.6. Oceania
- 5.7. Rest of Asia Pacific
Biomass Nanofiber Regional Market Share
Geographic Coverage of Biomass Nanofiber
Biomass Nanofiber REPORT HIGHLIGHTS
| Aspects | Details |
|---|---|
| Study Period | 2020-2034 |
| Base Year | 2025 |
| Estimated Year | 2026 |
| Forecast Period | 2026-2034 |
| Historical Period | 2020-2025 |
| Growth Rate | CAGR of 6.4% from 2020-2034 |
| Segmentation |
|
Table of Contents
- 1. Introduction
- 1.1. Research Scope
- 1.2. Market Segmentation
- 1.3. Research Objective
- 1.4. Definitions and Assumptions
- 2. Executive Summary
- 2.1. Market Snapshot
- 3. Market Dynamics
- 3.1. Market Drivers
- 3.2. Market Restrains
- 3.3. Market Trends
- 3.4. Market Opportunities
- 4. Market Factor Analysis
- 4.1. Porters Five Forces
- 4.1.1. Bargaining Power of Suppliers
- 4.1.2. Bargaining Power of Buyers
- 4.1.3. Threat of New Entrants
- 4.1.4. Threat of Substitutes
- 4.1.5. Competitive Rivalry
- 4.2. PESTEL analysis
- 4.3. BCG Analysis
- 4.3.1. Stars (High Growth, High Market Share)
- 4.3.2. Cash Cows (Low Growth, High Market Share)
- 4.3.3. Question Mark (High Growth, Low Market Share)
- 4.3.4. Dogs (Low Growth, Low Market Share)
- 4.4. Ansoff Matrix Analysis
- 4.5. Supply Chain Analysis
- 4.6. Regulatory Landscape
- 4.7. Current Market Potential and Opportunity Assessment (TAM–SAM–SOM Framework)
- 4.8. RAX Analyst Note
- 4.1. Porters Five Forces
- 5. Market Analysis, Insights and Forecast 2021-2033
- 5.1. Market Analysis, Insights and Forecast - by Application
- 5.1.1. Optical and Chemical Sensors
- 5.1.2. Energy Storage
- 5.1.3. Aerospace
- 5.1.4. Nanocatalysis
- 5.1.5. Others
- 5.2. Market Analysis, Insights and Forecast - by Type
- 5.2.1. Cellulose Nanofiber
- 5.2.2. Chitin Nanofiber
- 5.2.3. Chitosan Nanofiber
- 5.3. Market Analysis, Insights and Forecast - by Region
- 5.3.1. North America
- 5.3.2. South America
- 5.3.3. Europe
- 5.3.4. Middle East & Africa
- 5.3.5. Asia Pacific
- 5.1. Market Analysis, Insights and Forecast - by Application
- 6. Global Biomass Nanofiber Analysis, Insights and Forecast, 2021-2033
- 6.1. Market Analysis, Insights and Forecast - by Application
- 6.1.1. Optical and Chemical Sensors
- 6.1.2. Energy Storage
- 6.1.3. Aerospace
- 6.1.4. Nanocatalysis
- 6.1.5. Others
- 6.2. Market Analysis, Insights and Forecast - by Type
- 6.2.1. Cellulose Nanofiber
- 6.2.2. Chitin Nanofiber
- 6.2.3. Chitosan Nanofiber
- 6.1. Market Analysis, Insights and Forecast - by Application
- 7. North America Biomass Nanofiber Analysis, Insights and Forecast, 2020-2032
- 7.1. Market Analysis, Insights and Forecast - by Application
- 7.1.1. Optical and Chemical Sensors
- 7.1.2. Energy Storage
- 7.1.3. Aerospace
- 7.1.4. Nanocatalysis
- 7.1.5. Others
- 7.2. Market Analysis, Insights and Forecast - by Type
- 7.2.1. Cellulose Nanofiber
- 7.2.2. Chitin Nanofiber
- 7.2.3. Chitosan Nanofiber
- 7.1. Market Analysis, Insights and Forecast - by Application
- 8. South America Biomass Nanofiber Analysis, Insights and Forecast, 2020-2032
- 8.1. Market Analysis, Insights and Forecast - by Application
- 8.1.1. Optical and Chemical Sensors
- 8.1.2. Energy Storage
- 8.1.3. Aerospace
- 8.1.4. Nanocatalysis
- 8.1.5. Others
- 8.2. Market Analysis, Insights and Forecast - by Type
- 8.2.1. Cellulose Nanofiber
- 8.2.2. Chitin Nanofiber
- 8.2.3. Chitosan Nanofiber
- 8.1. Market Analysis, Insights and Forecast - by Application
- 9. Europe Biomass Nanofiber Analysis, Insights and Forecast, 2020-2032
- 9.1. Market Analysis, Insights and Forecast - by Application
- 9.1.1. Optical and Chemical Sensors
- 9.1.2. Energy Storage
- 9.1.3. Aerospace
- 9.1.4. Nanocatalysis
- 9.1.5. Others
- 9.2. Market Analysis, Insights and Forecast - by Type
- 9.2.1. Cellulose Nanofiber
- 9.2.2. Chitin Nanofiber
- 9.2.3. Chitosan Nanofiber
- 9.1. Market Analysis, Insights and Forecast - by Application
- 10. Middle East & Africa Biomass Nanofiber Analysis, Insights and Forecast, 2020-2032
- 10.1. Market Analysis, Insights and Forecast - by Application
- 10.1.1. Optical and Chemical Sensors
- 10.1.2. Energy Storage
- 10.1.3. Aerospace
- 10.1.4. Nanocatalysis
- 10.1.5. Others
- 10.2. Market Analysis, Insights and Forecast - by Type
- 10.2.1. Cellulose Nanofiber
- 10.2.2. Chitin Nanofiber
- 10.2.3. Chitosan Nanofiber
- 10.1. Market Analysis, Insights and Forecast - by Application
- 11. Asia Pacific Biomass Nanofiber Analysis, Insights and Forecast, 2020-2032
- 11.1. Market Analysis, Insights and Forecast - by Application
- 11.1.1. Optical and Chemical Sensors
- 11.1.2. Energy Storage
- 11.1.3. Aerospace
- 11.1.4. Nanocatalysis
- 11.1.5. Others
- 11.2. Market Analysis, Insights and Forecast - by Type
- 11.2.1. Cellulose Nanofiber
- 11.2.2. Chitin Nanofiber
- 11.2.3. Chitosan Nanofiber
- 11.1. Market Analysis, Insights and Forecast - by Application
- 12. Competitive Analysis
- 12.1. Company Profiles
- 12.1.1 DAIO PAPER CORPORATION
- 12.1.1.1. Company Overview
- 12.1.1.2. Products
- 12.1.1.3. Company Financials
- 12.1.1.4. SWOT Analysis
- 12.1.2 Innventia
- 12.1.2.1. Company Overview
- 12.1.2.2. Products
- 12.1.2.3. Company Financials
- 12.1.2.4. SWOT Analysis
- 12.1.3 Kao Chemicals
- 12.1.3.1. Company Overview
- 12.1.3.2. Products
- 12.1.3.3. Company Financials
- 12.1.3.4. SWOT Analysis
- 12.1.4 Kruger
- 12.1.4.1. Company Overview
- 12.1.4.2. Products
- 12.1.4.3. Company Financials
- 12.1.4.4. SWOT Analysis
- 12.1.5 Marusumi Paper
- 12.1.5.1. Company Overview
- 12.1.5.2. Products
- 12.1.5.3. Company Financials
- 12.1.5.4. SWOT Analysis
- 12.1.6 MIKI &CO. LTD
- 12.1.6.1. Company Overview
- 12.1.6.2. Products
- 12.1.6.3. Company Financials
- 12.1.6.4. SWOT Analysis
- 12.1.7 NEDO
- 12.1.7.1. Company Overview
- 12.1.7.2. Products
- 12.1.7.3. Company Financials
- 12.1.7.4. SWOT Analysis
- 12.1.8 Nippon Paper Group
- 12.1.8.1. Company Overview
- 12.1.8.2. Products
- 12.1.8.3. Company Financials
- 12.1.8.4. SWOT Analysis
- 12.1.9 ScienceK
- 12.1.9.1. Company Overview
- 12.1.9.2. Products
- 12.1.9.3. Company Financials
- 12.1.9.4. SWOT Analysis
- 12.1.10 Sugino
- 12.1.10.1. Company Overview
- 12.1.10.2. Products
- 12.1.10.3. Company Financials
- 12.1.10.4. SWOT Analysis
- 12.1.1 DAIO PAPER CORPORATION
- 12.2. Market Entropy
- 12.2.1 Company's Key Areas Served
- 12.2.2 Recent Developments
- 12.3. Company Market Share Analysis 2025
- 12.3.1 Top 5 Companies Market Share Analysis
- 12.3.2 Top 3 Companies Market Share Analysis
- 12.4. List of Potential Customers
- 13. Research Methodology
List of Figures
- Figure 1: Global Biomass Nanofiber Revenue Breakdown (million, %) by Region 2025 & 2033
- Figure 2: North America Biomass Nanofiber Revenue (million), by Application 2025 & 2033
- Figure 3: North America Biomass Nanofiber Revenue Share (%), by Application 2025 & 2033
- Figure 4: North America Biomass Nanofiber Revenue (million), by Type 2025 & 2033
- Figure 5: North America Biomass Nanofiber Revenue Share (%), by Type 2025 & 2033
- Figure 6: North America Biomass Nanofiber Revenue (million), by Country 2025 & 2033
- Figure 7: North America Biomass Nanofiber Revenue Share (%), by Country 2025 & 2033
- Figure 8: South America Biomass Nanofiber Revenue (million), by Application 2025 & 2033
- Figure 9: South America Biomass Nanofiber Revenue Share (%), by Application 2025 & 2033
- Figure 10: South America Biomass Nanofiber Revenue (million), by Type 2025 & 2033
- Figure 11: South America Biomass Nanofiber Revenue Share (%), by Type 2025 & 2033
- Figure 12: South America Biomass Nanofiber Revenue (million), by Country 2025 & 2033
- Figure 13: South America Biomass Nanofiber Revenue Share (%), by Country 2025 & 2033
- Figure 14: Europe Biomass Nanofiber Revenue (million), by Application 2025 & 2033
- Figure 15: Europe Biomass Nanofiber Revenue Share (%), by Application 2025 & 2033
- Figure 16: Europe Biomass Nanofiber Revenue (million), by Type 2025 & 2033
- Figure 17: Europe Biomass Nanofiber Revenue Share (%), by Type 2025 & 2033
- Figure 18: Europe Biomass Nanofiber Revenue (million), by Country 2025 & 2033
- Figure 19: Europe Biomass Nanofiber Revenue Share (%), by Country 2025 & 2033
- Figure 20: Middle East & Africa Biomass Nanofiber Revenue (million), by Application 2025 & 2033
- Figure 21: Middle East & Africa Biomass Nanofiber Revenue Share (%), by Application 2025 & 2033
- Figure 22: Middle East & Africa Biomass Nanofiber Revenue (million), by Type 2025 & 2033
- Figure 23: Middle East & Africa Biomass Nanofiber Revenue Share (%), by Type 2025 & 2033
- Figure 24: Middle East & Africa Biomass Nanofiber Revenue (million), by Country 2025 & 2033
- Figure 25: Middle East & Africa Biomass Nanofiber Revenue Share (%), by Country 2025 & 2033
- Figure 26: Asia Pacific Biomass Nanofiber Revenue (million), by Application 2025 & 2033
- Figure 27: Asia Pacific Biomass Nanofiber Revenue Share (%), by Application 2025 & 2033
- Figure 28: Asia Pacific Biomass Nanofiber Revenue (million), by Type 2025 & 2033
- Figure 29: Asia Pacific Biomass Nanofiber Revenue Share (%), by Type 2025 & 2033
- Figure 30: Asia Pacific Biomass Nanofiber Revenue (million), by Country 2025 & 2033
- Figure 31: Asia Pacific Biomass Nanofiber Revenue Share (%), by Country 2025 & 2033
List of Tables
- Table 1: Global Biomass Nanofiber Revenue million Forecast, by Application 2020 & 2033
- Table 2: Global Biomass Nanofiber Revenue million Forecast, by Type 2020 & 2033
- Table 3: Global Biomass Nanofiber Revenue million Forecast, by Region 2020 & 2033
- Table 4: Global Biomass Nanofiber Revenue million Forecast, by Application 2020 & 2033
- Table 5: Global Biomass Nanofiber Revenue million Forecast, by Type 2020 & 2033
- Table 6: Global Biomass Nanofiber Revenue million Forecast, by Country 2020 & 2033
- Table 7: United States Biomass Nanofiber Revenue (million) Forecast, by Application 2020 & 2033
- Table 8: Canada Biomass Nanofiber Revenue (million) Forecast, by Application 2020 & 2033
- Table 9: Mexico Biomass Nanofiber Revenue (million) Forecast, by Application 2020 & 2033
- Table 10: Global Biomass Nanofiber Revenue million Forecast, by Application 2020 & 2033
- Table 11: Global Biomass Nanofiber Revenue million Forecast, by Type 2020 & 2033
- Table 12: Global Biomass Nanofiber Revenue million Forecast, by Country 2020 & 2033
- Table 13: Brazil Biomass Nanofiber Revenue (million) Forecast, by Application 2020 & 2033
- Table 14: Argentina Biomass Nanofiber Revenue (million) Forecast, by Application 2020 & 2033
- Table 15: Rest of South America Biomass Nanofiber Revenue (million) Forecast, by Application 2020 & 2033
- Table 16: Global Biomass Nanofiber Revenue million Forecast, by Application 2020 & 2033
- Table 17: Global Biomass Nanofiber Revenue million Forecast, by Type 2020 & 2033
- Table 18: Global Biomass Nanofiber Revenue million Forecast, by Country 2020 & 2033
- Table 19: United Kingdom Biomass Nanofiber Revenue (million) Forecast, by Application 2020 & 2033
- Table 20: Germany Biomass Nanofiber Revenue (million) Forecast, by Application 2020 & 2033
- Table 21: France Biomass Nanofiber Revenue (million) Forecast, by Application 2020 & 2033
- Table 22: Italy Biomass Nanofiber Revenue (million) Forecast, by Application 2020 & 2033
- Table 23: Spain Biomass Nanofiber Revenue (million) Forecast, by Application 2020 & 2033
- Table 24: Russia Biomass Nanofiber Revenue (million) Forecast, by Application 2020 & 2033
- Table 25: Benelux Biomass Nanofiber Revenue (million) Forecast, by Application 2020 & 2033
- Table 26: Nordics Biomass Nanofiber Revenue (million) Forecast, by Application 2020 & 2033
- Table 27: Rest of Europe Biomass Nanofiber Revenue (million) Forecast, by Application 2020 & 2033
- Table 28: Global Biomass Nanofiber Revenue million Forecast, by Application 2020 & 2033
- Table 29: Global Biomass Nanofiber Revenue million Forecast, by Type 2020 & 2033
- Table 30: Global Biomass Nanofiber Revenue million Forecast, by Country 2020 & 2033
- Table 31: Turkey Biomass Nanofiber Revenue (million) Forecast, by Application 2020 & 2033
- Table 32: Israel Biomass Nanofiber Revenue (million) Forecast, by Application 2020 & 2033
- Table 33: GCC Biomass Nanofiber Revenue (million) Forecast, by Application 2020 & 2033
- Table 34: North Africa Biomass Nanofiber Revenue (million) Forecast, by Application 2020 & 2033
- Table 35: South Africa Biomass Nanofiber Revenue (million) Forecast, by Application 2020 & 2033
- Table 36: Rest of Middle East & Africa Biomass Nanofiber Revenue (million) Forecast, by Application 2020 & 2033
- Table 37: Global Biomass Nanofiber Revenue million Forecast, by Application 2020 & 2033
- Table 38: Global Biomass Nanofiber Revenue million Forecast, by Type 2020 & 2033
- Table 39: Global Biomass Nanofiber Revenue million Forecast, by Country 2020 & 2033
- Table 40: China Biomass Nanofiber Revenue (million) Forecast, by Application 2020 & 2033
- Table 41: India Biomass Nanofiber Revenue (million) Forecast, by Application 2020 & 2033
- Table 42: Japan Biomass Nanofiber Revenue (million) Forecast, by Application 2020 & 2033
- Table 43: South Korea Biomass Nanofiber Revenue (million) Forecast, by Application 2020 & 2033
- Table 44: ASEAN Biomass Nanofiber Revenue (million) Forecast, by Application 2020 & 2033
- Table 45: Oceania Biomass Nanofiber Revenue (million) Forecast, by Application 2020 & 2033
- Table 46: Rest of Asia Pacific Biomass Nanofiber Revenue (million) Forecast, by Application 2020 & 2033
Frequently Asked Questions
1. What is the projected Compound Annual Growth Rate (CAGR) of the Biomass Nanofiber?
The projected CAGR is approximately 6.4%.
2. Which companies are prominent players in the Biomass Nanofiber?
Key companies in the market include DAIO PAPER CORPORATION, Innventia, Kao Chemicals, Kruger, Marusumi Paper, MIKI &CO., LTD, NEDO, Nippon Paper Group, ScienceK, Sugino.
3. What are the main segments of the Biomass Nanofiber?
The market segments include Application, Type.
4. Can you provide details about the market size?
The market size is estimated to be USD 440 million as of 2022.
5. What are some drivers contributing to market growth?
N/A
6. What are the notable trends driving market growth?
N/A
7. Are there any restraints impacting market growth?
N/A
8. Can you provide examples of recent developments in the market?
N/A
9. What pricing options are available for accessing the report?
Pricing options include single-user, multi-user, and enterprise licenses priced at USD 4900.00, USD 7350.00, and USD 9800.00 respectively.
10. Is the market size provided in terms of value or volume?
The market size is provided in terms of value, measured in million.
11. Are there any specific market keywords associated with the report?
Yes, the market keyword associated with the report is "Biomass Nanofiber," which aids in identifying and referencing the specific market segment covered.
12. How do I determine which pricing option suits my needs best?
The pricing options vary based on user requirements and access needs. Individual users may opt for single-user licenses, while businesses requiring broader access may choose multi-user or enterprise licenses for cost-effective access to the report.
13. Are there any additional resources or data provided in the Biomass Nanofiber report?
While the report offers comprehensive insights, it's advisable to review the specific contents or supplementary materials provided to ascertain if additional resources or data are available.
14. How can I stay updated on further developments or reports in the Biomass Nanofiber?
To stay informed about further developments, trends, and reports in the Biomass Nanofiber, consider subscribing to industry newsletters, following relevant companies and organizations, or regularly checking reputable industry news sources and publications.
Methodology
Step 1 - Identification of Relevant Samples Size from Population Database


Step 2 - Approaches for Defining Global Market Size (Value, Volume* & Price*)

Note*: In applicable scenarios
Step 3 - Data Sources
Primary Research
- Web Analytics
- Survey Reports
- Research Institute
- Latest Research Reports
- Opinion Leaders
Secondary Research
- Annual Reports
- White Paper
- Latest Press Release
- Industry Association
- Paid Database
- Investor Presentations

Step 4 - Data Triangulation
Involves using different sources of information in order to increase the validity of a study
These sources are likely to be stakeholders in a program - participants, other researchers, program staff, other community members, and so on.
Then we put all data in single framework & apply various statistical tools to find out the dynamic on the market.
During the analysis stage, feedback from the stakeholder groups would be compared to determine areas of agreement as well as areas of divergence