

Key Insights
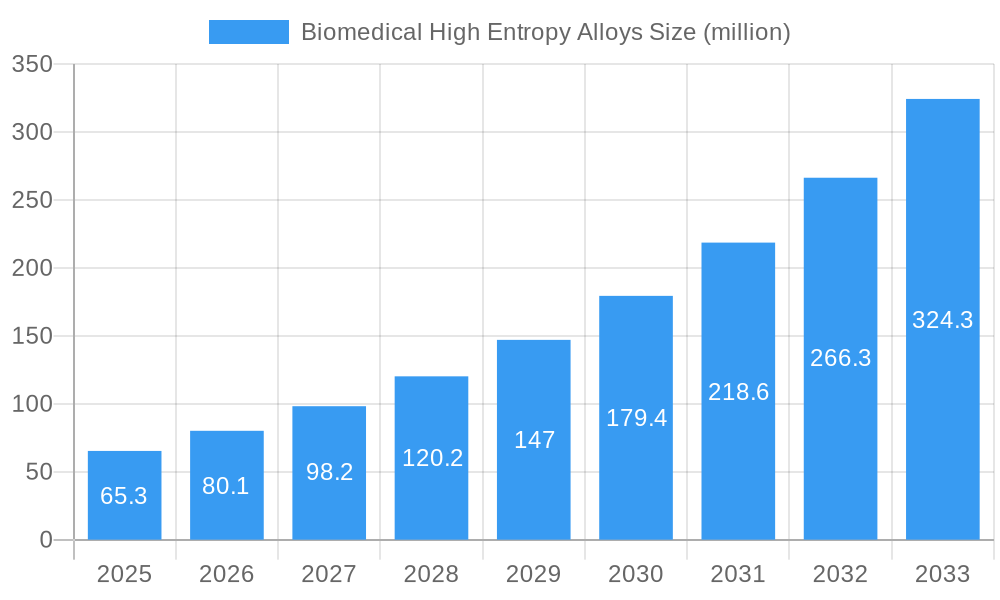
The biomedical high-entropy alloys (HEA) market is experiencing robust growth, projected to reach a market size of $65.3 million in 2025, expanding at a compound annual growth rate (CAGR) of 22.9% from 2025 to 2033. This significant expansion is driven by several factors. The increasing demand for biocompatible and high-performance materials in medical implants, particularly those requiring enhanced strength, corrosion resistance, and bioactivity, fuels market growth. Advancements in additive manufacturing techniques, enabling the creation of complex and customized HEA components for precise applications, further contribute to market expansion. The unique properties of HEAs, such as their superior strength-to-weight ratio and resistance to wear and tear compared to traditional alloys, are proving invaluable in the development of next-generation medical devices, leading to increased adoption. Furthermore, ongoing research and development efforts focused on improving the biocompatibility and tailoring the properties of HEAs for specific biomedical applications are expected to propel market growth throughout the forecast period.
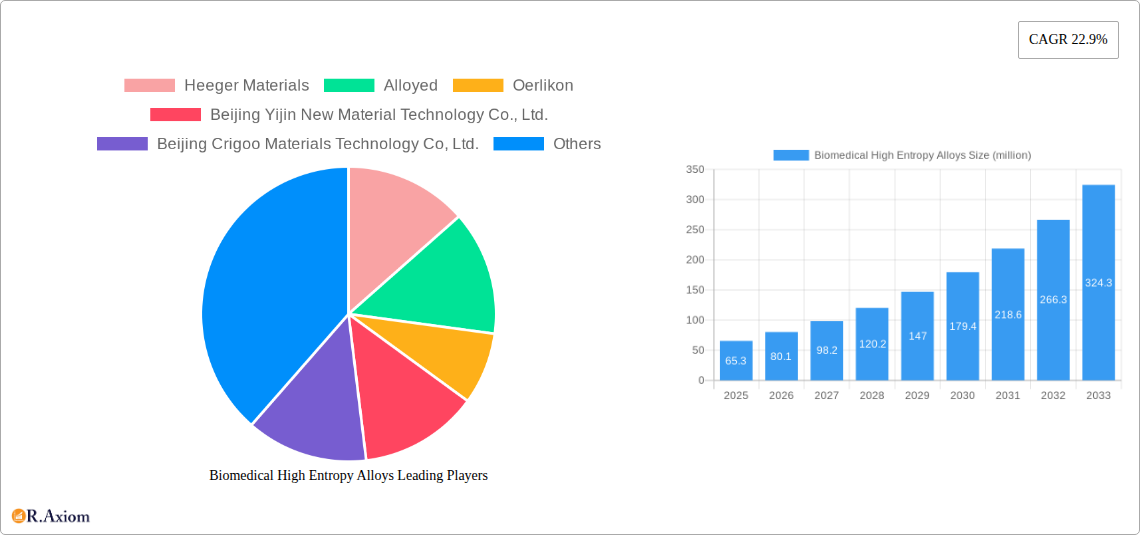
Biomedical High Entropy Alloys Market Size (In Million)
Key players like Heeger Materials, Alloyed, Oerlikon, and several prominent Chinese companies are actively involved in developing and commercializing these alloys. However, challenges remain, such as the relatively high cost of production and the need for further research to fully understand the long-term biocompatibility of certain HEA compositions. Nevertheless, the considerable potential benefits and ongoing innovation within the field suggest a continuously expanding market for biomedical HEAs. Future growth will likely be shaped by regulatory approvals, the expansion of clinical trials showcasing the efficacy of HEA-based implants, and successful integration into established medical practices. Regional variations in adoption rates will likely be influenced by healthcare infrastructure, regulatory landscapes, and the availability of skilled manufacturing capabilities.
Biomedical High Entropy Alloys Company Market Share
Biomedical High Entropy Alloys Market Report: 2019-2033
This comprehensive report provides a detailed analysis of the Biomedical High Entropy Alloys market, offering invaluable insights for stakeholders across the value chain. With a study period spanning 2019-2033, a base year of 2025, and a forecast period of 2025-2033, this report meticulously examines market dynamics, growth drivers, challenges, and opportunities, providing a clear roadmap for strategic decision-making. The report leverages extensive market research, incorporating data from the historical period (2019-2024) and projecting future trends. The total market size in 2025 is estimated at $xx million.
Biomedical High Entropy Alloys Market Concentration & Innovation
This section analyzes the competitive landscape of the biomedical high entropy alloys market, focusing on market concentration, innovation drivers, regulatory frameworks, product substitutes, end-user trends, and M&A activities. The market exhibits a moderately concentrated structure, with a few dominant players commanding significant market share. The estimated market share of the top 5 players in 2025 is approximately xx%. Several factors influence market concentration, including the high barrier to entry due to specialized manufacturing processes, stringent regulatory requirements, and the need for extensive research and development.
Innovation is a key driver within the sector, with companies constantly investing in developing new alloys with enhanced biocompatibility, strength, and corrosion resistance. Regulatory frameworks, particularly those related to biomaterials, play a crucial role in shaping market dynamics. The presence of substitutes, such as traditional metallic biomaterials like titanium alloys and stainless steel, poses a competitive challenge. End-user trends, notably the increasing demand for minimally invasive procedures and personalized medicine, influence the demand for advanced biomaterials. M&A activities are observed sporadically, though the total M&A deal values during the historical period (2019-2024) are estimated at $xx million, suggesting potential for future consolidation.
- Market Share (2025): Top 5 players: xx%
- M&A Deal Value (2019-2024): $xx million
- Key Innovation Drivers: Enhanced biocompatibility, improved mechanical properties, corrosion resistance.
- Regulatory Impact: Stringent approvals for biomaterials significantly impact market entry.
Biomedical High Entropy Alloys Industry Trends & Insights
The biomedical high entropy alloys market is characterized by robust growth, driven by several key factors. The compound annual growth rate (CAGR) from 2025 to 2033 is projected to be xx%, fueled by the increasing prevalence of chronic diseases requiring implantable devices, growing demand for minimally invasive surgeries, and the rising adoption of personalized medicine. Technological advancements, particularly in additive manufacturing and surface modification techniques, are enabling the creation of highly customized and precisely engineered alloys for specific biomedical applications. Consumer preferences are shifting towards more biocompatible and durable materials, leading to increased adoption of high entropy alloys. Competitive dynamics are shaped by ongoing innovation, strategic partnerships, and investments in research and development. Market penetration of high entropy alloys in the biomedical sector remains relatively low but shows significant potential for expansion, with an estimated market penetration rate of xx% in 2025, projected to increase to xx% by 2033.
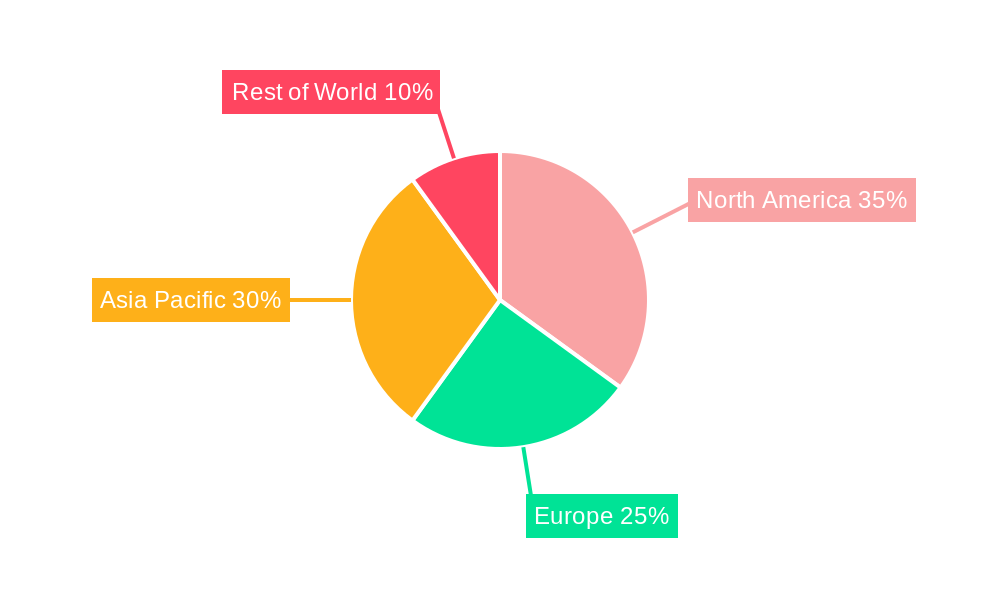
Dominant Markets & Segments in Biomedical High Entropy Alloys
The North American region currently holds a dominant position in the biomedical high entropy alloys market, driven by robust healthcare infrastructure, significant research and development investments, and a high prevalence of chronic diseases. Several key factors contribute to North America’s dominance:
- Robust Healthcare Infrastructure: Extensive network of hospitals, research institutions, and regulatory bodies facilitating rapid adoption of new technologies.
- High R&D Investments: Significant funding for biomedical research and development from both public and private sectors.
- Favorable Regulatory Environment: Streamlined regulatory pathways for medical device approvals.
Europe and Asia-Pacific are also witnessing significant growth, although at a slower pace compared to North America. The Asia-Pacific region's growth is fueled by an expanding healthcare infrastructure and rising disposable incomes, but regulatory hurdles and the relatively nascent nature of the market pose challenges.
Biomedical High Entropy Alloys Product Developments
Recent years have witnessed significant advancements in biomedical high entropy alloy development, focusing on improving biocompatibility, strength, and corrosion resistance. Novel alloy compositions incorporating elements like tantalum, niobium, and zirconium are being explored to enhance mechanical properties and biointegration. Additive manufacturing techniques, such as selective laser melting (SLM), are being increasingly used to create complex geometries and customized implants. These advancements are leading to improved clinical outcomes and patient satisfaction, making high entropy alloys a compelling alternative to traditional biomaterials. The competitive advantages of these alloys include superior strength-to-weight ratios, excellent corrosion resistance, and the potential for enhanced biocompatibility through surface modifications.
Report Scope & Segmentation Analysis
This report provides a comprehensive segmentation of the biomedical high entropy alloys market, encompassing different alloy compositions, applications (orthopedic implants, dental implants, cardiovascular devices), and geographical regions (North America, Europe, Asia-Pacific, Rest of World). Growth projections vary across segments, with orthopedic implants projected to remain the largest segment throughout the forecast period due to the increasing incidence of orthopedic conditions. Competitive dynamics also differ across segments, with varying degrees of concentration and innovation activity. Market sizes for each segment are detailed in the main report, including growth projections and analysis of competitive intensity.
Key Drivers of Biomedical High Entropy Alloys Growth
The growth of the biomedical high entropy alloys market is propelled by several key factors: rising prevalence of chronic diseases requiring implants, the increasing demand for minimally invasive surgical procedures, and the growing adoption of personalized medicine approaches. Technological advancements, such as additive manufacturing and surface engineering techniques, enable the production of customized, high-performance implants. Government initiatives and supportive regulatory environments facilitate market expansion. The increasing awareness of the benefits of high entropy alloys among surgeons and medical professionals further accelerates market adoption. Finally, the sustained investments in research and development by both established players and new entrants further contribute to this market's expansion.
Challenges in the Biomedical High Entropy Alloys Sector
The biomedical high entropy alloys market faces several challenges including the high cost of materials and manufacturing processes, the complexity of alloy design and optimization, and stringent regulatory requirements for biomaterials approval. The relatively nascent nature of the technology necessitates ongoing research and development to fully understand the long-term biocompatibility and performance of these alloys. Supply chain disruptions and fluctuations in the prices of rare earth elements can also impact the cost and availability of these materials. Finally, competition from established biomaterials like titanium and stainless steel poses a significant challenge. These factors collectively contribute to slowing the market’s growth rate.
Emerging Opportunities in Biomedical High Entropy Alloys
Significant opportunities exist for growth in this market. The development of novel alloy compositions with enhanced properties, such as improved bioactivity and osseointegration, presents a significant avenue for future innovation. Expansion into new applications, such as drug delivery systems and biosensors, also holds substantial promise. Advances in additive manufacturing techniques offer scope for creating complex, patient-specific implants, boosting market demand. Further, increased collaborations between material scientists, biomedical engineers, and clinicians will facilitate accelerated technological advancements and wider adoption of these advanced materials.
Leading Players in the Biomedical High Entropy Alloys Market
- Heeger Materials
- Alloyed
- Oerlikon
- Beijing Yijin New Material Technology Co., Ltd.
- Beijing Crigoo Materials Technology Co, Ltd.
- Beijing High Entropy Alloy New Material Technology Co., Ltd.
- Beijing Yanbang New Material Technology Co., Ltd.
- Shanghai Truer
- Metalysis
- Stanford Advanced Materials
- ATT Advanced Elemental Materials Co., Ltd.
- Jiangxi Yongtai Powder Metallurgy Co., Ltd.
- STARDUST
- GREES (BEIJING) NEW MATERIAL TECHNOLOGY CO., LTD.
- Beijing Ruichi High-tech Co., Ltd.
Key Developments in Biomedical High Entropy Alloys Industry
- 2022 Q3: Heeger Materials announced the successful development of a new high-entropy alloy with enhanced biocompatibility for orthopedic implants.
- 2023 Q1: Alloyed and Oerlikon formed a strategic partnership to collaborate on the development and manufacturing of high entropy alloys for medical applications.
- 2024 Q2: Beijing Yijin New Material Technology Co., Ltd. received regulatory approval for a new high-entropy alloy dental implant. (Note: Further specific developments and their dates are included in the full report.)
Strategic Outlook for Biomedical High Entropy Alloys Market
The future of the biomedical high entropy alloys market is bright, driven by the aforementioned technological advancements, growing healthcare needs, and supportive regulatory environments. Further research into alloy compositions, surface modifications, and manufacturing processes is expected to lead to even more advanced and versatile biomaterials. The market is poised for significant growth as the advantages of high entropy alloys become increasingly recognized within the medical community. The continued investment in R&D, along with strategic collaborations, will play a crucial role in shaping the market's trajectory in the coming years, fostering innovation and broadening applications, ultimately leading to improved patient outcomes.
Biomedical High Entropy Alloys Segmentation
-
1. Application
- 1.1. Biomaterials
- 1.2. Medical Devices
- 1.3. Others
-
2. Type
- 2.1. Powder
- 2.2. Rod
- 2.3. Plate
- 2.4. Others
Biomedical High Entropy Alloys Segmentation By Geography
-
1. North America
- 1.1. United States
- 1.2. Canada
- 1.3. Mexico
-
2. South America
- 2.1. Brazil
- 2.2. Argentina
- 2.3. Rest of South America
-
3. Europe
- 3.1. United Kingdom
- 3.2. Germany
- 3.3. France
- 3.4. Italy
- 3.5. Spain
- 3.6. Russia
- 3.7. Benelux
- 3.8. Nordics
- 3.9. Rest of Europe
-
4. Middle East & Africa
- 4.1. Turkey
- 4.2. Israel
- 4.3. GCC
- 4.4. North Africa
- 4.5. South Africa
- 4.6. Rest of Middle East & Africa
-
5. Asia Pacific
- 5.1. China
- 5.2. India
- 5.3. Japan
- 5.4. South Korea
- 5.5. ASEAN
- 5.6. Oceania
- 5.7. Rest of Asia Pacific
Biomedical High Entropy Alloys Regional Market Share
Geographic Coverage of Biomedical High Entropy Alloys
Biomedical High Entropy Alloys REPORT HIGHLIGHTS
| Aspects | Details |
|---|---|
| Study Period | 2020-2034 |
| Base Year | 2025 |
| Estimated Year | 2026 |
| Forecast Period | 2026-2034 |
| Historical Period | 2020-2025 |
| Growth Rate | CAGR of 22.9% from 2020-2034 |
| Segmentation |
|
Table of Contents
- 1. Introduction
- 1.1. Research Scope
- 1.2. Market Segmentation
- 1.3. Research Objective
- 1.4. Definitions and Assumptions
- 2. Executive Summary
- 2.1. Market Snapshot
- 3. Market Dynamics
- 3.1. Market Drivers
- 3.2. Market Restrains
- 3.3. Market Trends
- 3.4. Market Opportunities
- 4. Market Factor Analysis
- 4.1. Porters Five Forces
- 4.1.1. Bargaining Power of Suppliers
- 4.1.2. Bargaining Power of Buyers
- 4.1.3. Threat of New Entrants
- 4.1.4. Threat of Substitutes
- 4.1.5. Competitive Rivalry
- 4.2. PESTEL analysis
- 4.3. BCG Analysis
- 4.3.1. Stars (High Growth, High Market Share)
- 4.3.2. Cash Cows (Low Growth, High Market Share)
- 4.3.3. Question Mark (High Growth, Low Market Share)
- 4.3.4. Dogs (Low Growth, Low Market Share)
- 4.4. Ansoff Matrix Analysis
- 4.5. Supply Chain Analysis
- 4.6. Regulatory Landscape
- 4.7. Current Market Potential and Opportunity Assessment (TAM–SAM–SOM Framework)
- 4.8. RAX Analyst Note
- 4.1. Porters Five Forces
- 5. Market Analysis, Insights and Forecast 2021-2033
- 5.1. Market Analysis, Insights and Forecast - by Application
- 5.1.1. Biomaterials
- 5.1.2. Medical Devices
- 5.1.3. Others
- 5.2. Market Analysis, Insights and Forecast - by Type
- 5.2.1. Powder
- 5.2.2. Rod
- 5.2.3. Plate
- 5.2.4. Others
- 5.3. Market Analysis, Insights and Forecast - by Region
- 5.3.1. North America
- 5.3.2. South America
- 5.3.3. Europe
- 5.3.4. Middle East & Africa
- 5.3.5. Asia Pacific
- 5.1. Market Analysis, Insights and Forecast - by Application
- 6. Global Biomedical High Entropy Alloys Analysis, Insights and Forecast, 2021-2033
- 6.1. Market Analysis, Insights and Forecast - by Application
- 6.1.1. Biomaterials
- 6.1.2. Medical Devices
- 6.1.3. Others
- 6.2. Market Analysis, Insights and Forecast - by Type
- 6.2.1. Powder
- 6.2.2. Rod
- 6.2.3. Plate
- 6.2.4. Others
- 6.1. Market Analysis, Insights and Forecast - by Application
- 7. North America Biomedical High Entropy Alloys Analysis, Insights and Forecast, 2020-2032
- 7.1. Market Analysis, Insights and Forecast - by Application
- 7.1.1. Biomaterials
- 7.1.2. Medical Devices
- 7.1.3. Others
- 7.2. Market Analysis, Insights and Forecast - by Type
- 7.2.1. Powder
- 7.2.2. Rod
- 7.2.3. Plate
- 7.2.4. Others
- 7.1. Market Analysis, Insights and Forecast - by Application
- 8. South America Biomedical High Entropy Alloys Analysis, Insights and Forecast, 2020-2032
- 8.1. Market Analysis, Insights and Forecast - by Application
- 8.1.1. Biomaterials
- 8.1.2. Medical Devices
- 8.1.3. Others
- 8.2. Market Analysis, Insights and Forecast - by Type
- 8.2.1. Powder
- 8.2.2. Rod
- 8.2.3. Plate
- 8.2.4. Others
- 8.1. Market Analysis, Insights and Forecast - by Application
- 9. Europe Biomedical High Entropy Alloys Analysis, Insights and Forecast, 2020-2032
- 9.1. Market Analysis, Insights and Forecast - by Application
- 9.1.1. Biomaterials
- 9.1.2. Medical Devices
- 9.1.3. Others
- 9.2. Market Analysis, Insights and Forecast - by Type
- 9.2.1. Powder
- 9.2.2. Rod
- 9.2.3. Plate
- 9.2.4. Others
- 9.1. Market Analysis, Insights and Forecast - by Application
- 10. Middle East & Africa Biomedical High Entropy Alloys Analysis, Insights and Forecast, 2020-2032
- 10.1. Market Analysis, Insights and Forecast - by Application
- 10.1.1. Biomaterials
- 10.1.2. Medical Devices
- 10.1.3. Others
- 10.2. Market Analysis, Insights and Forecast - by Type
- 10.2.1. Powder
- 10.2.2. Rod
- 10.2.3. Plate
- 10.2.4. Others
- 10.1. Market Analysis, Insights and Forecast - by Application
- 11. Asia Pacific Biomedical High Entropy Alloys Analysis, Insights and Forecast, 2020-2032
- 11.1. Market Analysis, Insights and Forecast - by Application
- 11.1.1. Biomaterials
- 11.1.2. Medical Devices
- 11.1.3. Others
- 11.2. Market Analysis, Insights and Forecast - by Type
- 11.2.1. Powder
- 11.2.2. Rod
- 11.2.3. Plate
- 11.2.4. Others
- 11.1. Market Analysis, Insights and Forecast - by Application
- 12. Competitive Analysis
- 12.1. Company Profiles
- 12.1.1 Heeger Materials
- 12.1.1.1. Company Overview
- 12.1.1.2. Products
- 12.1.1.3. Company Financials
- 12.1.1.4. SWOT Analysis
- 12.1.2 Alloyed
- 12.1.2.1. Company Overview
- 12.1.2.2. Products
- 12.1.2.3. Company Financials
- 12.1.2.4. SWOT Analysis
- 12.1.3 Oerlikon
- 12.1.3.1. Company Overview
- 12.1.3.2. Products
- 12.1.3.3. Company Financials
- 12.1.3.4. SWOT Analysis
- 12.1.4 Beijing Yijin New Material Technology Co. Ltd.
- 12.1.4.1. Company Overview
- 12.1.4.2. Products
- 12.1.4.3. Company Financials
- 12.1.4.4. SWOT Analysis
- 12.1.5 Beijing Crigoo Materials Technology Co Ltd.
- 12.1.5.1. Company Overview
- 12.1.5.2. Products
- 12.1.5.3. Company Financials
- 12.1.5.4. SWOT Analysis
- 12.1.6 Beijing High Entropy Alloy New Material Technology Co. Ltd.
- 12.1.6.1. Company Overview
- 12.1.6.2. Products
- 12.1.6.3. Company Financials
- 12.1.6.4. SWOT Analysis
- 12.1.7 Beijing Yanbang New Material Technology Co. Ltd.
- 12.1.7.1. Company Overview
- 12.1.7.2. Products
- 12.1.7.3. Company Financials
- 12.1.7.4. SWOT Analysis
- 12.1.8 Shanghai Truer
- 12.1.8.1. Company Overview
- 12.1.8.2. Products
- 12.1.8.3. Company Financials
- 12.1.8.4. SWOT Analysis
- 12.1.9 Metalysis
- 12.1.9.1. Company Overview
- 12.1.9.2. Products
- 12.1.9.3. Company Financials
- 12.1.9.4. SWOT Analysis
- 12.1.10 Stanford Advanced Materials
- 12.1.10.1. Company Overview
- 12.1.10.2. Products
- 12.1.10.3. Company Financials
- 12.1.10.4. SWOT Analysis
- 12.1.11 ATT Advanced Elemental Materials Co. Ltd.
- 12.1.11.1. Company Overview
- 12.1.11.2. Products
- 12.1.11.3. Company Financials
- 12.1.11.4. SWOT Analysis
- 12.1.12 Jiangxi Yongtai Powder Metallurgy Co. Ltd.
- 12.1.12.1. Company Overview
- 12.1.12.2. Products
- 12.1.12.3. Company Financials
- 12.1.12.4. SWOT Analysis
- 12.1.13 STARDUST
- 12.1.13.1. Company Overview
- 12.1.13.2. Products
- 12.1.13.3. Company Financials
- 12.1.13.4. SWOT Analysis
- 12.1.14 GREES (BEIJING) NEW MATERIAL TECHNOLOGY CO. LTD.
- 12.1.14.1. Company Overview
- 12.1.14.2. Products
- 12.1.14.3. Company Financials
- 12.1.14.4. SWOT Analysis
- 12.1.15 Beijing Ruichi High-tech Co. Ltd.
- 12.1.15.1. Company Overview
- 12.1.15.2. Products
- 12.1.15.3. Company Financials
- 12.1.15.4. SWOT Analysis
- 12.1.1 Heeger Materials
- 12.2. Market Entropy
- 12.2.1 Company's Key Areas Served
- 12.2.2 Recent Developments
- 12.3. Company Market Share Analysis 2025
- 12.3.1 Top 5 Companies Market Share Analysis
- 12.3.2 Top 3 Companies Market Share Analysis
- 12.4. List of Potential Customers
- 13. Research Methodology
List of Figures
- Figure 1: Global Biomedical High Entropy Alloys Revenue Breakdown (million, %) by Region 2025 & 2033
- Figure 2: Global Biomedical High Entropy Alloys Volume Breakdown (K, %) by Region 2025 & 2033
- Figure 3: North America Biomedical High Entropy Alloys Revenue (million), by Application 2025 & 2033
- Figure 4: North America Biomedical High Entropy Alloys Volume (K), by Application 2025 & 2033
- Figure 5: North America Biomedical High Entropy Alloys Revenue Share (%), by Application 2025 & 2033
- Figure 6: North America Biomedical High Entropy Alloys Volume Share (%), by Application 2025 & 2033
- Figure 7: North America Biomedical High Entropy Alloys Revenue (million), by Type 2025 & 2033
- Figure 8: North America Biomedical High Entropy Alloys Volume (K), by Type 2025 & 2033
- Figure 9: North America Biomedical High Entropy Alloys Revenue Share (%), by Type 2025 & 2033
- Figure 10: North America Biomedical High Entropy Alloys Volume Share (%), by Type 2025 & 2033
- Figure 11: North America Biomedical High Entropy Alloys Revenue (million), by Country 2025 & 2033
- Figure 12: North America Biomedical High Entropy Alloys Volume (K), by Country 2025 & 2033
- Figure 13: North America Biomedical High Entropy Alloys Revenue Share (%), by Country 2025 & 2033
- Figure 14: North America Biomedical High Entropy Alloys Volume Share (%), by Country 2025 & 2033
- Figure 15: South America Biomedical High Entropy Alloys Revenue (million), by Application 2025 & 2033
- Figure 16: South America Biomedical High Entropy Alloys Volume (K), by Application 2025 & 2033
- Figure 17: South America Biomedical High Entropy Alloys Revenue Share (%), by Application 2025 & 2033
- Figure 18: South America Biomedical High Entropy Alloys Volume Share (%), by Application 2025 & 2033
- Figure 19: South America Biomedical High Entropy Alloys Revenue (million), by Type 2025 & 2033
- Figure 20: South America Biomedical High Entropy Alloys Volume (K), by Type 2025 & 2033
- Figure 21: South America Biomedical High Entropy Alloys Revenue Share (%), by Type 2025 & 2033
- Figure 22: South America Biomedical High Entropy Alloys Volume Share (%), by Type 2025 & 2033
- Figure 23: South America Biomedical High Entropy Alloys Revenue (million), by Country 2025 & 2033
- Figure 24: South America Biomedical High Entropy Alloys Volume (K), by Country 2025 & 2033
- Figure 25: South America Biomedical High Entropy Alloys Revenue Share (%), by Country 2025 & 2033
- Figure 26: South America Biomedical High Entropy Alloys Volume Share (%), by Country 2025 & 2033
- Figure 27: Europe Biomedical High Entropy Alloys Revenue (million), by Application 2025 & 2033
- Figure 28: Europe Biomedical High Entropy Alloys Volume (K), by Application 2025 & 2033
- Figure 29: Europe Biomedical High Entropy Alloys Revenue Share (%), by Application 2025 & 2033
- Figure 30: Europe Biomedical High Entropy Alloys Volume Share (%), by Application 2025 & 2033
- Figure 31: Europe Biomedical High Entropy Alloys Revenue (million), by Type 2025 & 2033
- Figure 32: Europe Biomedical High Entropy Alloys Volume (K), by Type 2025 & 2033
- Figure 33: Europe Biomedical High Entropy Alloys Revenue Share (%), by Type 2025 & 2033
- Figure 34: Europe Biomedical High Entropy Alloys Volume Share (%), by Type 2025 & 2033
- Figure 35: Europe Biomedical High Entropy Alloys Revenue (million), by Country 2025 & 2033
- Figure 36: Europe Biomedical High Entropy Alloys Volume (K), by Country 2025 & 2033
- Figure 37: Europe Biomedical High Entropy Alloys Revenue Share (%), by Country 2025 & 2033
- Figure 38: Europe Biomedical High Entropy Alloys Volume Share (%), by Country 2025 & 2033
- Figure 39: Middle East & Africa Biomedical High Entropy Alloys Revenue (million), by Application 2025 & 2033
- Figure 40: Middle East & Africa Biomedical High Entropy Alloys Volume (K), by Application 2025 & 2033
- Figure 41: Middle East & Africa Biomedical High Entropy Alloys Revenue Share (%), by Application 2025 & 2033
- Figure 42: Middle East & Africa Biomedical High Entropy Alloys Volume Share (%), by Application 2025 & 2033
- Figure 43: Middle East & Africa Biomedical High Entropy Alloys Revenue (million), by Type 2025 & 2033
- Figure 44: Middle East & Africa Biomedical High Entropy Alloys Volume (K), by Type 2025 & 2033
- Figure 45: Middle East & Africa Biomedical High Entropy Alloys Revenue Share (%), by Type 2025 & 2033
- Figure 46: Middle East & Africa Biomedical High Entropy Alloys Volume Share (%), by Type 2025 & 2033
- Figure 47: Middle East & Africa Biomedical High Entropy Alloys Revenue (million), by Country 2025 & 2033
- Figure 48: Middle East & Africa Biomedical High Entropy Alloys Volume (K), by Country 2025 & 2033
- Figure 49: Middle East & Africa Biomedical High Entropy Alloys Revenue Share (%), by Country 2025 & 2033
- Figure 50: Middle East & Africa Biomedical High Entropy Alloys Volume Share (%), by Country 2025 & 2033
- Figure 51: Asia Pacific Biomedical High Entropy Alloys Revenue (million), by Application 2025 & 2033
- Figure 52: Asia Pacific Biomedical High Entropy Alloys Volume (K), by Application 2025 & 2033
- Figure 53: Asia Pacific Biomedical High Entropy Alloys Revenue Share (%), by Application 2025 & 2033
- Figure 54: Asia Pacific Biomedical High Entropy Alloys Volume Share (%), by Application 2025 & 2033
- Figure 55: Asia Pacific Biomedical High Entropy Alloys Revenue (million), by Type 2025 & 2033
- Figure 56: Asia Pacific Biomedical High Entropy Alloys Volume (K), by Type 2025 & 2033
- Figure 57: Asia Pacific Biomedical High Entropy Alloys Revenue Share (%), by Type 2025 & 2033
- Figure 58: Asia Pacific Biomedical High Entropy Alloys Volume Share (%), by Type 2025 & 2033
- Figure 59: Asia Pacific Biomedical High Entropy Alloys Revenue (million), by Country 2025 & 2033
- Figure 60: Asia Pacific Biomedical High Entropy Alloys Volume (K), by Country 2025 & 2033
- Figure 61: Asia Pacific Biomedical High Entropy Alloys Revenue Share (%), by Country 2025 & 2033
- Figure 62: Asia Pacific Biomedical High Entropy Alloys Volume Share (%), by Country 2025 & 2033
List of Tables
- Table 1: Global Biomedical High Entropy Alloys Revenue million Forecast, by Application 2020 & 2033
- Table 2: Global Biomedical High Entropy Alloys Volume K Forecast, by Application 2020 & 2033
- Table 3: Global Biomedical High Entropy Alloys Revenue million Forecast, by Type 2020 & 2033
- Table 4: Global Biomedical High Entropy Alloys Volume K Forecast, by Type 2020 & 2033
- Table 5: Global Biomedical High Entropy Alloys Revenue million Forecast, by Region 2020 & 2033
- Table 6: Global Biomedical High Entropy Alloys Volume K Forecast, by Region 2020 & 2033
- Table 7: Global Biomedical High Entropy Alloys Revenue million Forecast, by Application 2020 & 2033
- Table 8: Global Biomedical High Entropy Alloys Volume K Forecast, by Application 2020 & 2033
- Table 9: Global Biomedical High Entropy Alloys Revenue million Forecast, by Type 2020 & 2033
- Table 10: Global Biomedical High Entropy Alloys Volume K Forecast, by Type 2020 & 2033
- Table 11: Global Biomedical High Entropy Alloys Revenue million Forecast, by Country 2020 & 2033
- Table 12: Global Biomedical High Entropy Alloys Volume K Forecast, by Country 2020 & 2033
- Table 13: United States Biomedical High Entropy Alloys Revenue (million) Forecast, by Application 2020 & 2033
- Table 14: United States Biomedical High Entropy Alloys Volume (K) Forecast, by Application 2020 & 2033
- Table 15: Canada Biomedical High Entropy Alloys Revenue (million) Forecast, by Application 2020 & 2033
- Table 16: Canada Biomedical High Entropy Alloys Volume (K) Forecast, by Application 2020 & 2033
- Table 17: Mexico Biomedical High Entropy Alloys Revenue (million) Forecast, by Application 2020 & 2033
- Table 18: Mexico Biomedical High Entropy Alloys Volume (K) Forecast, by Application 2020 & 2033
- Table 19: Global Biomedical High Entropy Alloys Revenue million Forecast, by Application 2020 & 2033
- Table 20: Global Biomedical High Entropy Alloys Volume K Forecast, by Application 2020 & 2033
- Table 21: Global Biomedical High Entropy Alloys Revenue million Forecast, by Type 2020 & 2033
- Table 22: Global Biomedical High Entropy Alloys Volume K Forecast, by Type 2020 & 2033
- Table 23: Global Biomedical High Entropy Alloys Revenue million Forecast, by Country 2020 & 2033
- Table 24: Global Biomedical High Entropy Alloys Volume K Forecast, by Country 2020 & 2033
- Table 25: Brazil Biomedical High Entropy Alloys Revenue (million) Forecast, by Application 2020 & 2033
- Table 26: Brazil Biomedical High Entropy Alloys Volume (K) Forecast, by Application 2020 & 2033
- Table 27: Argentina Biomedical High Entropy Alloys Revenue (million) Forecast, by Application 2020 & 2033
- Table 28: Argentina Biomedical High Entropy Alloys Volume (K) Forecast, by Application 2020 & 2033
- Table 29: Rest of South America Biomedical High Entropy Alloys Revenue (million) Forecast, by Application 2020 & 2033
- Table 30: Rest of South America Biomedical High Entropy Alloys Volume (K) Forecast, by Application 2020 & 2033
- Table 31: Global Biomedical High Entropy Alloys Revenue million Forecast, by Application 2020 & 2033
- Table 32: Global Biomedical High Entropy Alloys Volume K Forecast, by Application 2020 & 2033
- Table 33: Global Biomedical High Entropy Alloys Revenue million Forecast, by Type 2020 & 2033
- Table 34: Global Biomedical High Entropy Alloys Volume K Forecast, by Type 2020 & 2033
- Table 35: Global Biomedical High Entropy Alloys Revenue million Forecast, by Country 2020 & 2033
- Table 36: Global Biomedical High Entropy Alloys Volume K Forecast, by Country 2020 & 2033
- Table 37: United Kingdom Biomedical High Entropy Alloys Revenue (million) Forecast, by Application 2020 & 2033
- Table 38: United Kingdom Biomedical High Entropy Alloys Volume (K) Forecast, by Application 2020 & 2033
- Table 39: Germany Biomedical High Entropy Alloys Revenue (million) Forecast, by Application 2020 & 2033
- Table 40: Germany Biomedical High Entropy Alloys Volume (K) Forecast, by Application 2020 & 2033
- Table 41: France Biomedical High Entropy Alloys Revenue (million) Forecast, by Application 2020 & 2033
- Table 42: France Biomedical High Entropy Alloys Volume (K) Forecast, by Application 2020 & 2033
- Table 43: Italy Biomedical High Entropy Alloys Revenue (million) Forecast, by Application 2020 & 2033
- Table 44: Italy Biomedical High Entropy Alloys Volume (K) Forecast, by Application 2020 & 2033
- Table 45: Spain Biomedical High Entropy Alloys Revenue (million) Forecast, by Application 2020 & 2033
- Table 46: Spain Biomedical High Entropy Alloys Volume (K) Forecast, by Application 2020 & 2033
- Table 47: Russia Biomedical High Entropy Alloys Revenue (million) Forecast, by Application 2020 & 2033
- Table 48: Russia Biomedical High Entropy Alloys Volume (K) Forecast, by Application 2020 & 2033
- Table 49: Benelux Biomedical High Entropy Alloys Revenue (million) Forecast, by Application 2020 & 2033
- Table 50: Benelux Biomedical High Entropy Alloys Volume (K) Forecast, by Application 2020 & 2033
- Table 51: Nordics Biomedical High Entropy Alloys Revenue (million) Forecast, by Application 2020 & 2033
- Table 52: Nordics Biomedical High Entropy Alloys Volume (K) Forecast, by Application 2020 & 2033
- Table 53: Rest of Europe Biomedical High Entropy Alloys Revenue (million) Forecast, by Application 2020 & 2033
- Table 54: Rest of Europe Biomedical High Entropy Alloys Volume (K) Forecast, by Application 2020 & 2033
- Table 55: Global Biomedical High Entropy Alloys Revenue million Forecast, by Application 2020 & 2033
- Table 56: Global Biomedical High Entropy Alloys Volume K Forecast, by Application 2020 & 2033
- Table 57: Global Biomedical High Entropy Alloys Revenue million Forecast, by Type 2020 & 2033
- Table 58: Global Biomedical High Entropy Alloys Volume K Forecast, by Type 2020 & 2033
- Table 59: Global Biomedical High Entropy Alloys Revenue million Forecast, by Country 2020 & 2033
- Table 60: Global Biomedical High Entropy Alloys Volume K Forecast, by Country 2020 & 2033
- Table 61: Turkey Biomedical High Entropy Alloys Revenue (million) Forecast, by Application 2020 & 2033
- Table 62: Turkey Biomedical High Entropy Alloys Volume (K) Forecast, by Application 2020 & 2033
- Table 63: Israel Biomedical High Entropy Alloys Revenue (million) Forecast, by Application 2020 & 2033
- Table 64: Israel Biomedical High Entropy Alloys Volume (K) Forecast, by Application 2020 & 2033
- Table 65: GCC Biomedical High Entropy Alloys Revenue (million) Forecast, by Application 2020 & 2033
- Table 66: GCC Biomedical High Entropy Alloys Volume (K) Forecast, by Application 2020 & 2033
- Table 67: North Africa Biomedical High Entropy Alloys Revenue (million) Forecast, by Application 2020 & 2033
- Table 68: North Africa Biomedical High Entropy Alloys Volume (K) Forecast, by Application 2020 & 2033
- Table 69: South Africa Biomedical High Entropy Alloys Revenue (million) Forecast, by Application 2020 & 2033
- Table 70: South Africa Biomedical High Entropy Alloys Volume (K) Forecast, by Application 2020 & 2033
- Table 71: Rest of Middle East & Africa Biomedical High Entropy Alloys Revenue (million) Forecast, by Application 2020 & 2033
- Table 72: Rest of Middle East & Africa Biomedical High Entropy Alloys Volume (K) Forecast, by Application 2020 & 2033
- Table 73: Global Biomedical High Entropy Alloys Revenue million Forecast, by Application 2020 & 2033
- Table 74: Global Biomedical High Entropy Alloys Volume K Forecast, by Application 2020 & 2033
- Table 75: Global Biomedical High Entropy Alloys Revenue million Forecast, by Type 2020 & 2033
- Table 76: Global Biomedical High Entropy Alloys Volume K Forecast, by Type 2020 & 2033
- Table 77: Global Biomedical High Entropy Alloys Revenue million Forecast, by Country 2020 & 2033
- Table 78: Global Biomedical High Entropy Alloys Volume K Forecast, by Country 2020 & 2033
- Table 79: China Biomedical High Entropy Alloys Revenue (million) Forecast, by Application 2020 & 2033
- Table 80: China Biomedical High Entropy Alloys Volume (K) Forecast, by Application 2020 & 2033
- Table 81: India Biomedical High Entropy Alloys Revenue (million) Forecast, by Application 2020 & 2033
- Table 82: India Biomedical High Entropy Alloys Volume (K) Forecast, by Application 2020 & 2033
- Table 83: Japan Biomedical High Entropy Alloys Revenue (million) Forecast, by Application 2020 & 2033
- Table 84: Japan Biomedical High Entropy Alloys Volume (K) Forecast, by Application 2020 & 2033
- Table 85: South Korea Biomedical High Entropy Alloys Revenue (million) Forecast, by Application 2020 & 2033
- Table 86: South Korea Biomedical High Entropy Alloys Volume (K) Forecast, by Application 2020 & 2033
- Table 87: ASEAN Biomedical High Entropy Alloys Revenue (million) Forecast, by Application 2020 & 2033
- Table 88: ASEAN Biomedical High Entropy Alloys Volume (K) Forecast, by Application 2020 & 2033
- Table 89: Oceania Biomedical High Entropy Alloys Revenue (million) Forecast, by Application 2020 & 2033
- Table 90: Oceania Biomedical High Entropy Alloys Volume (K) Forecast, by Application 2020 & 2033
- Table 91: Rest of Asia Pacific Biomedical High Entropy Alloys Revenue (million) Forecast, by Application 2020 & 2033
- Table 92: Rest of Asia Pacific Biomedical High Entropy Alloys Volume (K) Forecast, by Application 2020 & 2033
Frequently Asked Questions
1. What is the projected Compound Annual Growth Rate (CAGR) of the Biomedical High Entropy Alloys?
The projected CAGR is approximately 22.9%.
2. Which companies are prominent players in the Biomedical High Entropy Alloys?
Key companies in the market include Heeger Materials, Alloyed, Oerlikon, Beijing Yijin New Material Technology Co., Ltd., Beijing Crigoo Materials Technology Co, Ltd., Beijing High Entropy Alloy New Material Technology Co., Ltd., Beijing Yanbang New Material Technology Co., Ltd., Shanghai Truer, Metalysis, Stanford Advanced Materials, ATT Advanced Elemental Materials Co., Ltd., Jiangxi Yongtai Powder Metallurgy Co., Ltd., STARDUST, GREES (BEIJING) NEW MATERIAL TECHNOLOGY CO., LTD., Beijing Ruichi High-tech Co., Ltd..
3. What are the main segments of the Biomedical High Entropy Alloys?
The market segments include Application, Type.
4. Can you provide details about the market size?
The market size is estimated to be USD 65.3 million as of 2022.
5. What are some drivers contributing to market growth?
N/A
6. What are the notable trends driving market growth?
N/A
7. Are there any restraints impacting market growth?
N/A
8. Can you provide examples of recent developments in the market?
N/A
9. What pricing options are available for accessing the report?
Pricing options include single-user, multi-user, and enterprise licenses priced at USD 3950.00, USD 5925.00, and USD 7900.00 respectively.
10. Is the market size provided in terms of value or volume?
The market size is provided in terms of value, measured in million and volume, measured in K.
11. Are there any specific market keywords associated with the report?
Yes, the market keyword associated with the report is "Biomedical High Entropy Alloys," which aids in identifying and referencing the specific market segment covered.
12. How do I determine which pricing option suits my needs best?
The pricing options vary based on user requirements and access needs. Individual users may opt for single-user licenses, while businesses requiring broader access may choose multi-user or enterprise licenses for cost-effective access to the report.
13. Are there any additional resources or data provided in the Biomedical High Entropy Alloys report?
While the report offers comprehensive insights, it's advisable to review the specific contents or supplementary materials provided to ascertain if additional resources or data are available.
14. How can I stay updated on further developments or reports in the Biomedical High Entropy Alloys?
To stay informed about further developments, trends, and reports in the Biomedical High Entropy Alloys, consider subscribing to industry newsletters, following relevant companies and organizations, or regularly checking reputable industry news sources and publications.
Methodology
Step 1 - Identification of Relevant Samples Size from Population Database


Step 2 - Approaches for Defining Global Market Size (Value, Volume* & Price*)

Note*: In applicable scenarios
Step 3 - Data Sources
Primary Research
- Web Analytics
- Survey Reports
- Research Institute
- Latest Research Reports
- Opinion Leaders
Secondary Research
- Annual Reports
- White Paper
- Latest Press Release
- Industry Association
- Paid Database
- Investor Presentations

Step 4 - Data Triangulation
Involves using different sources of information in order to increase the validity of a study
These sources are likely to be stakeholders in a program - participants, other researchers, program staff, other community members, and so on.
Then we put all data in single framework & apply various statistical tools to find out the dynamic on the market.
During the analysis stage, feedback from the stakeholder groups would be compared to determine areas of agreement as well as areas of divergence