

Key Insights
The global Biosolids market is poised for significant expansion, with a current estimated market size of $1700 million. Projections indicate a robust Compound Annual Growth Rate (CAGR) exceeding 3.50% over the forecast period of 2025-2033. This growth is underpinned by a confluence of compelling drivers, including the increasing global focus on sustainable waste management and the inherent value of biosolids as a nutrient-rich resource for land application. The rising demand for organic fertilizers in agriculture, driven by the need for enhanced crop yields and soil health, further fuels this upward trajectory. Furthermore, the expanding applications in non-agricultural sectors, such as land reclamation, forestry, and even energy recovery through incineration and gasification, are diversifying revenue streams and contributing to market vitality. The market is segmented by type into Class A, Class A EQ (Exceptional Quality), and Class B biosolids, each catering to specific regulatory and application requirements.
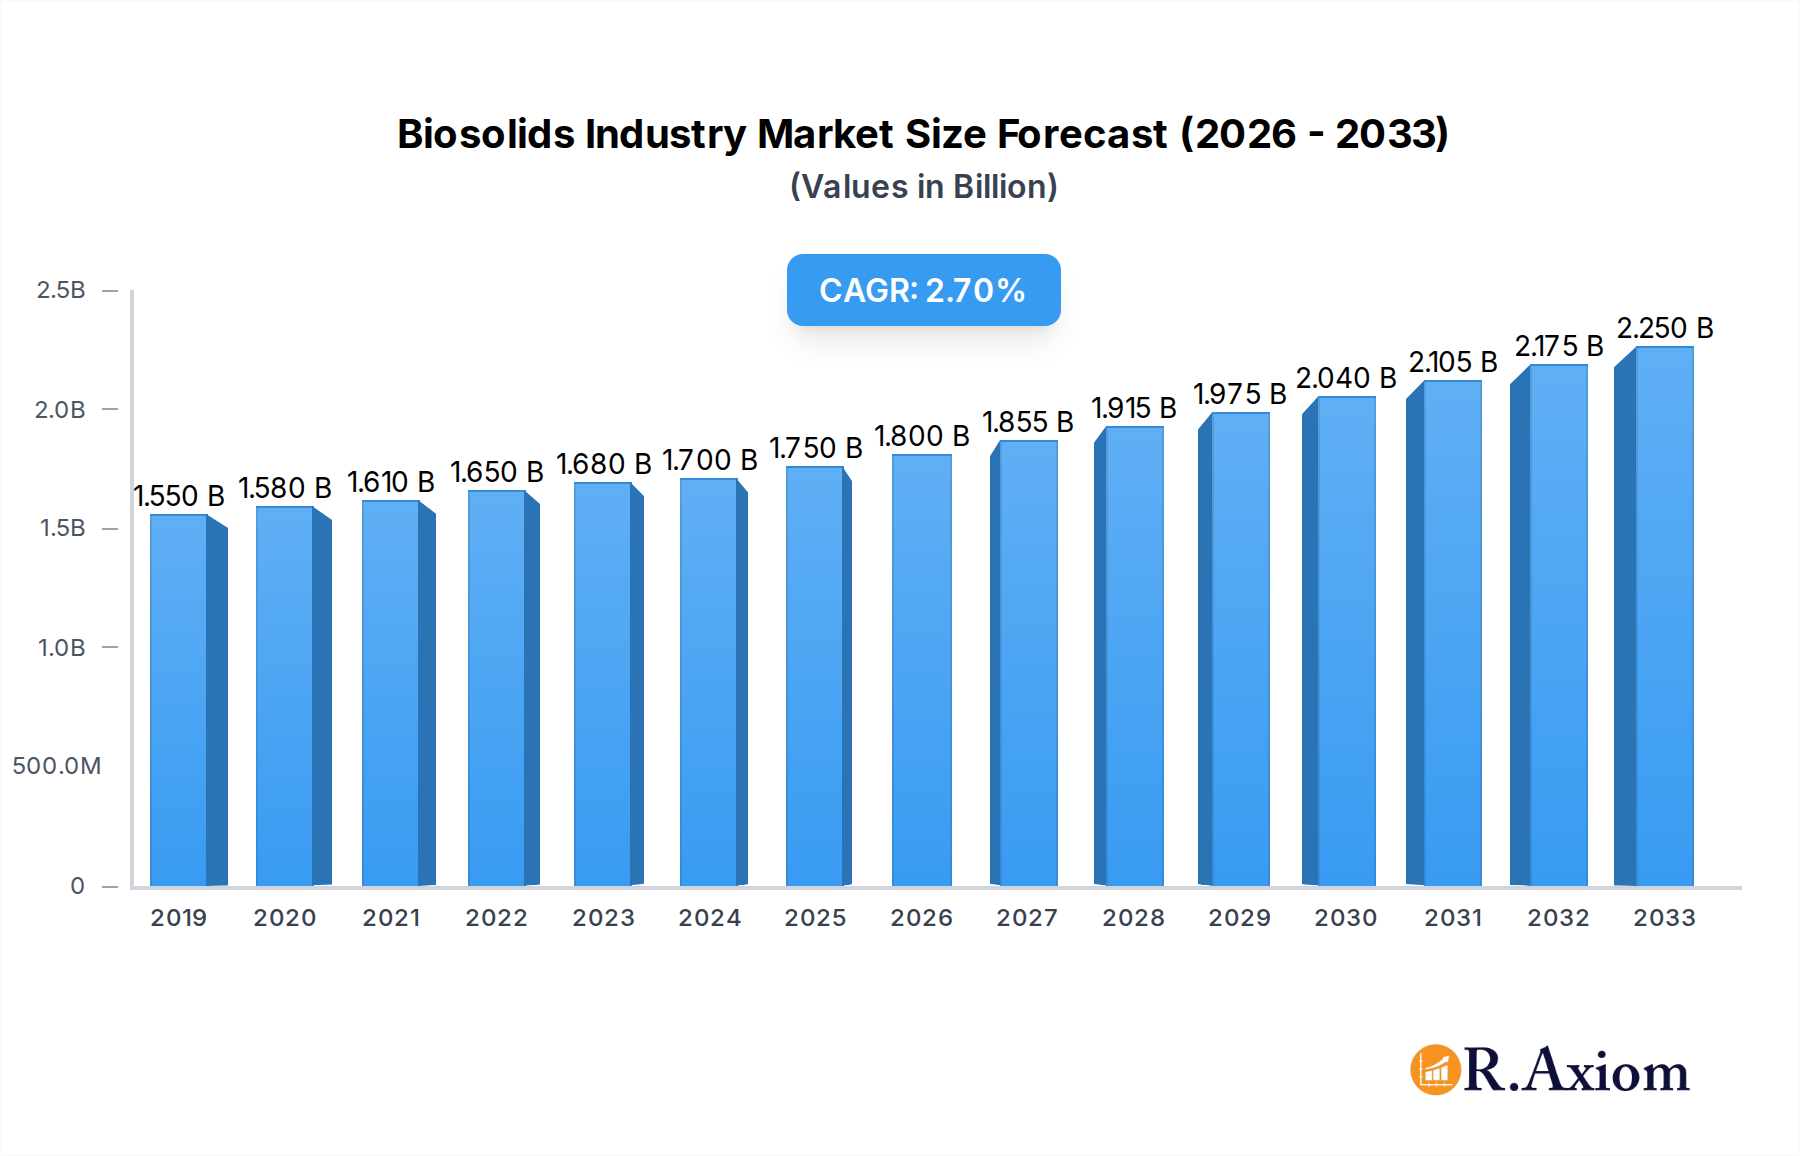
Biosolids Industry Market Size (In Billion)
The market's dynamism is also shaped by key trends, notably the technological advancements in biosolids treatment and processing, leading to safer and more versatile end-products. The growing adoption of circular economy principles, where waste is transformed into valuable resources, is a significant tailwind. However, challenges such as stringent regulatory frameworks governing land application, public perception, and the cost associated with advanced treatment processes present discernible restraints. Despite these hurdles, the expanding geographical reach, particularly in the Asia Pacific and North America regions, coupled with innovations in energy recovery from biosolids, are expected to sustain the market's impressive growth momentum. Companies are actively investing in research and development to overcome these restraints and capitalize on emerging opportunities.

Biosolids Industry Company Market Share
This comprehensive report delves into the dynamic Biosolids Industry, providing in-depth analysis, market forecasts, and strategic insights for stakeholders. Covering the period from 2019 to 2033, with a base year of 2025, this study offers a detailed examination of market concentration, innovation drivers, regulatory frameworks, product substitutes, end-user trends, mergers and acquisitions, industry trends, dominant markets and segments, product developments, key growth drivers, sector challenges, emerging opportunities, leading players, and strategic outlook. With an estimated market size of $55,000 Million in 2025, the Biosolids Industry is projected to grow at a Compound Annual Growth Rate (CAGR) of 6.5% from 2025 to 2033, reaching an estimated $90,000 Million by 2033. This report leverages high-traffic keywords such as "biosolids management," "wastewater treatment," "fertilizer production," "renewable energy," "circular economy," and "sustainable waste management" to enhance search visibility and engage industry professionals.
Biosolids Industry Market Concentration & Innovation
The Biosolids Industry exhibits a moderate level of market concentration, with a few major players holding significant market share in specific regions and application segments. Key companies like Synagro Technologies, REMONDIS SE & Co KG, and Cleanaway are pivotal in driving market consolidation through strategic acquisitions and expansions. The market share of leading players is estimated to be 25% combined. Innovation is primarily driven by advancements in processing technologies, such as thermal hydrolysis, which enhance the quality and applicability of biosolids, and the increasing demand for nutrient-rich fertilizers and renewable energy sources. Regulatory frameworks, particularly those focused on environmental protection and resource recovery, play a crucial role in shaping innovation and market dynamics. Product substitutes, including synthetic fertilizers and alternative waste-to-energy solutions, present a competitive landscape, but the unique nutrient profile and cost-effectiveness of biosolids continue to drive their adoption. End-user trends lean towards sustainable agricultural practices and the development of the circular economy, where waste streams are transformed into valuable resources. Mergers and acquisition activities are a significant feature, with recent deal values reaching an estimated $1,200 Million, indicating a trend towards consolidation and expansion of service offerings.
Biosolids Industry Industry Trends & Insights
The Biosolids Industry is experiencing robust growth, fueled by several interconnected trends. The increasing global population and urbanization lead to higher volumes of wastewater, consequently generating more biosolids. This escalating supply presents both a challenge and an opportunity for effective management and resource recovery. Environmental regulations are becoming increasingly stringent worldwide, mandating safer and more sustainable disposal and utilization methods for biosolids, thereby driving demand for advanced treatment technologies and beneficial reuse applications. The growing emphasis on the circular economy and sustainable resource management is a primary growth catalyst. Biosolids, rich in essential nutrients like nitrogen and phosphorus, are recognized as valuable organic fertilizers, reducing the reliance on synthetic alternatives and promoting soil health in agriculture. Furthermore, the potential for energy recovery from biosolids through processes like anaerobic digestion, incineration, and gasification aligns with the global push towards renewable energy sources. The market penetration for Class A and Class A EQ (Exceptional Quality) biosolids is steadily increasing due to their higher safety standards and broader application possibilities. Technological advancements, including enhanced dewatering, drying, and pathogen reduction techniques, are improving the quality and marketability of biosolids. Consumer preferences are shifting towards organically produced food and environmentally conscious practices, which indirectly supports the demand for biosolids in agriculture. The competitive landscape is evolving with new entrants and the expansion of existing players into new geographical markets. The overall market is projected to grow at a CAGR of 6.5%.
Dominant Markets & Segments in Biosolids Industry
The Biosolids Industry is characterized by dominant markets and segments that are driven by specific regional needs, regulatory environments, and application demands.
Dominant Application: Agriculture Land Application
- Fertilizer: This segment is a cornerstone of the Biosolids Industry, driven by the increasing demand for sustainable and cost-effective fertilizers. Biosolids provide essential macro and micronutrients, improving soil structure and fertility, leading to enhanced crop yields. Economic policies favoring organic farming and reduced reliance on synthetic fertilizers further bolster this segment.
- Fertilizer for Animal Crop Production - Pastures: The application of biosolids as fertilizer for pastures is a significant sub-segment, supporting livestock farming by improving the nutritional quality and growth of forage. This application is particularly strong in regions with extensive agricultural and grazing lands.
Emerging Application: Non-agricultural Land Application
- Forest Crops (Land Restoration and Forestry): Biosolids are increasingly utilized for forest restoration and afforestation projects. Their nutrient content aids in the establishment and growth of trees, particularly in degraded or logged areas, contributing to carbon sequestration and biodiversity.
- Land Reclamation (Roads and Urban Wetlands): The use of biosolids in the rehabilitation of land affected by industrial activities, infrastructure development, and the creation of urban wetlands is gaining traction. They help stabilize soil, prevent erosion, and establish vegetation in challenging environments.
- Reclaiming Mining Sites: Biosolids play a crucial role in the ecological restoration of former mining sites, transforming barren landscapes into vegetated areas, thereby mitigating environmental impact.
- Landscaping, Recreational Fields, and Domestic Use: The application of treated biosolids in landscaping projects, the maintenance of sports fields, and for domestic gardening purposes is growing, driven by aesthetic and environmental considerations.
Growing Segment: Energy Recovery Energy Production
- Heat Generation, Incineration, and Gasification: This segment represents a significant growth area, driven by the dual benefits of waste reduction and renewable energy generation. Thermal treatment processes like incineration and gasification convert biosolids into energy, reducing landfill volumes and contributing to the energy mix.
- Oil and Cement Production: Emerging technologies are exploring the conversion of biosolids into valuable by-products such as oil and cement additives, further enhancing their resource recovery potential.
- Commercial Uses: The broader commercialization of biosolids-derived products and energy is a key trend, creating new revenue streams and fostering a more robust circular economy.
The dominance of agriculture land application stems from its established infrastructure and proven benefits. However, the Non-agricultural Land Application and Energy Recovery segments are exhibiting higher growth rates due to evolving environmental regulations and the increasing need for sustainable solutions in diverse sectors.
Biosolids Industry Product Developments
Recent product developments in the Biosolids Industry are focused on enhancing the quality, safety, and utility of biosolids. Innovations in thermal hydrolysis, such as those being implemented by Cambi ASA, are yielding Class A EQ biosolids with significantly reduced pathogen content and improved dewatering characteristics. These advancements enable broader application in agriculture and non-agricultural settings. Companies like Lystek International are developing proprietary processes to create nutrient-rich biofertilizers and soil amendments that offer competitive advantages over traditional products. The focus is on creating value-added products that meet stringent environmental standards and cater to the growing demand for sustainable solutions in agriculture and land management.
Report Scope & Segmentation Analysis
This report meticulously analyzes the Biosolids Industry across key segmentation criteria. The Type segmentation includes Class A, Class A EQ (Exceptional Quality), and Class B biosolids, with Class A and Class A EQ showing higher growth potential due to their favorable regulatory status and broader applicability. In terms of Form, Cakes, Liquid, and Pellet biosolids are evaluated. Pellets, offering ease of handling and application, are witnessing increased adoption. The Application segmentation is critically examined, encompassing Agriculture land Application (Fertilizer, Fertilizer for Animal Crop Production - Pastures) and Non-agricultural Land Application (Forest Crops, Land Reclamation, Reclaiming Mining Sites, Landscaping, Recreational Fields, and Domestic Use). The Energy Recovery segment, including Heat Generation, Incineration, and Gasification, as well as Oil and Cement Production, and Commercial Uses, represents a rapidly expanding frontier. Market sizes for each segment are projected, with significant growth anticipated in Non-agricultural Land Application and Energy Recovery due to increasing environmental consciousness and regulatory drivers.
Key Drivers of Biosolids Industry Growth
The Biosolids Industry's growth is propelled by a confluence of technological, economic, and regulatory factors. The increasing stringency of environmental regulations worldwide mandates the responsible management and beneficial reuse of biosolids, fostering innovation in treatment and application technologies. Economic drivers include the rising cost of synthetic fertilizers, making nutrient-rich biosolids a more attractive and cost-effective alternative for agricultural applications. The global push towards a circular economy and sustainable resource management further amplifies the demand for biosolids as a valuable input for soil amendment and energy production. For instance, government incentives for renewable energy projects encourage the development of anaerobic digestion facilities that utilize biosolids.
Challenges in the Biosolids Industry Sector
Despite its promising growth, the Biosolids Industry faces several challenges. Regulatory hurdles, including varying standards for pathogen reduction and land application across different regions, can complicate market access and investment. Supply chain complexities, particularly in transporting treated biosolids to end-users, can impact cost-effectiveness and logistical efficiency. Public perception and potential concerns regarding the safety and quality of biosolids can also act as a restraint, though advancements in treatment technologies are steadily mitigating these issues. Furthermore, the competitive pressure from alternative fertilizer sources and waste management solutions necessitates continuous innovation and market development.
Emerging Opportunities in Biosolids Industry
The Biosolids Industry is ripe with emerging opportunities. The development of advanced processing technologies, such as advanced anaerobic digestion and pyrolysis, offers enhanced energy recovery and the production of higher-value co-products. The growing demand for organic and sustainable agricultural practices presents a significant opportunity for biosolids-based fertilizers. Furthermore, the increasing focus on land restoration and remediation in industrial and mining areas opens new avenues for non-agricultural land application. The concept of industrial symbiosis, where biosolids from one industry become a resource for another, is a burgeoning area for growth.
Leading Players in the Biosolids Industry Market
- Walker Industries
- Cambi ASA
- Eco-trass
- DC Water
- Recyc Systems Inc
- BCR Environmental
- Aguas Andinas SA
- Cleanaway
- SYLVIS
- Casella Waste Systems Inc
- Englobe
- Agrivert Ltd
- Saur
- Alan Srl
- Lystek International
- REMONDIS SE & Co KG
- FCC Group
- Synagro Technologies
- C R E - Centro di Ricerche Ecologiche
- Parker Ag Services LLC
- Terrapure BR Ltd
- Merrell Bros Inc
- Allevi Srl
Key Developments in Biosolids Industry Industry
- January 2023: Synagro Technologies Inc., a provider of biosolids and residual solutions, acquired Burch Hydro Inc., an Ohio-based premier provider of biosolids and lime-residuals management and land application. This acquisition strengthens Synagro's market position and expands its service capabilities.
- November 2022: The San Francisco Public Utilities Commission (SFPUC) and Cambi announced an agreement for the installation of three thermal hydrolysis systems as part of the Biosolids Digester Facilities Project at the Southeast Treatment Plant in San Francisco. The SFPUC is investing over USD 3 billion to upgrade and modernize the Southeast Treatment Plant, the city's largest wastewater treatment facility. This project is part of a more extensive citywide Sewer System Improvement Program, highlighting a significant investment in advanced biosolids treatment for enhanced resource recovery.
Strategic Outlook for Biosolids Industry Market
The strategic outlook for the Biosolids Industry is overwhelmingly positive, driven by a global paradigm shift towards sustainable resource management and the circular economy. Continued investment in advanced treatment technologies, particularly those that enhance energy recovery and produce high-quality soil amendments, will be crucial. Collaboration between wastewater treatment facilities, technology providers, agricultural stakeholders, and regulatory bodies will foster market growth and address existing challenges. The increasing recognition of biosolids as a valuable resource rather than a waste product is set to unlock significant market potential, leading to greater economic and environmental benefits. The strategic expansion of services into new geographical regions and the development of novel commercial applications will further solidify the industry's robust growth trajectory.
Biosolids Industry Segmentation
-
1. Type
- 1.1. Class A
- 1.2. Class A EQ (Exceptional Quality)
- 1.3. Class B
-
2. Form
- 2.1. Cakes
- 2.2. Liquid
- 2.3. Pellet
-
3. Application
-
3.1. Agriculture land Application
- 3.1.1. Fertiliz
- 3.1.2. Fertilizer for Animal Crop Production - Pastures
-
3.2. Non-agricultural Land Application
- 3.2.1. Forest Crops (Land Restoration and Forestry)
- 3.2.2. Land Reclamation (Roads and Urban Wetlands)
- 3.2.3. Reclaiming Mining Sites
- 3.2.4. Landscaping, Recreational Fields, and Domestic Use
-
3.3. Energy Recovery Energy Production
- 3.3.1. Heat Generation, Incineration, and Gasification
- 3.3.2. Oil and Cement Production
- 3.3.3. Commercial Uses
-
3.1. Agriculture land Application
Biosolids Industry Segmentation By Geography
-
1. Asia Pacific
- 1.1. China
- 1.2. India
- 1.3. Japan
- 1.4. South Korea
- 1.5. Malaysia
- 1.6. Thailand
- 1.7. Indonesia
- 1.8. Vietnam
- 1.9. Rest of Asia Pacific
-
2. North America
- 2.1. United States
- 2.2. Canada
- 2.3. Mexico
-
3. Europe
- 3.1. Germany
- 3.2. United Kingdom
- 3.3. Italy
- 3.4. France
- 3.5. Spain
- 3.6. NORDIC
- 3.7. Turkey
- 3.8. Russia
- 3.9. Rest of Europe
-
4. South America
- 4.1. Brazil
- 4.2. Argentina
- 4.3. Colombia
- 4.4. Rest of South America
-
5. Middle East and Africa
- 5.1. Saudi Arabia
- 5.2. South Africa
- 5.3. Nigeria
- 5.4. Qatar
- 5.5. Egypt
- 5.6. United Arab Emirates
- 5.7. Rest of Middle East and Africa
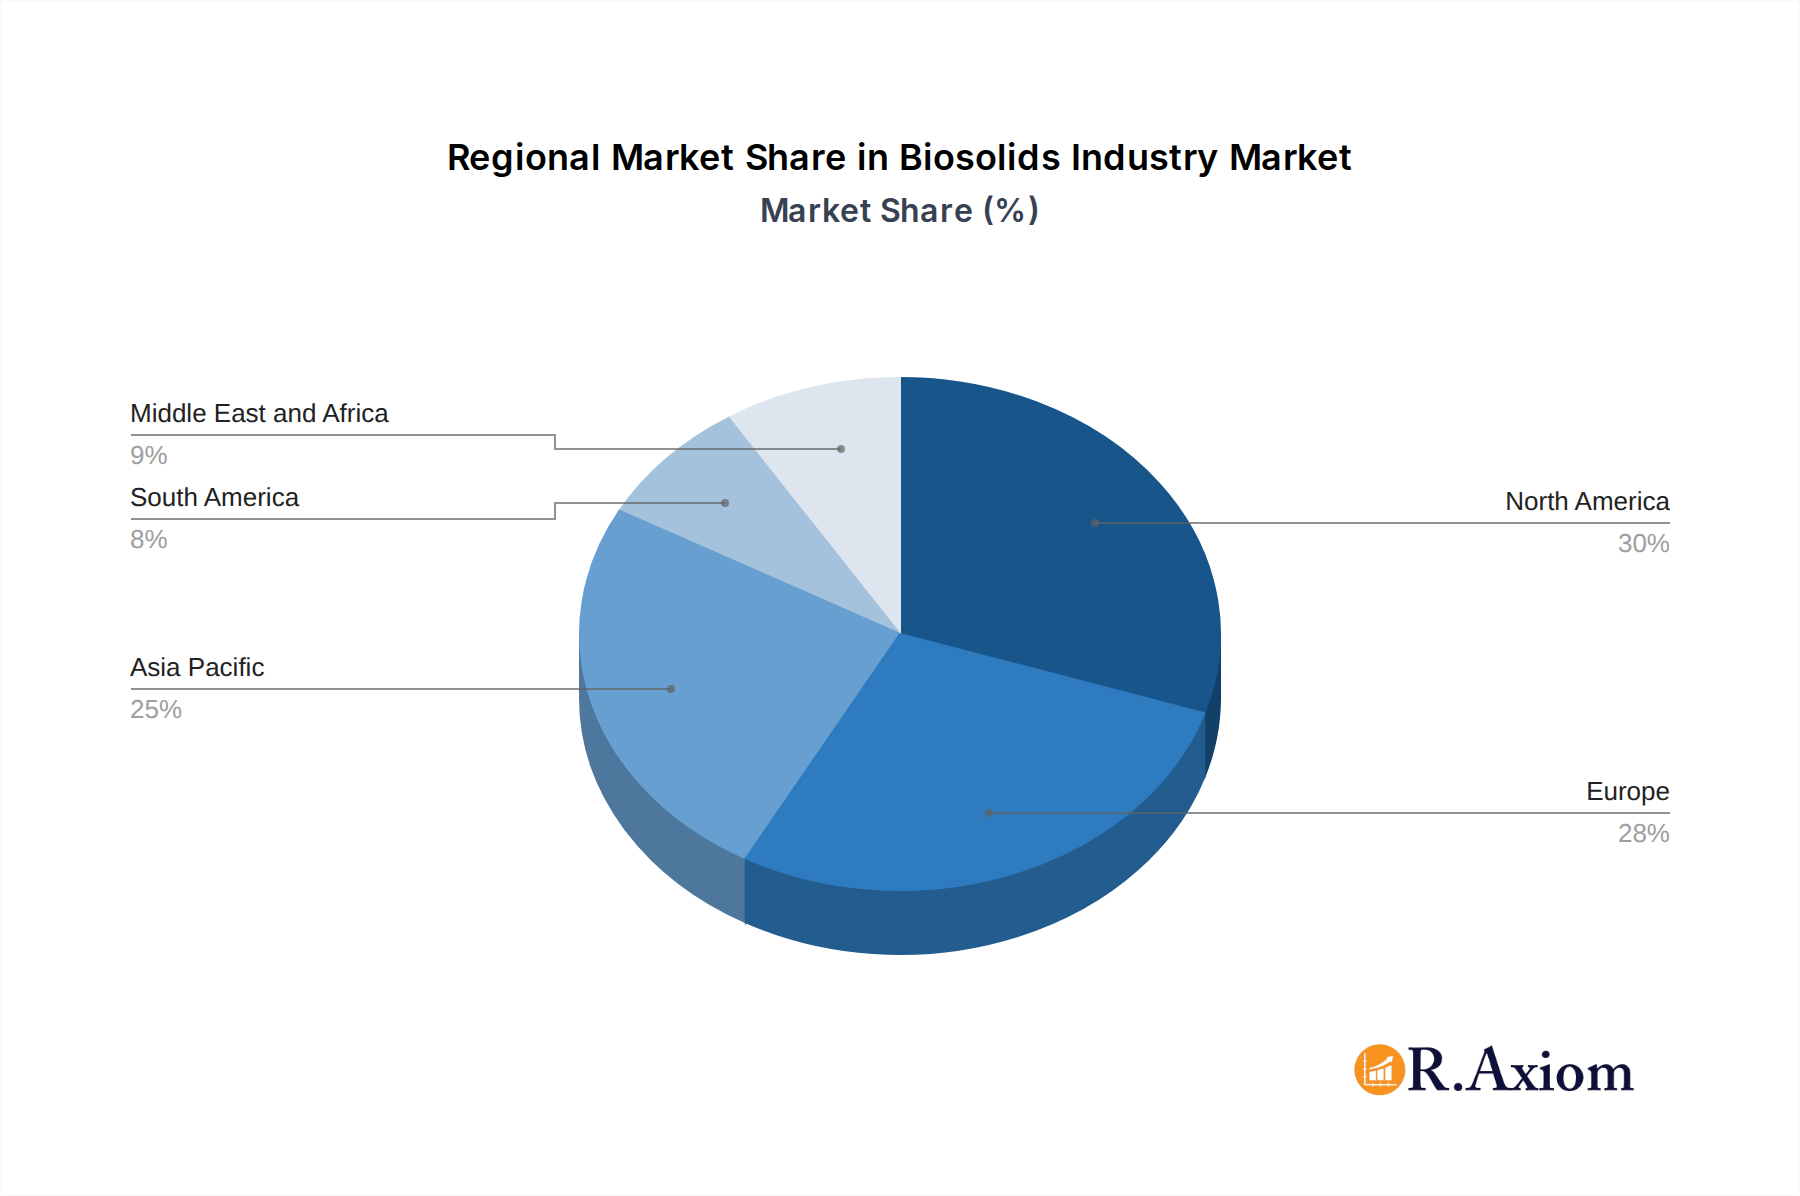
Biosolids Industry Regional Market Share
Geographic Coverage of Biosolids Industry
Biosolids Industry REPORT HIGHLIGHTS
| Aspects | Details |
|---|---|
| Study Period | 2020-2034 |
| Base Year | 2025 |
| Estimated Year | 2026 |
| Forecast Period | 2026-2034 |
| Historical Period | 2020-2025 |
| Growth Rate | CAGR of > 3.50% from 2020-2034 |
| Segmentation |
|
Table of Contents
- 1. Introduction
- 1.1. Research Scope
- 1.2. Market Segmentation
- 1.3. Research Objective
- 1.4. Definitions and Assumptions
- 2. Executive Summary
- 2.1. Market Snapshot
- 3. Market Dynamics
- 3.1. Market Drivers
- 3.2. Market Restrains
- 3.3. Market Trends
- 3.4. Market Opportunities
- 4. Market Factor Analysis
- 4.1. Porters Five Forces
- 4.1.1. Bargaining Power of Suppliers
- 4.1.2. Bargaining Power of Buyers
- 4.1.3. Threat of New Entrants
- 4.1.4. Threat of Substitutes
- 4.1.5. Competitive Rivalry
- 4.2. PESTEL analysis
- 4.3. BCG Analysis
- 4.3.1. Stars (High Growth, High Market Share)
- 4.3.2. Cash Cows (Low Growth, High Market Share)
- 4.3.3. Question Mark (High Growth, Low Market Share)
- 4.3.4. Dogs (Low Growth, Low Market Share)
- 4.4. Ansoff Matrix Analysis
- 4.5. Supply Chain Analysis
- 4.6. Regulatory Landscape
- 4.7. Current Market Potential and Opportunity Assessment (TAM–SAM–SOM Framework)
- 4.8. RAX Analyst Note
- 4.1. Porters Five Forces
- 5. Market Analysis, Insights and Forecast 2021-2033
- 5.1. Market Analysis, Insights and Forecast - by Type
- 5.1.1. Class A
- 5.1.2. Class A EQ (Exceptional Quality)
- 5.1.3. Class B
- 5.2. Market Analysis, Insights and Forecast - by Form
- 5.2.1. Cakes
- 5.2.2. Liquid
- 5.2.3. Pellet
- 5.3. Market Analysis, Insights and Forecast - by Application
- 5.3.1. Agriculture land Application
- 5.3.1.1. Fertiliz
- 5.3.1.2. Fertilizer for Animal Crop Production - Pastures
- 5.3.2. Non-agricultural Land Application
- 5.3.2.1. Forest Crops (Land Restoration and Forestry)
- 5.3.2.2. Land Reclamation (Roads and Urban Wetlands)
- 5.3.2.3. Reclaiming Mining Sites
- 5.3.2.4. Landscaping, Recreational Fields, and Domestic Use
- 5.3.3. Energy Recovery Energy Production
- 5.3.3.1. Heat Generation, Incineration, and Gasification
- 5.3.3.2. Oil and Cement Production
- 5.3.3.3. Commercial Uses
- 5.3.1. Agriculture land Application
- 5.4. Market Analysis, Insights and Forecast - by Region
- 5.4.1. Asia Pacific
- 5.4.2. North America
- 5.4.3. Europe
- 5.4.4. South America
- 5.4.5. Middle East and Africa
- 5.1. Market Analysis, Insights and Forecast - by Type
- 6. Global Biosolids Industry Analysis, Insights and Forecast, 2021-2033
- 6.1. Market Analysis, Insights and Forecast - by Type
- 6.1.1. Class A
- 6.1.2. Class A EQ (Exceptional Quality)
- 6.1.3. Class B
- 6.2. Market Analysis, Insights and Forecast - by Form
- 6.2.1. Cakes
- 6.2.2. Liquid
- 6.2.3. Pellet
- 6.3. Market Analysis, Insights and Forecast - by Application
- 6.3.1. Agriculture land Application
- 6.3.1.1. Fertiliz
- 6.3.1.2. Fertilizer for Animal Crop Production - Pastures
- 6.3.2. Non-agricultural Land Application
- 6.3.2.1. Forest Crops (Land Restoration and Forestry)
- 6.3.2.2. Land Reclamation (Roads and Urban Wetlands)
- 6.3.2.3. Reclaiming Mining Sites
- 6.3.2.4. Landscaping, Recreational Fields, and Domestic Use
- 6.3.3. Energy Recovery Energy Production
- 6.3.3.1. Heat Generation, Incineration, and Gasification
- 6.3.3.2. Oil and Cement Production
- 6.3.3.3. Commercial Uses
- 6.3.1. Agriculture land Application
- 6.1. Market Analysis, Insights and Forecast - by Type
- 7. Asia Pacific Biosolids Industry Analysis, Insights and Forecast, 2020-2032
- 7.1. Market Analysis, Insights and Forecast - by Type
- 7.1.1. Class A
- 7.1.2. Class A EQ (Exceptional Quality)
- 7.1.3. Class B
- 7.2. Market Analysis, Insights and Forecast - by Form
- 7.2.1. Cakes
- 7.2.2. Liquid
- 7.2.3. Pellet
- 7.3. Market Analysis, Insights and Forecast - by Application
- 7.3.1. Agriculture land Application
- 7.3.1.1. Fertiliz
- 7.3.1.2. Fertilizer for Animal Crop Production - Pastures
- 7.3.2. Non-agricultural Land Application
- 7.3.2.1. Forest Crops (Land Restoration and Forestry)
- 7.3.2.2. Land Reclamation (Roads and Urban Wetlands)
- 7.3.2.3. Reclaiming Mining Sites
- 7.3.2.4. Landscaping, Recreational Fields, and Domestic Use
- 7.3.3. Energy Recovery Energy Production
- 7.3.3.1. Heat Generation, Incineration, and Gasification
- 7.3.3.2. Oil and Cement Production
- 7.3.3.3. Commercial Uses
- 7.3.1. Agriculture land Application
- 7.1. Market Analysis, Insights and Forecast - by Type
- 8. North America Biosolids Industry Analysis, Insights and Forecast, 2020-2032
- 8.1. Market Analysis, Insights and Forecast - by Type
- 8.1.1. Class A
- 8.1.2. Class A EQ (Exceptional Quality)
- 8.1.3. Class B
- 8.2. Market Analysis, Insights and Forecast - by Form
- 8.2.1. Cakes
- 8.2.2. Liquid
- 8.2.3. Pellet
- 8.3. Market Analysis, Insights and Forecast - by Application
- 8.3.1. Agriculture land Application
- 8.3.1.1. Fertiliz
- 8.3.1.2. Fertilizer for Animal Crop Production - Pastures
- 8.3.2. Non-agricultural Land Application
- 8.3.2.1. Forest Crops (Land Restoration and Forestry)
- 8.3.2.2. Land Reclamation (Roads and Urban Wetlands)
- 8.3.2.3. Reclaiming Mining Sites
- 8.3.2.4. Landscaping, Recreational Fields, and Domestic Use
- 8.3.3. Energy Recovery Energy Production
- 8.3.3.1. Heat Generation, Incineration, and Gasification
- 8.3.3.2. Oil and Cement Production
- 8.3.3.3. Commercial Uses
- 8.3.1. Agriculture land Application
- 8.1. Market Analysis, Insights and Forecast - by Type
- 9. Europe Biosolids Industry Analysis, Insights and Forecast, 2020-2032
- 9.1. Market Analysis, Insights and Forecast - by Type
- 9.1.1. Class A
- 9.1.2. Class A EQ (Exceptional Quality)
- 9.1.3. Class B
- 9.2. Market Analysis, Insights and Forecast - by Form
- 9.2.1. Cakes
- 9.2.2. Liquid
- 9.2.3. Pellet
- 9.3. Market Analysis, Insights and Forecast - by Application
- 9.3.1. Agriculture land Application
- 9.3.1.1. Fertiliz
- 9.3.1.2. Fertilizer for Animal Crop Production - Pastures
- 9.3.2. Non-agricultural Land Application
- 9.3.2.1. Forest Crops (Land Restoration and Forestry)
- 9.3.2.2. Land Reclamation (Roads and Urban Wetlands)
- 9.3.2.3. Reclaiming Mining Sites
- 9.3.2.4. Landscaping, Recreational Fields, and Domestic Use
- 9.3.3. Energy Recovery Energy Production
- 9.3.3.1. Heat Generation, Incineration, and Gasification
- 9.3.3.2. Oil and Cement Production
- 9.3.3.3. Commercial Uses
- 9.3.1. Agriculture land Application
- 9.1. Market Analysis, Insights and Forecast - by Type
- 10. South America Biosolids Industry Analysis, Insights and Forecast, 2020-2032
- 10.1. Market Analysis, Insights and Forecast - by Type
- 10.1.1. Class A
- 10.1.2. Class A EQ (Exceptional Quality)
- 10.1.3. Class B
- 10.2. Market Analysis, Insights and Forecast - by Form
- 10.2.1. Cakes
- 10.2.2. Liquid
- 10.2.3. Pellet
- 10.3. Market Analysis, Insights and Forecast - by Application
- 10.3.1. Agriculture land Application
- 10.3.1.1. Fertiliz
- 10.3.1.2. Fertilizer for Animal Crop Production - Pastures
- 10.3.2. Non-agricultural Land Application
- 10.3.2.1. Forest Crops (Land Restoration and Forestry)
- 10.3.2.2. Land Reclamation (Roads and Urban Wetlands)
- 10.3.2.3. Reclaiming Mining Sites
- 10.3.2.4. Landscaping, Recreational Fields, and Domestic Use
- 10.3.3. Energy Recovery Energy Production
- 10.3.3.1. Heat Generation, Incineration, and Gasification
- 10.3.3.2. Oil and Cement Production
- 10.3.3.3. Commercial Uses
- 10.3.1. Agriculture land Application
- 10.1. Market Analysis, Insights and Forecast - by Type
- 11. Middle East and Africa Biosolids Industry Analysis, Insights and Forecast, 2020-2032
- 11.1. Market Analysis, Insights and Forecast - by Type
- 11.1.1. Class A
- 11.1.2. Class A EQ (Exceptional Quality)
- 11.1.3. Class B
- 11.2. Market Analysis, Insights and Forecast - by Form
- 11.2.1. Cakes
- 11.2.2. Liquid
- 11.2.3. Pellet
- 11.3. Market Analysis, Insights and Forecast - by Application
- 11.3.1. Agriculture land Application
- 11.3.1.1. Fertiliz
- 11.3.1.2. Fertilizer for Animal Crop Production - Pastures
- 11.3.2. Non-agricultural Land Application
- 11.3.2.1. Forest Crops (Land Restoration and Forestry)
- 11.3.2.2. Land Reclamation (Roads and Urban Wetlands)
- 11.3.2.3. Reclaiming Mining Sites
- 11.3.2.4. Landscaping, Recreational Fields, and Domestic Use
- 11.3.3. Energy Recovery Energy Production
- 11.3.3.1. Heat Generation, Incineration, and Gasification
- 11.3.3.2. Oil and Cement Production
- 11.3.3.3. Commercial Uses
- 11.3.1. Agriculture land Application
- 11.1. Market Analysis, Insights and Forecast - by Type
- 12. Competitive Analysis
- 12.1. Company Profiles
- 12.1.1 Walker Industries*List Not Exhaustive
- 12.1.1.1. Company Overview
- 12.1.1.2. Products
- 12.1.1.3. Company Financials
- 12.1.1.4. SWOT Analysis
- 12.1.2 Cambi ASA
- 12.1.2.1. Company Overview
- 12.1.2.2. Products
- 12.1.2.3. Company Financials
- 12.1.2.4. SWOT Analysis
- 12.1.3 Eco-trass
- 12.1.3.1. Company Overview
- 12.1.3.2. Products
- 12.1.3.3. Company Financials
- 12.1.3.4. SWOT Analysis
- 12.1.4 DC Water
- 12.1.4.1. Company Overview
- 12.1.4.2. Products
- 12.1.4.3. Company Financials
- 12.1.4.4. SWOT Analysis
- 12.1.5 Recyc Systems Inc
- 12.1.5.1. Company Overview
- 12.1.5.2. Products
- 12.1.5.3. Company Financials
- 12.1.5.4. SWOT Analysis
- 12.1.6 BCR Environmental
- 12.1.6.1. Company Overview
- 12.1.6.2. Products
- 12.1.6.3. Company Financials
- 12.1.6.4. SWOT Analysis
- 12.1.7 Aguas Andinas SA
- 12.1.7.1. Company Overview
- 12.1.7.2. Products
- 12.1.7.3. Company Financials
- 12.1.7.4. SWOT Analysis
- 12.1.8 Cleanaway
- 12.1.8.1. Company Overview
- 12.1.8.2. Products
- 12.1.8.3. Company Financials
- 12.1.8.4. SWOT Analysis
- 12.1.9 SYLVIS
- 12.1.9.1. Company Overview
- 12.1.9.2. Products
- 12.1.9.3. Company Financials
- 12.1.9.4. SWOT Analysis
- 12.1.10 Casella Waste Systems Inc
- 12.1.10.1. Company Overview
- 12.1.10.2. Products
- 12.1.10.3. Company Financials
- 12.1.10.4. SWOT Analysis
- 12.1.11 Englobe
- 12.1.11.1. Company Overview
- 12.1.11.2. Products
- 12.1.11.3. Company Financials
- 12.1.11.4. SWOT Analysis
- 12.1.12 Agrivert Ltd
- 12.1.12.1. Company Overview
- 12.1.12.2. Products
- 12.1.12.3. Company Financials
- 12.1.12.4. SWOT Analysis
- 12.1.13 Saur
- 12.1.13.1. Company Overview
- 12.1.13.2. Products
- 12.1.13.3. Company Financials
- 12.1.13.4. SWOT Analysis
- 12.1.14 Alan Srl
- 12.1.14.1. Company Overview
- 12.1.14.2. Products
- 12.1.14.3. Company Financials
- 12.1.14.4. SWOT Analysis
- 12.1.15 Lystek International
- 12.1.15.1. Company Overview
- 12.1.15.2. Products
- 12.1.15.3. Company Financials
- 12.1.15.4. SWOT Analysis
- 12.1.16 REMONDIS SE & Co KG
- 12.1.16.1. Company Overview
- 12.1.16.2. Products
- 12.1.16.3. Company Financials
- 12.1.16.4. SWOT Analysis
- 12.1.17 FCC Group
- 12.1.17.1. Company Overview
- 12.1.17.2. Products
- 12.1.17.3. Company Financials
- 12.1.17.4. SWOT Analysis
- 12.1.18 Synagro Technologies
- 12.1.18.1. Company Overview
- 12.1.18.2. Products
- 12.1.18.3. Company Financials
- 12.1.18.4. SWOT Analysis
- 12.1.19 C R E - Centro di Ricerche Ecologiche
- 12.1.19.1. Company Overview
- 12.1.19.2. Products
- 12.1.19.3. Company Financials
- 12.1.19.4. SWOT Analysis
- 12.1.20 Parker Ag Services LLC
- 12.1.20.1. Company Overview
- 12.1.20.2. Products
- 12.1.20.3. Company Financials
- 12.1.20.4. SWOT Analysis
- 12.1.21 Terrapure BR Ltd
- 12.1.21.1. Company Overview
- 12.1.21.2. Products
- 12.1.21.3. Company Financials
- 12.1.21.4. SWOT Analysis
- 12.1.22 Merrell Bros Inc
- 12.1.22.1. Company Overview
- 12.1.22.2. Products
- 12.1.22.3. Company Financials
- 12.1.22.4. SWOT Analysis
- 12.1.23 Allevi Srl
- 12.1.23.1. Company Overview
- 12.1.23.2. Products
- 12.1.23.3. Company Financials
- 12.1.23.4. SWOT Analysis
- 12.1.1 Walker Industries*List Not Exhaustive
- 12.2. Market Entropy
- 12.2.1 Company's Key Areas Served
- 12.2.2 Recent Developments
- 12.3. Company Market Share Analysis 2025
- 12.3.1 Top 5 Companies Market Share Analysis
- 12.3.2 Top 3 Companies Market Share Analysis
- 12.4. List of Potential Customers
- 13. Research Methodology
List of Figures
- Figure 1: Global Biosolids Industry Revenue Breakdown (Million, %) by Region 2025 & 2033
- Figure 2: Global Biosolids Industry Volume Breakdown (liter , %) by Region 2025 & 2033
- Figure 3: Asia Pacific Biosolids Industry Revenue (Million), by Type 2025 & 2033
- Figure 4: Asia Pacific Biosolids Industry Volume (liter ), by Type 2025 & 2033
- Figure 5: Asia Pacific Biosolids Industry Revenue Share (%), by Type 2025 & 2033
- Figure 6: Asia Pacific Biosolids Industry Volume Share (%), by Type 2025 & 2033
- Figure 7: Asia Pacific Biosolids Industry Revenue (Million), by Form 2025 & 2033
- Figure 8: Asia Pacific Biosolids Industry Volume (liter ), by Form 2025 & 2033
- Figure 9: Asia Pacific Biosolids Industry Revenue Share (%), by Form 2025 & 2033
- Figure 10: Asia Pacific Biosolids Industry Volume Share (%), by Form 2025 & 2033
- Figure 11: Asia Pacific Biosolids Industry Revenue (Million), by Application 2025 & 2033
- Figure 12: Asia Pacific Biosolids Industry Volume (liter ), by Application 2025 & 2033
- Figure 13: Asia Pacific Biosolids Industry Revenue Share (%), by Application 2025 & 2033
- Figure 14: Asia Pacific Biosolids Industry Volume Share (%), by Application 2025 & 2033
- Figure 15: Asia Pacific Biosolids Industry Revenue (Million), by Country 2025 & 2033
- Figure 16: Asia Pacific Biosolids Industry Volume (liter ), by Country 2025 & 2033
- Figure 17: Asia Pacific Biosolids Industry Revenue Share (%), by Country 2025 & 2033
- Figure 18: Asia Pacific Biosolids Industry Volume Share (%), by Country 2025 & 2033
- Figure 19: North America Biosolids Industry Revenue (Million), by Type 2025 & 2033
- Figure 20: North America Biosolids Industry Volume (liter ), by Type 2025 & 2033
- Figure 21: North America Biosolids Industry Revenue Share (%), by Type 2025 & 2033
- Figure 22: North America Biosolids Industry Volume Share (%), by Type 2025 & 2033
- Figure 23: North America Biosolids Industry Revenue (Million), by Form 2025 & 2033
- Figure 24: North America Biosolids Industry Volume (liter ), by Form 2025 & 2033
- Figure 25: North America Biosolids Industry Revenue Share (%), by Form 2025 & 2033
- Figure 26: North America Biosolids Industry Volume Share (%), by Form 2025 & 2033
- Figure 27: North America Biosolids Industry Revenue (Million), by Application 2025 & 2033
- Figure 28: North America Biosolids Industry Volume (liter ), by Application 2025 & 2033
- Figure 29: North America Biosolids Industry Revenue Share (%), by Application 2025 & 2033
- Figure 30: North America Biosolids Industry Volume Share (%), by Application 2025 & 2033
- Figure 31: North America Biosolids Industry Revenue (Million), by Country 2025 & 2033
- Figure 32: North America Biosolids Industry Volume (liter ), by Country 2025 & 2033
- Figure 33: North America Biosolids Industry Revenue Share (%), by Country 2025 & 2033
- Figure 34: North America Biosolids Industry Volume Share (%), by Country 2025 & 2033
- Figure 35: Europe Biosolids Industry Revenue (Million), by Type 2025 & 2033
- Figure 36: Europe Biosolids Industry Volume (liter ), by Type 2025 & 2033
- Figure 37: Europe Biosolids Industry Revenue Share (%), by Type 2025 & 2033
- Figure 38: Europe Biosolids Industry Volume Share (%), by Type 2025 & 2033
- Figure 39: Europe Biosolids Industry Revenue (Million), by Form 2025 & 2033
- Figure 40: Europe Biosolids Industry Volume (liter ), by Form 2025 & 2033
- Figure 41: Europe Biosolids Industry Revenue Share (%), by Form 2025 & 2033
- Figure 42: Europe Biosolids Industry Volume Share (%), by Form 2025 & 2033
- Figure 43: Europe Biosolids Industry Revenue (Million), by Application 2025 & 2033
- Figure 44: Europe Biosolids Industry Volume (liter ), by Application 2025 & 2033
- Figure 45: Europe Biosolids Industry Revenue Share (%), by Application 2025 & 2033
- Figure 46: Europe Biosolids Industry Volume Share (%), by Application 2025 & 2033
- Figure 47: Europe Biosolids Industry Revenue (Million), by Country 2025 & 2033
- Figure 48: Europe Biosolids Industry Volume (liter ), by Country 2025 & 2033
- Figure 49: Europe Biosolids Industry Revenue Share (%), by Country 2025 & 2033
- Figure 50: Europe Biosolids Industry Volume Share (%), by Country 2025 & 2033
- Figure 51: South America Biosolids Industry Revenue (Million), by Type 2025 & 2033
- Figure 52: South America Biosolids Industry Volume (liter ), by Type 2025 & 2033
- Figure 53: South America Biosolids Industry Revenue Share (%), by Type 2025 & 2033
- Figure 54: South America Biosolids Industry Volume Share (%), by Type 2025 & 2033
- Figure 55: South America Biosolids Industry Revenue (Million), by Form 2025 & 2033
- Figure 56: South America Biosolids Industry Volume (liter ), by Form 2025 & 2033
- Figure 57: South America Biosolids Industry Revenue Share (%), by Form 2025 & 2033
- Figure 58: South America Biosolids Industry Volume Share (%), by Form 2025 & 2033
- Figure 59: South America Biosolids Industry Revenue (Million), by Application 2025 & 2033
- Figure 60: South America Biosolids Industry Volume (liter ), by Application 2025 & 2033
- Figure 61: South America Biosolids Industry Revenue Share (%), by Application 2025 & 2033
- Figure 62: South America Biosolids Industry Volume Share (%), by Application 2025 & 2033
- Figure 63: South America Biosolids Industry Revenue (Million), by Country 2025 & 2033
- Figure 64: South America Biosolids Industry Volume (liter ), by Country 2025 & 2033
- Figure 65: South America Biosolids Industry Revenue Share (%), by Country 2025 & 2033
- Figure 66: South America Biosolids Industry Volume Share (%), by Country 2025 & 2033
- Figure 67: Middle East and Africa Biosolids Industry Revenue (Million), by Type 2025 & 2033
- Figure 68: Middle East and Africa Biosolids Industry Volume (liter ), by Type 2025 & 2033
- Figure 69: Middle East and Africa Biosolids Industry Revenue Share (%), by Type 2025 & 2033
- Figure 70: Middle East and Africa Biosolids Industry Volume Share (%), by Type 2025 & 2033
- Figure 71: Middle East and Africa Biosolids Industry Revenue (Million), by Form 2025 & 2033
- Figure 72: Middle East and Africa Biosolids Industry Volume (liter ), by Form 2025 & 2033
- Figure 73: Middle East and Africa Biosolids Industry Revenue Share (%), by Form 2025 & 2033
- Figure 74: Middle East and Africa Biosolids Industry Volume Share (%), by Form 2025 & 2033
- Figure 75: Middle East and Africa Biosolids Industry Revenue (Million), by Application 2025 & 2033
- Figure 76: Middle East and Africa Biosolids Industry Volume (liter ), by Application 2025 & 2033
- Figure 77: Middle East and Africa Biosolids Industry Revenue Share (%), by Application 2025 & 2033
- Figure 78: Middle East and Africa Biosolids Industry Volume Share (%), by Application 2025 & 2033
- Figure 79: Middle East and Africa Biosolids Industry Revenue (Million), by Country 2025 & 2033
- Figure 80: Middle East and Africa Biosolids Industry Volume (liter ), by Country 2025 & 2033
- Figure 81: Middle East and Africa Biosolids Industry Revenue Share (%), by Country 2025 & 2033
- Figure 82: Middle East and Africa Biosolids Industry Volume Share (%), by Country 2025 & 2033
List of Tables
- Table 1: Global Biosolids Industry Revenue Million Forecast, by Type 2020 & 2033
- Table 2: Global Biosolids Industry Volume liter Forecast, by Type 2020 & 2033
- Table 3: Global Biosolids Industry Revenue Million Forecast, by Form 2020 & 2033
- Table 4: Global Biosolids Industry Volume liter Forecast, by Form 2020 & 2033
- Table 5: Global Biosolids Industry Revenue Million Forecast, by Application 2020 & 2033
- Table 6: Global Biosolids Industry Volume liter Forecast, by Application 2020 & 2033
- Table 7: Global Biosolids Industry Revenue Million Forecast, by Region 2020 & 2033
- Table 8: Global Biosolids Industry Volume liter Forecast, by Region 2020 & 2033
- Table 9: Global Biosolids Industry Revenue Million Forecast, by Type 2020 & 2033
- Table 10: Global Biosolids Industry Volume liter Forecast, by Type 2020 & 2033
- Table 11: Global Biosolids Industry Revenue Million Forecast, by Form 2020 & 2033
- Table 12: Global Biosolids Industry Volume liter Forecast, by Form 2020 & 2033
- Table 13: Global Biosolids Industry Revenue Million Forecast, by Application 2020 & 2033
- Table 14: Global Biosolids Industry Volume liter Forecast, by Application 2020 & 2033
- Table 15: Global Biosolids Industry Revenue Million Forecast, by Country 2020 & 2033
- Table 16: Global Biosolids Industry Volume liter Forecast, by Country 2020 & 2033
- Table 17: China Biosolids Industry Revenue (Million) Forecast, by Application 2020 & 2033
- Table 18: China Biosolids Industry Volume (liter ) Forecast, by Application 2020 & 2033
- Table 19: India Biosolids Industry Revenue (Million) Forecast, by Application 2020 & 2033
- Table 20: India Biosolids Industry Volume (liter ) Forecast, by Application 2020 & 2033
- Table 21: Japan Biosolids Industry Revenue (Million) Forecast, by Application 2020 & 2033
- Table 22: Japan Biosolids Industry Volume (liter ) Forecast, by Application 2020 & 2033
- Table 23: South Korea Biosolids Industry Revenue (Million) Forecast, by Application 2020 & 2033
- Table 24: South Korea Biosolids Industry Volume (liter ) Forecast, by Application 2020 & 2033
- Table 25: Malaysia Biosolids Industry Revenue (Million) Forecast, by Application 2020 & 2033
- Table 26: Malaysia Biosolids Industry Volume (liter ) Forecast, by Application 2020 & 2033
- Table 27: Thailand Biosolids Industry Revenue (Million) Forecast, by Application 2020 & 2033
- Table 28: Thailand Biosolids Industry Volume (liter ) Forecast, by Application 2020 & 2033
- Table 29: Indonesia Biosolids Industry Revenue (Million) Forecast, by Application 2020 & 2033
- Table 30: Indonesia Biosolids Industry Volume (liter ) Forecast, by Application 2020 & 2033
- Table 31: Vietnam Biosolids Industry Revenue (Million) Forecast, by Application 2020 & 2033
- Table 32: Vietnam Biosolids Industry Volume (liter ) Forecast, by Application 2020 & 2033
- Table 33: Rest of Asia Pacific Biosolids Industry Revenue (Million) Forecast, by Application 2020 & 2033
- Table 34: Rest of Asia Pacific Biosolids Industry Volume (liter ) Forecast, by Application 2020 & 2033
- Table 35: Global Biosolids Industry Revenue Million Forecast, by Type 2020 & 2033
- Table 36: Global Biosolids Industry Volume liter Forecast, by Type 2020 & 2033
- Table 37: Global Biosolids Industry Revenue Million Forecast, by Form 2020 & 2033
- Table 38: Global Biosolids Industry Volume liter Forecast, by Form 2020 & 2033
- Table 39: Global Biosolids Industry Revenue Million Forecast, by Application 2020 & 2033
- Table 40: Global Biosolids Industry Volume liter Forecast, by Application 2020 & 2033
- Table 41: Global Biosolids Industry Revenue Million Forecast, by Country 2020 & 2033
- Table 42: Global Biosolids Industry Volume liter Forecast, by Country 2020 & 2033
- Table 43: United States Biosolids Industry Revenue (Million) Forecast, by Application 2020 & 2033
- Table 44: United States Biosolids Industry Volume (liter ) Forecast, by Application 2020 & 2033
- Table 45: Canada Biosolids Industry Revenue (Million) Forecast, by Application 2020 & 2033
- Table 46: Canada Biosolids Industry Volume (liter ) Forecast, by Application 2020 & 2033
- Table 47: Mexico Biosolids Industry Revenue (Million) Forecast, by Application 2020 & 2033
- Table 48: Mexico Biosolids Industry Volume (liter ) Forecast, by Application 2020 & 2033
- Table 49: Global Biosolids Industry Revenue Million Forecast, by Type 2020 & 2033
- Table 50: Global Biosolids Industry Volume liter Forecast, by Type 2020 & 2033
- Table 51: Global Biosolids Industry Revenue Million Forecast, by Form 2020 & 2033
- Table 52: Global Biosolids Industry Volume liter Forecast, by Form 2020 & 2033
- Table 53: Global Biosolids Industry Revenue Million Forecast, by Application 2020 & 2033
- Table 54: Global Biosolids Industry Volume liter Forecast, by Application 2020 & 2033
- Table 55: Global Biosolids Industry Revenue Million Forecast, by Country 2020 & 2033
- Table 56: Global Biosolids Industry Volume liter Forecast, by Country 2020 & 2033
- Table 57: Germany Biosolids Industry Revenue (Million) Forecast, by Application 2020 & 2033
- Table 58: Germany Biosolids Industry Volume (liter ) Forecast, by Application 2020 & 2033
- Table 59: United Kingdom Biosolids Industry Revenue (Million) Forecast, by Application 2020 & 2033
- Table 60: United Kingdom Biosolids Industry Volume (liter ) Forecast, by Application 2020 & 2033
- Table 61: Italy Biosolids Industry Revenue (Million) Forecast, by Application 2020 & 2033
- Table 62: Italy Biosolids Industry Volume (liter ) Forecast, by Application 2020 & 2033
- Table 63: France Biosolids Industry Revenue (Million) Forecast, by Application 2020 & 2033
- Table 64: France Biosolids Industry Volume (liter ) Forecast, by Application 2020 & 2033
- Table 65: Spain Biosolids Industry Revenue (Million) Forecast, by Application 2020 & 2033
- Table 66: Spain Biosolids Industry Volume (liter ) Forecast, by Application 2020 & 2033
- Table 67: NORDIC Biosolids Industry Revenue (Million) Forecast, by Application 2020 & 2033
- Table 68: NORDIC Biosolids Industry Volume (liter ) Forecast, by Application 2020 & 2033
- Table 69: Turkey Biosolids Industry Revenue (Million) Forecast, by Application 2020 & 2033
- Table 70: Turkey Biosolids Industry Volume (liter ) Forecast, by Application 2020 & 2033
- Table 71: Russia Biosolids Industry Revenue (Million) Forecast, by Application 2020 & 2033
- Table 72: Russia Biosolids Industry Volume (liter ) Forecast, by Application 2020 & 2033
- Table 73: Rest of Europe Biosolids Industry Revenue (Million) Forecast, by Application 2020 & 2033
- Table 74: Rest of Europe Biosolids Industry Volume (liter ) Forecast, by Application 2020 & 2033
- Table 75: Global Biosolids Industry Revenue Million Forecast, by Type 2020 & 2033
- Table 76: Global Biosolids Industry Volume liter Forecast, by Type 2020 & 2033
- Table 77: Global Biosolids Industry Revenue Million Forecast, by Form 2020 & 2033
- Table 78: Global Biosolids Industry Volume liter Forecast, by Form 2020 & 2033
- Table 79: Global Biosolids Industry Revenue Million Forecast, by Application 2020 & 2033
- Table 80: Global Biosolids Industry Volume liter Forecast, by Application 2020 & 2033
- Table 81: Global Biosolids Industry Revenue Million Forecast, by Country 2020 & 2033
- Table 82: Global Biosolids Industry Volume liter Forecast, by Country 2020 & 2033
- Table 83: Brazil Biosolids Industry Revenue (Million) Forecast, by Application 2020 & 2033
- Table 84: Brazil Biosolids Industry Volume (liter ) Forecast, by Application 2020 & 2033
- Table 85: Argentina Biosolids Industry Revenue (Million) Forecast, by Application 2020 & 2033
- Table 86: Argentina Biosolids Industry Volume (liter ) Forecast, by Application 2020 & 2033
- Table 87: Colombia Biosolids Industry Revenue (Million) Forecast, by Application 2020 & 2033
- Table 88: Colombia Biosolids Industry Volume (liter ) Forecast, by Application 2020 & 2033
- Table 89: Rest of South America Biosolids Industry Revenue (Million) Forecast, by Application 2020 & 2033
- Table 90: Rest of South America Biosolids Industry Volume (liter ) Forecast, by Application 2020 & 2033
- Table 91: Global Biosolids Industry Revenue Million Forecast, by Type 2020 & 2033
- Table 92: Global Biosolids Industry Volume liter Forecast, by Type 2020 & 2033
- Table 93: Global Biosolids Industry Revenue Million Forecast, by Form 2020 & 2033
- Table 94: Global Biosolids Industry Volume liter Forecast, by Form 2020 & 2033
- Table 95: Global Biosolids Industry Revenue Million Forecast, by Application 2020 & 2033
- Table 96: Global Biosolids Industry Volume liter Forecast, by Application 2020 & 2033
- Table 97: Global Biosolids Industry Revenue Million Forecast, by Country 2020 & 2033
- Table 98: Global Biosolids Industry Volume liter Forecast, by Country 2020 & 2033
- Table 99: Saudi Arabia Biosolids Industry Revenue (Million) Forecast, by Application 2020 & 2033
- Table 100: Saudi Arabia Biosolids Industry Volume (liter ) Forecast, by Application 2020 & 2033
- Table 101: South Africa Biosolids Industry Revenue (Million) Forecast, by Application 2020 & 2033
- Table 102: South Africa Biosolids Industry Volume (liter ) Forecast, by Application 2020 & 2033
- Table 103: Nigeria Biosolids Industry Revenue (Million) Forecast, by Application 2020 & 2033
- Table 104: Nigeria Biosolids Industry Volume (liter ) Forecast, by Application 2020 & 2033
- Table 105: Qatar Biosolids Industry Revenue (Million) Forecast, by Application 2020 & 2033
- Table 106: Qatar Biosolids Industry Volume (liter ) Forecast, by Application 2020 & 2033
- Table 107: Egypt Biosolids Industry Revenue (Million) Forecast, by Application 2020 & 2033
- Table 108: Egypt Biosolids Industry Volume (liter ) Forecast, by Application 2020 & 2033
- Table 109: United Arab Emirates Biosolids Industry Revenue (Million) Forecast, by Application 2020 & 2033
- Table 110: United Arab Emirates Biosolids Industry Volume (liter ) Forecast, by Application 2020 & 2033
- Table 111: Rest of Middle East and Africa Biosolids Industry Revenue (Million) Forecast, by Application 2020 & 2033
- Table 112: Rest of Middle East and Africa Biosolids Industry Volume (liter ) Forecast, by Application 2020 & 2033
Frequently Asked Questions
1. What is the projected Compound Annual Growth Rate (CAGR) of the Biosolids Industry?
The projected CAGR is approximately > 3.50%.
2. Which companies are prominent players in the Biosolids Industry?
Key companies in the market include Walker Industries*List Not Exhaustive, Cambi ASA, Eco-trass, DC Water, Recyc Systems Inc, BCR Environmental, Aguas Andinas SA, Cleanaway, SYLVIS, Casella Waste Systems Inc, Englobe, Agrivert Ltd, Saur, Alan Srl, Lystek International, REMONDIS SE & Co KG, FCC Group, Synagro Technologies, C R E - Centro di Ricerche Ecologiche, Parker Ag Services LLC, Terrapure BR Ltd, Merrell Bros Inc, Allevi Srl.
3. What are the main segments of the Biosolids Industry?
The market segments include Type, Form, Application.
4. Can you provide details about the market size?
The market size is estimated to be USD 1700 Million as of 2022.
5. What are some drivers contributing to market growth?
Replacing Hazardous Chemical Fertilizers in North America; Stringent Government Emission Laws; Other Drivers.
6. What are the notable trends driving market growth?
Agricultural Land Application to Dominate the Market.
7. Are there any restraints impacting market growth?
Lack of Proper Knowledge and Awareness on Biosolids; Other Restraints.
8. Can you provide examples of recent developments in the market?
January 2023: Synagro Technologies Inc., a provider of biosolids and residual solutions, acquired Burch Hydro Inc., an Ohio-based premier provider of biosolids and lime-residuals management and land application.
9. What pricing options are available for accessing the report?
Pricing options include single-user, multi-user, and enterprise licenses priced at USD 4750, USD 5250, and USD 8750 respectively.
10. Is the market size provided in terms of value or volume?
The market size is provided in terms of value, measured in Million and volume, measured in liter .
11. Are there any specific market keywords associated with the report?
Yes, the market keyword associated with the report is "Biosolids Industry," which aids in identifying and referencing the specific market segment covered.
12. How do I determine which pricing option suits my needs best?
The pricing options vary based on user requirements and access needs. Individual users may opt for single-user licenses, while businesses requiring broader access may choose multi-user or enterprise licenses for cost-effective access to the report.
13. Are there any additional resources or data provided in the Biosolids Industry report?
While the report offers comprehensive insights, it's advisable to review the specific contents or supplementary materials provided to ascertain if additional resources or data are available.
14. How can I stay updated on further developments or reports in the Biosolids Industry?
To stay informed about further developments, trends, and reports in the Biosolids Industry, consider subscribing to industry newsletters, following relevant companies and organizations, or regularly checking reputable industry news sources and publications.
Methodology
Step 1 - Identification of Relevant Samples Size from Population Database


Step 2 - Approaches for Defining Global Market Size (Value, Volume* & Price*)

Note*: In applicable scenarios
Step 3 - Data Sources
Primary Research
- Web Analytics
- Survey Reports
- Research Institute
- Latest Research Reports
- Opinion Leaders
Secondary Research
- Annual Reports
- White Paper
- Latest Press Release
- Industry Association
- Paid Database
- Investor Presentations

Step 4 - Data Triangulation
Involves using different sources of information in order to increase the validity of a study
These sources are likely to be stakeholders in a program - participants, other researchers, program staff, other community members, and so on.
Then we put all data in single framework & apply various statistical tools to find out the dynamic on the market.
During the analysis stage, feedback from the stakeholder groups would be compared to determine areas of agreement as well as areas of divergence