

Key Insights
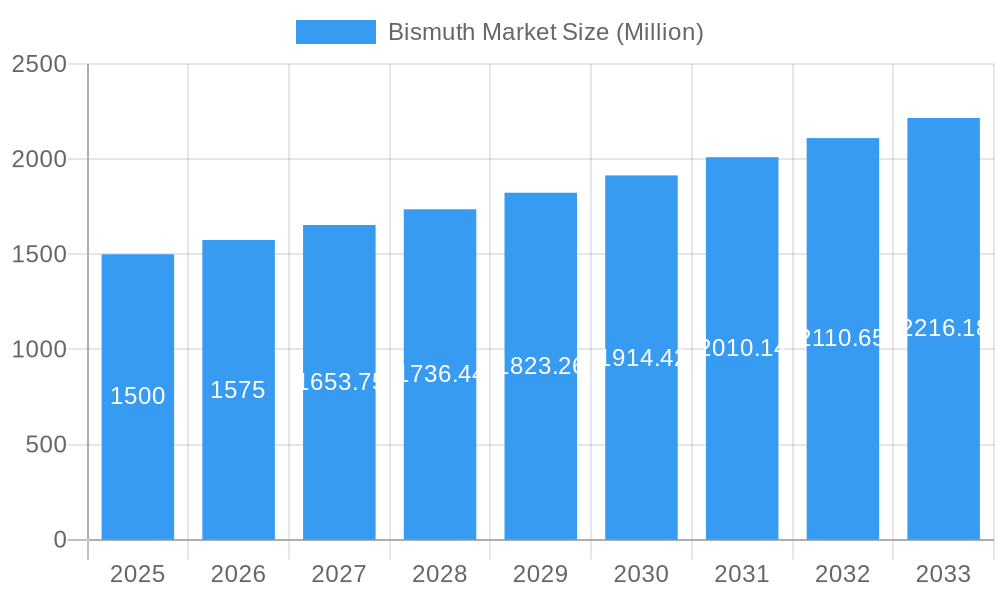
The global bismuth market is poised for significant expansion, projected to achieve a Compound Annual Growth Rate (CAGR) of 5.8%. This robust growth, forecast from 2025 to 2033, is propelled by increasing demand from key industries. The pharmaceutical sector, a primary consumer of bismuth compounds for medicinal applications, and the automotive industry, utilizing bismuth in alloys for enhanced performance, are major contributors. The electronics industry also plays a crucial role, leveraging bismuth's unique properties in various components. Ancillary markets in cosmetics and other specialized sectors further contribute to this expansion. While raw material price volatility and supply chain complexities present challenges, advancements in bismuth extraction and processing technologies are anticipated to mitigate these factors. The Asia-Pacific region, particularly China and India, is expected to lead market growth due to strong manufacturing capabilities and rising demand across diverse end-use industries. North America and Europe will also experience notable growth, driven by the increasing adoption of bismuth-based products in pharmaceuticals and electronics. The competitive landscape features a blend of established global players and agile regional manufacturers, fostering innovation and competitive pricing.
Bismuth Market Market Size (In Million)
Market segmentation reveals substantial opportunities. Bismuth oxide and bismuth oxychloride are leading derivatives, underscoring their widespread application. While the pharmaceutical segment remains a significant revenue generator, accelerated growth in the automotive and electronics sectors is expected to diversify the market. Strategic collaborations and mergers & acquisitions are anticipated to reshape the market, driving innovation and consolidation. The forecast period indicates sustained market growth, influenced by ongoing technological advancements, increasing industrialization, and growing regulatory support for sustainable materials. Potential economic slowdowns and evolving regulatory environments may present moderate headwinds. Continuous investment in research and development, coupled with strategic value chain partnerships, is essential for long-term market success.
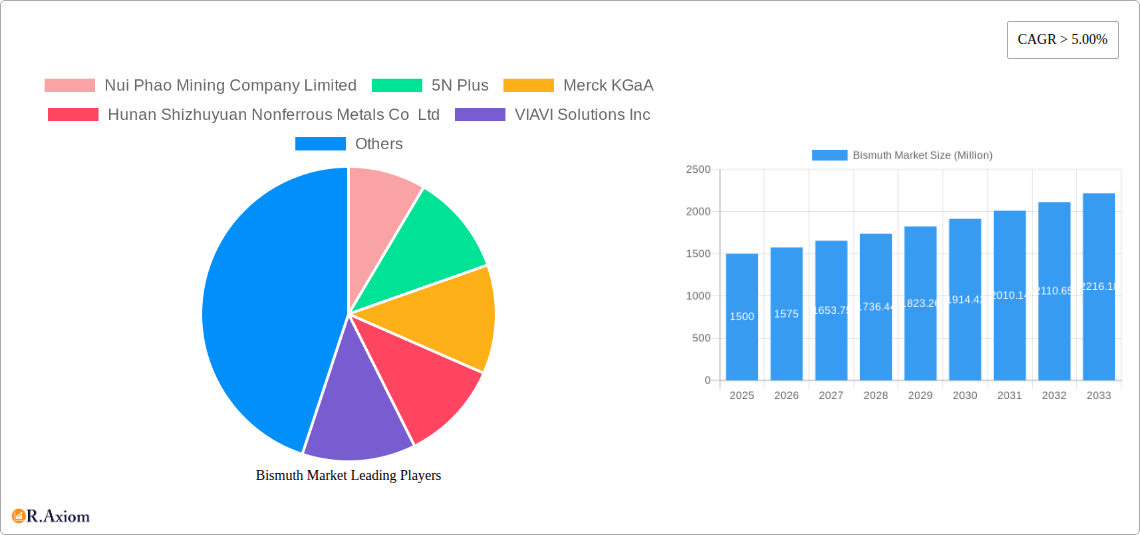
Bismuth Market Company Market Share
This comprehensive report delivers an in-depth analysis of the global bismuth market, detailing market size, segmentation, growth drivers, challenges, competitive dynamics, and future projections. The study encompasses the period from 2019 to 2033, with 2025 designated as the base and estimated year. The projected market size is 454.7 million, offering actionable insights for manufacturers, suppliers, distributors, and investors.
Bismuth Market Market Concentration & Innovation
The bismuth market exhibits a moderately concentrated structure, with a few major players holding significant market share. While precise market share figures for individual companies are proprietary data, Nui Phao Mining Company Limited, 5N Plus, Merck KGaA, and Hunan Shizhuyuan Nonferrous Metals Co Ltd are among the key players globally. The market is characterized by ongoing innovation in bismuth derivatives and their applications across various end-user industries.
- Market Concentration: The Herfindahl-Hirschman Index (HHI) is estimated at xx, indicating a moderately concentrated market.
- Innovation Drivers: Demand for high-purity bismuth in specialized applications such as electronics and pharmaceuticals is driving innovation in refining and processing techniques.
- Regulatory Frameworks: Environmental regulations concerning bismuth extraction and processing vary across regions, impacting production costs and market dynamics.
- Product Substitutes: Limited readily available substitutes for bismuth exist in its niche applications, offering strong market stability.
- End-User Trends: Growing demand in electronics (particularly in 5G and beyond) and the pharmaceutical industry are key market growth drivers.
- M&A Activities: Recent M&A activity in the bismuth sector has been relatively limited. However, predicted M&A deal value over the forecast period is estimated at xx Million.
Bismuth Market Industry Trends & Insights
The global bismuth market is experiencing steady growth, driven by increasing demand from various sectors. The pharmaceutical industry remains a major consumer of bismuth compounds, particularly bismuth subsalicylate for treating gastrointestinal issues. Technological advancements in bismuth-doped fiber optics for high-speed telecommunications are also significantly contributing to market expansion. The market exhibits a robust compound annual growth rate (CAGR) of xx% during the forecast period (2025-2033). Market penetration in emerging economies is expected to increase, further boosting market growth. Competitive dynamics are shaped by pricing strategies, product differentiation, and technological advancements among key players. Consumer preferences are increasingly geared towards high-purity bismuth for specialized applications, pushing innovation in purification processes.
Dominant Markets & Segments in Bismuth Market
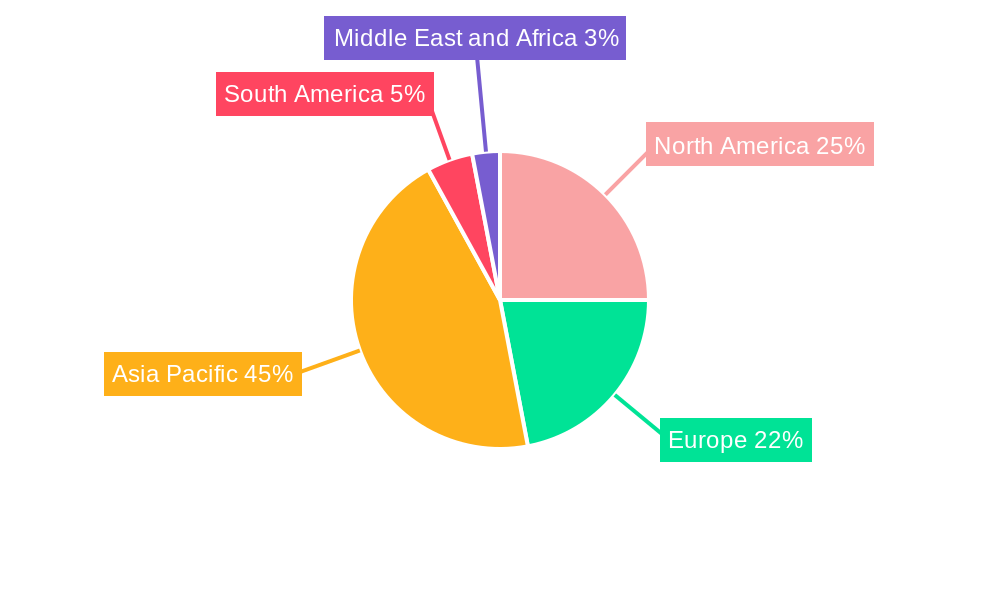
The Asia-Pacific region currently holds the dominant position in the global bismuth market, driven by robust economic growth and increasing industrial activities in countries like China. Within the derivatives segment, bismuth oxide commands the largest market share, owing to its wide applications in various industries. The pharmaceutical industry remains the largest end-user segment, consuming a significant portion of bismuth production.
- Key Drivers in Asia-Pacific:
- Rapid industrialization and urbanization.
- Growing demand from electronics and pharmaceutical sectors.
- Favorable government policies supporting industrial growth.
- Bismuth Oxide Dominance: Its versatility in applications, from ceramics to cosmetics, makes it a leading derivative.
- Pharmaceutical Industry Leadership: The ongoing need for bismuth-based medications ensures consistent market demand.
Bismuth Market Product Developments
Recent product innovations focus on enhancing the purity and performance of bismuth derivatives for specific applications. For example, the development of high-purity bismuth oxide for use in advanced electronics and the creation of novel bismuth-based pharmaceuticals showcase significant technological advancements improving product efficiency and market fit.
Report Scope & Segmentation Analysis
This report segments the bismuth market based on derivatives (Bismuth Nitrate, Bismuth Oxide, Bismuth Oxychloride, Bismuth Subcarbonate, Other Derivatives) and end-user industries (Pharmaceuticals, Automotive, Electrical and Electronics, Cosmetics, Other End-user Industries). Each segment's market size, growth projections, and competitive dynamics are analyzed separately. For example, the pharmaceutical segment is expected to show significant growth, driven by the increasing demand for bismuth-based medications, while the electronics segment's growth will be propelled by the expanding telecommunications and 5G infrastructure.
Key Drivers of Bismuth Market Growth
Several factors fuel bismuth market growth, including increasing demand from the pharmaceutical and electronics industries, technological advancements improving the efficiency of bismuth-based products, and the development of new applications in various sectors. Furthermore, favorable government policies and investments in infrastructure projects also contribute to this growth.
Challenges in the Bismuth Market Sector
The bismuth market faces challenges such as fluctuating raw material prices, environmental regulations impacting production costs, and intense competition among established players. Supply chain disruptions can also lead to price volatility, impacting profitability.
Emerging Opportunities in Bismuth Market
Emerging opportunities lie in the development of novel bismuth-based materials for advanced applications, particularly in high-tech sectors such as renewable energy and nanotechnology. Expanding into new geographic markets, especially in developing economies, also presents significant potential.
Leading Players in the Bismuth Market Market
- Nui Phao Mining Company Limited
- 5N Plus
- Merck KGaA
- Hunan Shizhuyuan Nonferrous Metals Co Ltd
- VIAVI Solutions Inc
- BASF SE
- Industrias Peñoles
- Fortune Minerals
- Xianyang Yuehua Bismuth Co Ltd
- Par Pharmaceutical (Endo International plc)
Key Developments in Bismuth Market Industry
- March 2023: Endo International plc's Par Pharmaceutical launched a generic version of Allergan's Pylera®, boosting competition in the pharmaceutical bismuth market.
- March 2022: OFS and Viavi Solutions' collaboration on bismuth-doped fiber optics signifies technological advancement and increased demand in the telecommunications sector.
Strategic Outlook for Bismuth Market Market
The bismuth market is poised for continued growth, driven by technological advancements, expanding applications in various industries, and increasing demand from emerging economies. Strategic investments in research and development, coupled with expansion into new markets, will be key for future success.
Bismuth Market Segmentation
-
1. Derivatives
- 1.1. Bismuth Nitrate
- 1.2. Bismuth Oxide
- 1.3. Bismuth Oxychloride
- 1.4. Bismuth Subcarbonate
- 1.5. Other Derivatives
-
2. End-user Industry
- 2.1. Pharmaceuticals
- 2.2. Automotive
- 2.3. Electrical and Electronics
- 2.4. Cosmetics
- 2.5. Other End-user Industries
Bismuth Market Segmentation By Geography
- 1. China
- 2. India
- 3. Japan
- 4. South Korea
-
5. Rest of Asia Pacific
- 5.1. North America
- 6. United States
- 7. Canada
-
8. Mexico
- 8.1. Europe
- 9. Germany
- 10. United Kingdom
- 11. Italy
- 12. France
-
13. Rest of Europe
- 13.1. South America
- 14. Brazil
- 15. Argentina
-
16. Rest of South America
- 16.1. Middle East and Africa
- 17. Saudi Arabia
- 18. South Africa
- 19. Rest of Middle East and Africa
Bismuth Market Regional Market Share
Geographic Coverage of Bismuth Market
Bismuth Market REPORT HIGHLIGHTS
| Aspects | Details |
|---|---|
| Study Period | 2020-2034 |
| Base Year | 2025 |
| Estimated Year | 2026 |
| Forecast Period | 2026-2034 |
| Historical Period | 2020-2025 |
| Growth Rate | CAGR of 5.8% from 2020-2034 |
| Segmentation |
|
Table of Contents
- 1. Introduction
- 1.1. Research Scope
- 1.2. Market Segmentation
- 1.3. Research Objective
- 1.4. Definitions and Assumptions
- 2. Executive Summary
- 2.1. Market Snapshot
- 3. Market Dynamics
- 3.1. Market Drivers
- 3.2. Market Restrains
- 3.3. Market Trends
- 3.4. Market Opportunities
- 4. Market Factor Analysis
- 4.1. Porters Five Forces
- 4.1.1. Bargaining Power of Suppliers
- 4.1.2. Bargaining Power of Buyers
- 4.1.3. Threat of New Entrants
- 4.1.4. Threat of Substitutes
- 4.1.5. Competitive Rivalry
- 4.2. PESTEL analysis
- 4.3. BCG Analysis
- 4.3.1. Stars (High Growth, High Market Share)
- 4.3.2. Cash Cows (Low Growth, High Market Share)
- 4.3.3. Question Mark (High Growth, Low Market Share)
- 4.3.4. Dogs (Low Growth, Low Market Share)
- 4.4. Ansoff Matrix Analysis
- 4.5. Supply Chain Analysis
- 4.6. Regulatory Landscape
- 4.7. Current Market Potential and Opportunity Assessment (TAM–SAM–SOM Framework)
- 4.8. RAX Analyst Note
- 4.1. Porters Five Forces
- 5. Market Analysis, Insights and Forecast 2021-2033
- 5.1. Market Analysis, Insights and Forecast - by Derivatives
- 5.1.1. Bismuth Nitrate
- 5.1.2. Bismuth Oxide
- 5.1.3. Bismuth Oxychloride
- 5.1.4. Bismuth Subcarbonate
- 5.1.5. Other Derivatives
- 5.2. Market Analysis, Insights and Forecast - by End-user Industry
- 5.2.1. Pharmaceuticals
- 5.2.2. Automotive
- 5.2.3. Electrical and Electronics
- 5.2.4. Cosmetics
- 5.2.5. Other End-user Industries
- 5.3. Market Analysis, Insights and Forecast - by Region
- 5.3.1. China
- 5.3.2. India
- 5.3.3. Japan
- 5.3.4. South Korea
- 5.3.5. Rest of Asia Pacific
- 5.3.6. United States
- 5.3.7. Canada
- 5.3.8. Mexico
- 5.3.9. Germany
- 5.3.10. United Kingdom
- 5.3.11. Italy
- 5.3.12. France
- 5.3.13. Rest of Europe
- 5.3.14. Brazil
- 5.3.15. Argentina
- 5.3.16. Rest of South America
- 5.3.17. Saudi Arabia
- 5.3.18. South Africa
- 5.3.19. Rest of Middle East and Africa
- 5.1. Market Analysis, Insights and Forecast - by Derivatives
- 6. Global Bismuth Market Analysis, Insights and Forecast, 2021-2033
- 6.1. Market Analysis, Insights and Forecast - by Derivatives
- 6.1.1. Bismuth Nitrate
- 6.1.2. Bismuth Oxide
- 6.1.3. Bismuth Oxychloride
- 6.1.4. Bismuth Subcarbonate
- 6.1.5. Other Derivatives
- 6.2. Market Analysis, Insights and Forecast - by End-user Industry
- 6.2.1. Pharmaceuticals
- 6.2.2. Automotive
- 6.2.3. Electrical and Electronics
- 6.2.4. Cosmetics
- 6.2.5. Other End-user Industries
- 6.1. Market Analysis, Insights and Forecast - by Derivatives
- 7. China Bismuth Market Analysis, Insights and Forecast, 2020-2032
- 7.1. Market Analysis, Insights and Forecast - by Derivatives
- 7.1.1. Bismuth Nitrate
- 7.1.2. Bismuth Oxide
- 7.1.3. Bismuth Oxychloride
- 7.1.4. Bismuth Subcarbonate
- 7.1.5. Other Derivatives
- 7.2. Market Analysis, Insights and Forecast - by End-user Industry
- 7.2.1. Pharmaceuticals
- 7.2.2. Automotive
- 7.2.3. Electrical and Electronics
- 7.2.4. Cosmetics
- 7.2.5. Other End-user Industries
- 7.1. Market Analysis, Insights and Forecast - by Derivatives
- 8. India Bismuth Market Analysis, Insights and Forecast, 2020-2032
- 8.1. Market Analysis, Insights and Forecast - by Derivatives
- 8.1.1. Bismuth Nitrate
- 8.1.2. Bismuth Oxide
- 8.1.3. Bismuth Oxychloride
- 8.1.4. Bismuth Subcarbonate
- 8.1.5. Other Derivatives
- 8.2. Market Analysis, Insights and Forecast - by End-user Industry
- 8.2.1. Pharmaceuticals
- 8.2.2. Automotive
- 8.2.3. Electrical and Electronics
- 8.2.4. Cosmetics
- 8.2.5. Other End-user Industries
- 8.1. Market Analysis, Insights and Forecast - by Derivatives
- 9. Japan Bismuth Market Analysis, Insights and Forecast, 2020-2032
- 9.1. Market Analysis, Insights and Forecast - by Derivatives
- 9.1.1. Bismuth Nitrate
- 9.1.2. Bismuth Oxide
- 9.1.3. Bismuth Oxychloride
- 9.1.4. Bismuth Subcarbonate
- 9.1.5. Other Derivatives
- 9.2. Market Analysis, Insights and Forecast - by End-user Industry
- 9.2.1. Pharmaceuticals
- 9.2.2. Automotive
- 9.2.3. Electrical and Electronics
- 9.2.4. Cosmetics
- 9.2.5. Other End-user Industries
- 9.1. Market Analysis, Insights and Forecast - by Derivatives
- 10. South Korea Bismuth Market Analysis, Insights and Forecast, 2020-2032
- 10.1. Market Analysis, Insights and Forecast - by Derivatives
- 10.1.1. Bismuth Nitrate
- 10.1.2. Bismuth Oxide
- 10.1.3. Bismuth Oxychloride
- 10.1.4. Bismuth Subcarbonate
- 10.1.5. Other Derivatives
- 10.2. Market Analysis, Insights and Forecast - by End-user Industry
- 10.2.1. Pharmaceuticals
- 10.2.2. Automotive
- 10.2.3. Electrical and Electronics
- 10.2.4. Cosmetics
- 10.2.5. Other End-user Industries
- 10.1. Market Analysis, Insights and Forecast - by Derivatives
- 11. Rest of Asia Pacific Bismuth Market Analysis, Insights and Forecast, 2020-2032
- 11.1. Market Analysis, Insights and Forecast - by Derivatives
- 11.1.1. Bismuth Nitrate
- 11.1.2. Bismuth Oxide
- 11.1.3. Bismuth Oxychloride
- 11.1.4. Bismuth Subcarbonate
- 11.1.5. Other Derivatives
- 11.2. Market Analysis, Insights and Forecast - by End-user Industry
- 11.2.1. Pharmaceuticals
- 11.2.2. Automotive
- 11.2.3. Electrical and Electronics
- 11.2.4. Cosmetics
- 11.2.5. Other End-user Industries
- 11.1. Market Analysis, Insights and Forecast - by Derivatives
- 12. United States Bismuth Market Analysis, Insights and Forecast, 2020-2032
- 12.1. Market Analysis, Insights and Forecast - by Derivatives
- 12.1.1. Bismuth Nitrate
- 12.1.2. Bismuth Oxide
- 12.1.3. Bismuth Oxychloride
- 12.1.4. Bismuth Subcarbonate
- 12.1.5. Other Derivatives
- 12.2. Market Analysis, Insights and Forecast - by End-user Industry
- 12.2.1. Pharmaceuticals
- 12.2.2. Automotive
- 12.2.3. Electrical and Electronics
- 12.2.4. Cosmetics
- 12.2.5. Other End-user Industries
- 12.1. Market Analysis, Insights and Forecast - by Derivatives
- 13. Canada Bismuth Market Analysis, Insights and Forecast, 2020-2032
- 13.1. Market Analysis, Insights and Forecast - by Derivatives
- 13.1.1. Bismuth Nitrate
- 13.1.2. Bismuth Oxide
- 13.1.3. Bismuth Oxychloride
- 13.1.4. Bismuth Subcarbonate
- 13.1.5. Other Derivatives
- 13.2. Market Analysis, Insights and Forecast - by End-user Industry
- 13.2.1. Pharmaceuticals
- 13.2.2. Automotive
- 13.2.3. Electrical and Electronics
- 13.2.4. Cosmetics
- 13.2.5. Other End-user Industries
- 13.1. Market Analysis, Insights and Forecast - by Derivatives
- 14. Mexico Bismuth Market Analysis, Insights and Forecast, 2020-2032
- 14.1. Market Analysis, Insights and Forecast - by Derivatives
- 14.1.1. Bismuth Nitrate
- 14.1.2. Bismuth Oxide
- 14.1.3. Bismuth Oxychloride
- 14.1.4. Bismuth Subcarbonate
- 14.1.5. Other Derivatives
- 14.2. Market Analysis, Insights and Forecast - by End-user Industry
- 14.2.1. Pharmaceuticals
- 14.2.2. Automotive
- 14.2.3. Electrical and Electronics
- 14.2.4. Cosmetics
- 14.2.5. Other End-user Industries
- 14.1. Market Analysis, Insights and Forecast - by Derivatives
- 15. Germany Bismuth Market Analysis, Insights and Forecast, 2020-2032
- 15.1. Market Analysis, Insights and Forecast - by Derivatives
- 15.1.1. Bismuth Nitrate
- 15.1.2. Bismuth Oxide
- 15.1.3. Bismuth Oxychloride
- 15.1.4. Bismuth Subcarbonate
- 15.1.5. Other Derivatives
- 15.2. Market Analysis, Insights and Forecast - by End-user Industry
- 15.2.1. Pharmaceuticals
- 15.2.2. Automotive
- 15.2.3. Electrical and Electronics
- 15.2.4. Cosmetics
- 15.2.5. Other End-user Industries
- 15.1. Market Analysis, Insights and Forecast - by Derivatives
- 16. United Kingdom Bismuth Market Analysis, Insights and Forecast, 2020-2032
- 16.1. Market Analysis, Insights and Forecast - by Derivatives
- 16.1.1. Bismuth Nitrate
- 16.1.2. Bismuth Oxide
- 16.1.3. Bismuth Oxychloride
- 16.1.4. Bismuth Subcarbonate
- 16.1.5. Other Derivatives
- 16.2. Market Analysis, Insights and Forecast - by End-user Industry
- 16.2.1. Pharmaceuticals
- 16.2.2. Automotive
- 16.2.3. Electrical and Electronics
- 16.2.4. Cosmetics
- 16.2.5. Other End-user Industries
- 16.1. Market Analysis, Insights and Forecast - by Derivatives
- 17. Italy Bismuth Market Analysis, Insights and Forecast, 2020-2032
- 17.1. Market Analysis, Insights and Forecast - by Derivatives
- 17.1.1. Bismuth Nitrate
- 17.1.2. Bismuth Oxide
- 17.1.3. Bismuth Oxychloride
- 17.1.4. Bismuth Subcarbonate
- 17.1.5. Other Derivatives
- 17.2. Market Analysis, Insights and Forecast - by End-user Industry
- 17.2.1. Pharmaceuticals
- 17.2.2. Automotive
- 17.2.3. Electrical and Electronics
- 17.2.4. Cosmetics
- 17.2.5. Other End-user Industries
- 17.1. Market Analysis, Insights and Forecast - by Derivatives
- 18. France Bismuth Market Analysis, Insights and Forecast, 2020-2032
- 18.1. Market Analysis, Insights and Forecast - by Derivatives
- 18.1.1. Bismuth Nitrate
- 18.1.2. Bismuth Oxide
- 18.1.3. Bismuth Oxychloride
- 18.1.4. Bismuth Subcarbonate
- 18.1.5. Other Derivatives
- 18.2. Market Analysis, Insights and Forecast - by End-user Industry
- 18.2.1. Pharmaceuticals
- 18.2.2. Automotive
- 18.2.3. Electrical and Electronics
- 18.2.4. Cosmetics
- 18.2.5. Other End-user Industries
- 18.1. Market Analysis, Insights and Forecast - by Derivatives
- 19. Rest of Europe Bismuth Market Analysis, Insights and Forecast, 2020-2032
- 19.1. Market Analysis, Insights and Forecast - by Derivatives
- 19.1.1. Bismuth Nitrate
- 19.1.2. Bismuth Oxide
- 19.1.3. Bismuth Oxychloride
- 19.1.4. Bismuth Subcarbonate
- 19.1.5. Other Derivatives
- 19.2. Market Analysis, Insights and Forecast - by End-user Industry
- 19.2.1. Pharmaceuticals
- 19.2.2. Automotive
- 19.2.3. Electrical and Electronics
- 19.2.4. Cosmetics
- 19.2.5. Other End-user Industries
- 19.1. Market Analysis, Insights and Forecast - by Derivatives
- 20. Brazil Bismuth Market Analysis, Insights and Forecast, 2020-2032
- 20.1. Market Analysis, Insights and Forecast - by Derivatives
- 20.1.1. Bismuth Nitrate
- 20.1.2. Bismuth Oxide
- 20.1.3. Bismuth Oxychloride
- 20.1.4. Bismuth Subcarbonate
- 20.1.5. Other Derivatives
- 20.2. Market Analysis, Insights and Forecast - by End-user Industry
- 20.2.1. Pharmaceuticals
- 20.2.2. Automotive
- 20.2.3. Electrical and Electronics
- 20.2.4. Cosmetics
- 20.2.5. Other End-user Industries
- 20.1. Market Analysis, Insights and Forecast - by Derivatives
- 21. Argentina Bismuth Market Analysis, Insights and Forecast, 2020-2032
- 21.1. Market Analysis, Insights and Forecast - by Derivatives
- 21.1.1. Bismuth Nitrate
- 21.1.2. Bismuth Oxide
- 21.1.3. Bismuth Oxychloride
- 21.1.4. Bismuth Subcarbonate
- 21.1.5. Other Derivatives
- 21.2. Market Analysis, Insights and Forecast - by End-user Industry
- 21.2.1. Pharmaceuticals
- 21.2.2. Automotive
- 21.2.3. Electrical and Electronics
- 21.2.4. Cosmetics
- 21.2.5. Other End-user Industries
- 21.1. Market Analysis, Insights and Forecast - by Derivatives
- 22. Rest of South America Bismuth Market Analysis, Insights and Forecast, 2020-2032
- 22.1. Market Analysis, Insights and Forecast - by Derivatives
- 22.1.1. Bismuth Nitrate
- 22.1.2. Bismuth Oxide
- 22.1.3. Bismuth Oxychloride
- 22.1.4. Bismuth Subcarbonate
- 22.1.5. Other Derivatives
- 22.2. Market Analysis, Insights and Forecast - by End-user Industry
- 22.2.1. Pharmaceuticals
- 22.2.2. Automotive
- 22.2.3. Electrical and Electronics
- 22.2.4. Cosmetics
- 22.2.5. Other End-user Industries
- 22.1. Market Analysis, Insights and Forecast - by Derivatives
- 23. Saudi Arabia Bismuth Market Analysis, Insights and Forecast, 2020-2032
- 23.1. Market Analysis, Insights and Forecast - by Derivatives
- 23.1.1. Bismuth Nitrate
- 23.1.2. Bismuth Oxide
- 23.1.3. Bismuth Oxychloride
- 23.1.4. Bismuth Subcarbonate
- 23.1.5. Other Derivatives
- 23.2. Market Analysis, Insights and Forecast - by End-user Industry
- 23.2.1. Pharmaceuticals
- 23.2.2. Automotive
- 23.2.3. Electrical and Electronics
- 23.2.4. Cosmetics
- 23.2.5. Other End-user Industries
- 23.1. Market Analysis, Insights and Forecast - by Derivatives
- 24. South Africa Bismuth Market Analysis, Insights and Forecast, 2020-2032
- 24.1. Market Analysis, Insights and Forecast - by Derivatives
- 24.1.1. Bismuth Nitrate
- 24.1.2. Bismuth Oxide
- 24.1.3. Bismuth Oxychloride
- 24.1.4. Bismuth Subcarbonate
- 24.1.5. Other Derivatives
- 24.2. Market Analysis, Insights and Forecast - by End-user Industry
- 24.2.1. Pharmaceuticals
- 24.2.2. Automotive
- 24.2.3. Electrical and Electronics
- 24.2.4. Cosmetics
- 24.2.5. Other End-user Industries
- 24.1. Market Analysis, Insights and Forecast - by Derivatives
- 25. Rest of Middle East and Africa Bismuth Market Analysis, Insights and Forecast, 2020-2032
- 25.1. Market Analysis, Insights and Forecast - by Derivatives
- 25.1.1. Bismuth Nitrate
- 25.1.2. Bismuth Oxide
- 25.1.3. Bismuth Oxychloride
- 25.1.4. Bismuth Subcarbonate
- 25.1.5. Other Derivatives
- 25.2. Market Analysis, Insights and Forecast - by End-user Industry
- 25.2.1. Pharmaceuticals
- 25.2.2. Automotive
- 25.2.3. Electrical and Electronics
- 25.2.4. Cosmetics
- 25.2.5. Other End-user Industries
- 25.1. Market Analysis, Insights and Forecast - by Derivatives
- 26. Competitive Analysis
- 26.1. Company Profiles
- 26.1.1 Nui Phao Mining Company Limited
- 26.1.1.1. Company Overview
- 26.1.1.2. Products
- 26.1.1.3. Company Financials
- 26.1.1.4. SWOT Analysis
- 26.1.2 5N Plus
- 26.1.2.1. Company Overview
- 26.1.2.2. Products
- 26.1.2.3. Company Financials
- 26.1.2.4. SWOT Analysis
- 26.1.3 Merck KGaA
- 26.1.3.1. Company Overview
- 26.1.3.2. Products
- 26.1.3.3. Company Financials
- 26.1.3.4. SWOT Analysis
- 26.1.4 Hunan Shizhuyuan Nonferrous Metals Co Ltd
- 26.1.4.1. Company Overview
- 26.1.4.2. Products
- 26.1.4.3. Company Financials
- 26.1.4.4. SWOT Analysis
- 26.1.5 VIAVI Solutions Inc
- 26.1.5.1. Company Overview
- 26.1.5.2. Products
- 26.1.5.3. Company Financials
- 26.1.5.4. SWOT Analysis
- 26.1.6 BASF SE
- 26.1.6.1. Company Overview
- 26.1.6.2. Products
- 26.1.6.3. Company Financials
- 26.1.6.4. SWOT Analysis
- 26.1.7 Industrias Peñoles
- 26.1.7.1. Company Overview
- 26.1.7.2. Products
- 26.1.7.3. Company Financials
- 26.1.7.4. SWOT Analysis
- 26.1.8 Fortune Minerals
- 26.1.8.1. Company Overview
- 26.1.8.2. Products
- 26.1.8.3. Company Financials
- 26.1.8.4. SWOT Analysis
- 26.1.9 Xianyang Yuehua Bismuth Co Ltd *List Not Exhaustive
- 26.1.9.1. Company Overview
- 26.1.9.2. Products
- 26.1.9.3. Company Financials
- 26.1.9.4. SWOT Analysis
- 26.1.10 Par Pharmaceutical (Endo International plc)
- 26.1.10.1. Company Overview
- 26.1.10.2. Products
- 26.1.10.3. Company Financials
- 26.1.10.4. SWOT Analysis
- 26.1.1 Nui Phao Mining Company Limited
- 26.2. Market Entropy
- 26.2.1 Company's Key Areas Served
- 26.2.2 Recent Developments
- 26.3. Company Market Share Analysis 2025
- 26.3.1 Top 5 Companies Market Share Analysis
- 26.3.2 Top 3 Companies Market Share Analysis
- 26.4. List of Potential Customers
- 27. Research Methodology
List of Figures
- Figure 1: Global Bismuth Market Revenue Breakdown (million, %) by Region 2025 & 2033
- Figure 2: China Bismuth Market Revenue (million), by Derivatives 2025 & 2033
- Figure 3: China Bismuth Market Revenue Share (%), by Derivatives 2025 & 2033
- Figure 4: China Bismuth Market Revenue (million), by End-user Industry 2025 & 2033
- Figure 5: China Bismuth Market Revenue Share (%), by End-user Industry 2025 & 2033
- Figure 6: China Bismuth Market Revenue (million), by Country 2025 & 2033
- Figure 7: China Bismuth Market Revenue Share (%), by Country 2025 & 2033
- Figure 8: India Bismuth Market Revenue (million), by Derivatives 2025 & 2033
- Figure 9: India Bismuth Market Revenue Share (%), by Derivatives 2025 & 2033
- Figure 10: India Bismuth Market Revenue (million), by End-user Industry 2025 & 2033
- Figure 11: India Bismuth Market Revenue Share (%), by End-user Industry 2025 & 2033
- Figure 12: India Bismuth Market Revenue (million), by Country 2025 & 2033
- Figure 13: India Bismuth Market Revenue Share (%), by Country 2025 & 2033
- Figure 14: Japan Bismuth Market Revenue (million), by Derivatives 2025 & 2033
- Figure 15: Japan Bismuth Market Revenue Share (%), by Derivatives 2025 & 2033
- Figure 16: Japan Bismuth Market Revenue (million), by End-user Industry 2025 & 2033
- Figure 17: Japan Bismuth Market Revenue Share (%), by End-user Industry 2025 & 2033
- Figure 18: Japan Bismuth Market Revenue (million), by Country 2025 & 2033
- Figure 19: Japan Bismuth Market Revenue Share (%), by Country 2025 & 2033
- Figure 20: South Korea Bismuth Market Revenue (million), by Derivatives 2025 & 2033
- Figure 21: South Korea Bismuth Market Revenue Share (%), by Derivatives 2025 & 2033
- Figure 22: South Korea Bismuth Market Revenue (million), by End-user Industry 2025 & 2033
- Figure 23: South Korea Bismuth Market Revenue Share (%), by End-user Industry 2025 & 2033
- Figure 24: South Korea Bismuth Market Revenue (million), by Country 2025 & 2033
- Figure 25: South Korea Bismuth Market Revenue Share (%), by Country 2025 & 2033
- Figure 26: Rest of Asia Pacific Bismuth Market Revenue (million), by Derivatives 2025 & 2033
- Figure 27: Rest of Asia Pacific Bismuth Market Revenue Share (%), by Derivatives 2025 & 2033
- Figure 28: Rest of Asia Pacific Bismuth Market Revenue (million), by End-user Industry 2025 & 2033
- Figure 29: Rest of Asia Pacific Bismuth Market Revenue Share (%), by End-user Industry 2025 & 2033
- Figure 30: Rest of Asia Pacific Bismuth Market Revenue (million), by Country 2025 & 2033
- Figure 31: Rest of Asia Pacific Bismuth Market Revenue Share (%), by Country 2025 & 2033
- Figure 32: United States Bismuth Market Revenue (million), by Derivatives 2025 & 2033
- Figure 33: United States Bismuth Market Revenue Share (%), by Derivatives 2025 & 2033
- Figure 34: United States Bismuth Market Revenue (million), by End-user Industry 2025 & 2033
- Figure 35: United States Bismuth Market Revenue Share (%), by End-user Industry 2025 & 2033
- Figure 36: United States Bismuth Market Revenue (million), by Country 2025 & 2033
- Figure 37: United States Bismuth Market Revenue Share (%), by Country 2025 & 2033
- Figure 38: Canada Bismuth Market Revenue (million), by Derivatives 2025 & 2033
- Figure 39: Canada Bismuth Market Revenue Share (%), by Derivatives 2025 & 2033
- Figure 40: Canada Bismuth Market Revenue (million), by End-user Industry 2025 & 2033
- Figure 41: Canada Bismuth Market Revenue Share (%), by End-user Industry 2025 & 2033
- Figure 42: Canada Bismuth Market Revenue (million), by Country 2025 & 2033
- Figure 43: Canada Bismuth Market Revenue Share (%), by Country 2025 & 2033
- Figure 44: Mexico Bismuth Market Revenue (million), by Derivatives 2025 & 2033
- Figure 45: Mexico Bismuth Market Revenue Share (%), by Derivatives 2025 & 2033
- Figure 46: Mexico Bismuth Market Revenue (million), by End-user Industry 2025 & 2033
- Figure 47: Mexico Bismuth Market Revenue Share (%), by End-user Industry 2025 & 2033
- Figure 48: Mexico Bismuth Market Revenue (million), by Country 2025 & 2033
- Figure 49: Mexico Bismuth Market Revenue Share (%), by Country 2025 & 2033
- Figure 50: Germany Bismuth Market Revenue (million), by Derivatives 2025 & 2033
- Figure 51: Germany Bismuth Market Revenue Share (%), by Derivatives 2025 & 2033
- Figure 52: Germany Bismuth Market Revenue (million), by End-user Industry 2025 & 2033
- Figure 53: Germany Bismuth Market Revenue Share (%), by End-user Industry 2025 & 2033
- Figure 54: Germany Bismuth Market Revenue (million), by Country 2025 & 2033
- Figure 55: Germany Bismuth Market Revenue Share (%), by Country 2025 & 2033
- Figure 56: United Kingdom Bismuth Market Revenue (million), by Derivatives 2025 & 2033
- Figure 57: United Kingdom Bismuth Market Revenue Share (%), by Derivatives 2025 & 2033
- Figure 58: United Kingdom Bismuth Market Revenue (million), by End-user Industry 2025 & 2033
- Figure 59: United Kingdom Bismuth Market Revenue Share (%), by End-user Industry 2025 & 2033
- Figure 60: United Kingdom Bismuth Market Revenue (million), by Country 2025 & 2033
- Figure 61: United Kingdom Bismuth Market Revenue Share (%), by Country 2025 & 2033
- Figure 62: Italy Bismuth Market Revenue (million), by Derivatives 2025 & 2033
- Figure 63: Italy Bismuth Market Revenue Share (%), by Derivatives 2025 & 2033
- Figure 64: Italy Bismuth Market Revenue (million), by End-user Industry 2025 & 2033
- Figure 65: Italy Bismuth Market Revenue Share (%), by End-user Industry 2025 & 2033
- Figure 66: Italy Bismuth Market Revenue (million), by Country 2025 & 2033
- Figure 67: Italy Bismuth Market Revenue Share (%), by Country 2025 & 2033
- Figure 68: France Bismuth Market Revenue (million), by Derivatives 2025 & 2033
- Figure 69: France Bismuth Market Revenue Share (%), by Derivatives 2025 & 2033
- Figure 70: France Bismuth Market Revenue (million), by End-user Industry 2025 & 2033
- Figure 71: France Bismuth Market Revenue Share (%), by End-user Industry 2025 & 2033
- Figure 72: France Bismuth Market Revenue (million), by Country 2025 & 2033
- Figure 73: France Bismuth Market Revenue Share (%), by Country 2025 & 2033
- Figure 74: Rest of Europe Bismuth Market Revenue (million), by Derivatives 2025 & 2033
- Figure 75: Rest of Europe Bismuth Market Revenue Share (%), by Derivatives 2025 & 2033
- Figure 76: Rest of Europe Bismuth Market Revenue (million), by End-user Industry 2025 & 2033
- Figure 77: Rest of Europe Bismuth Market Revenue Share (%), by End-user Industry 2025 & 2033
- Figure 78: Rest of Europe Bismuth Market Revenue (million), by Country 2025 & 2033
- Figure 79: Rest of Europe Bismuth Market Revenue Share (%), by Country 2025 & 2033
- Figure 80: Brazil Bismuth Market Revenue (million), by Derivatives 2025 & 2033
- Figure 81: Brazil Bismuth Market Revenue Share (%), by Derivatives 2025 & 2033
- Figure 82: Brazil Bismuth Market Revenue (million), by End-user Industry 2025 & 2033
- Figure 83: Brazil Bismuth Market Revenue Share (%), by End-user Industry 2025 & 2033
- Figure 84: Brazil Bismuth Market Revenue (million), by Country 2025 & 2033
- Figure 85: Brazil Bismuth Market Revenue Share (%), by Country 2025 & 2033
- Figure 86: Argentina Bismuth Market Revenue (million), by Derivatives 2025 & 2033
- Figure 87: Argentina Bismuth Market Revenue Share (%), by Derivatives 2025 & 2033
- Figure 88: Argentina Bismuth Market Revenue (million), by End-user Industry 2025 & 2033
- Figure 89: Argentina Bismuth Market Revenue Share (%), by End-user Industry 2025 & 2033
- Figure 90: Argentina Bismuth Market Revenue (million), by Country 2025 & 2033
- Figure 91: Argentina Bismuth Market Revenue Share (%), by Country 2025 & 2033
- Figure 92: Rest of South America Bismuth Market Revenue (million), by Derivatives 2025 & 2033
- Figure 93: Rest of South America Bismuth Market Revenue Share (%), by Derivatives 2025 & 2033
- Figure 94: Rest of South America Bismuth Market Revenue (million), by End-user Industry 2025 & 2033
- Figure 95: Rest of South America Bismuth Market Revenue Share (%), by End-user Industry 2025 & 2033
- Figure 96: Rest of South America Bismuth Market Revenue (million), by Country 2025 & 2033
- Figure 97: Rest of South America Bismuth Market Revenue Share (%), by Country 2025 & 2033
- Figure 98: Saudi Arabia Bismuth Market Revenue (million), by Derivatives 2025 & 2033
- Figure 99: Saudi Arabia Bismuth Market Revenue Share (%), by Derivatives 2025 & 2033
- Figure 100: Saudi Arabia Bismuth Market Revenue (million), by End-user Industry 2025 & 2033
- Figure 101: Saudi Arabia Bismuth Market Revenue Share (%), by End-user Industry 2025 & 2033
- Figure 102: Saudi Arabia Bismuth Market Revenue (million), by Country 2025 & 2033
- Figure 103: Saudi Arabia Bismuth Market Revenue Share (%), by Country 2025 & 2033
- Figure 104: South Africa Bismuth Market Revenue (million), by Derivatives 2025 & 2033
- Figure 105: South Africa Bismuth Market Revenue Share (%), by Derivatives 2025 & 2033
- Figure 106: South Africa Bismuth Market Revenue (million), by End-user Industry 2025 & 2033
- Figure 107: South Africa Bismuth Market Revenue Share (%), by End-user Industry 2025 & 2033
- Figure 108: South Africa Bismuth Market Revenue (million), by Country 2025 & 2033
- Figure 109: South Africa Bismuth Market Revenue Share (%), by Country 2025 & 2033
- Figure 110: Rest of Middle East and Africa Bismuth Market Revenue (million), by Derivatives 2025 & 2033
- Figure 111: Rest of Middle East and Africa Bismuth Market Revenue Share (%), by Derivatives 2025 & 2033
- Figure 112: Rest of Middle East and Africa Bismuth Market Revenue (million), by End-user Industry 2025 & 2033
- Figure 113: Rest of Middle East and Africa Bismuth Market Revenue Share (%), by End-user Industry 2025 & 2033
- Figure 114: Rest of Middle East and Africa Bismuth Market Revenue (million), by Country 2025 & 2033
- Figure 115: Rest of Middle East and Africa Bismuth Market Revenue Share (%), by Country 2025 & 2033
List of Tables
- Table 1: Global Bismuth Market Revenue million Forecast, by Derivatives 2020 & 2033
- Table 2: Global Bismuth Market Revenue million Forecast, by End-user Industry 2020 & 2033
- Table 3: Global Bismuth Market Revenue million Forecast, by Region 2020 & 2033
- Table 4: Global Bismuth Market Revenue million Forecast, by Derivatives 2020 & 2033
- Table 5: Global Bismuth Market Revenue million Forecast, by End-user Industry 2020 & 2033
- Table 6: Global Bismuth Market Revenue million Forecast, by Country 2020 & 2033
- Table 7: Global Bismuth Market Revenue million Forecast, by Derivatives 2020 & 2033
- Table 8: Global Bismuth Market Revenue million Forecast, by End-user Industry 2020 & 2033
- Table 9: Global Bismuth Market Revenue million Forecast, by Country 2020 & 2033
- Table 10: Global Bismuth Market Revenue million Forecast, by Derivatives 2020 & 2033
- Table 11: Global Bismuth Market Revenue million Forecast, by End-user Industry 2020 & 2033
- Table 12: Global Bismuth Market Revenue million Forecast, by Country 2020 & 2033
- Table 13: Global Bismuth Market Revenue million Forecast, by Derivatives 2020 & 2033
- Table 14: Global Bismuth Market Revenue million Forecast, by End-user Industry 2020 & 2033
- Table 15: Global Bismuth Market Revenue million Forecast, by Country 2020 & 2033
- Table 16: Global Bismuth Market Revenue million Forecast, by Derivatives 2020 & 2033
- Table 17: Global Bismuth Market Revenue million Forecast, by End-user Industry 2020 & 2033
- Table 18: Global Bismuth Market Revenue million Forecast, by Country 2020 & 2033
- Table 19: North America Bismuth Market Revenue (million) Forecast, by Application 2020 & 2033
- Table 20: Global Bismuth Market Revenue million Forecast, by Derivatives 2020 & 2033
- Table 21: Global Bismuth Market Revenue million Forecast, by End-user Industry 2020 & 2033
- Table 22: Global Bismuth Market Revenue million Forecast, by Country 2020 & 2033
- Table 23: Global Bismuth Market Revenue million Forecast, by Derivatives 2020 & 2033
- Table 24: Global Bismuth Market Revenue million Forecast, by End-user Industry 2020 & 2033
- Table 25: Global Bismuth Market Revenue million Forecast, by Country 2020 & 2033
- Table 26: Global Bismuth Market Revenue million Forecast, by Derivatives 2020 & 2033
- Table 27: Global Bismuth Market Revenue million Forecast, by End-user Industry 2020 & 2033
- Table 28: Global Bismuth Market Revenue million Forecast, by Country 2020 & 2033
- Table 29: Europe Bismuth Market Revenue (million) Forecast, by Application 2020 & 2033
- Table 30: Global Bismuth Market Revenue million Forecast, by Derivatives 2020 & 2033
- Table 31: Global Bismuth Market Revenue million Forecast, by End-user Industry 2020 & 2033
- Table 32: Global Bismuth Market Revenue million Forecast, by Country 2020 & 2033
- Table 33: Global Bismuth Market Revenue million Forecast, by Derivatives 2020 & 2033
- Table 34: Global Bismuth Market Revenue million Forecast, by End-user Industry 2020 & 2033
- Table 35: Global Bismuth Market Revenue million Forecast, by Country 2020 & 2033
- Table 36: Global Bismuth Market Revenue million Forecast, by Derivatives 2020 & 2033
- Table 37: Global Bismuth Market Revenue million Forecast, by End-user Industry 2020 & 2033
- Table 38: Global Bismuth Market Revenue million Forecast, by Country 2020 & 2033
- Table 39: Global Bismuth Market Revenue million Forecast, by Derivatives 2020 & 2033
- Table 40: Global Bismuth Market Revenue million Forecast, by End-user Industry 2020 & 2033
- Table 41: Global Bismuth Market Revenue million Forecast, by Country 2020 & 2033
- Table 42: Global Bismuth Market Revenue million Forecast, by Derivatives 2020 & 2033
- Table 43: Global Bismuth Market Revenue million Forecast, by End-user Industry 2020 & 2033
- Table 44: Global Bismuth Market Revenue million Forecast, by Country 2020 & 2033
- Table 45: South America Bismuth Market Revenue (million) Forecast, by Application 2020 & 2033
- Table 46: Global Bismuth Market Revenue million Forecast, by Derivatives 2020 & 2033
- Table 47: Global Bismuth Market Revenue million Forecast, by End-user Industry 2020 & 2033
- Table 48: Global Bismuth Market Revenue million Forecast, by Country 2020 & 2033
- Table 49: Global Bismuth Market Revenue million Forecast, by Derivatives 2020 & 2033
- Table 50: Global Bismuth Market Revenue million Forecast, by End-user Industry 2020 & 2033
- Table 51: Global Bismuth Market Revenue million Forecast, by Country 2020 & 2033
- Table 52: Global Bismuth Market Revenue million Forecast, by Derivatives 2020 & 2033
- Table 53: Global Bismuth Market Revenue million Forecast, by End-user Industry 2020 & 2033
- Table 54: Global Bismuth Market Revenue million Forecast, by Country 2020 & 2033
- Table 55: Middle East and Africa Bismuth Market Revenue (million) Forecast, by Application 2020 & 2033
- Table 56: Global Bismuth Market Revenue million Forecast, by Derivatives 2020 & 2033
- Table 57: Global Bismuth Market Revenue million Forecast, by End-user Industry 2020 & 2033
- Table 58: Global Bismuth Market Revenue million Forecast, by Country 2020 & 2033
- Table 59: Global Bismuth Market Revenue million Forecast, by Derivatives 2020 & 2033
- Table 60: Global Bismuth Market Revenue million Forecast, by End-user Industry 2020 & 2033
- Table 61: Global Bismuth Market Revenue million Forecast, by Country 2020 & 2033
- Table 62: Global Bismuth Market Revenue million Forecast, by Derivatives 2020 & 2033
- Table 63: Global Bismuth Market Revenue million Forecast, by End-user Industry 2020 & 2033
- Table 64: Global Bismuth Market Revenue million Forecast, by Country 2020 & 2033
Frequently Asked Questions
1. What is the projected Compound Annual Growth Rate (CAGR) of the Bismuth Market?
The projected CAGR is approximately 5.8%.
2. Which companies are prominent players in the Bismuth Market?
Key companies in the market include Nui Phao Mining Company Limited, 5N Plus, Merck KGaA, Hunan Shizhuyuan Nonferrous Metals Co Ltd, VIAVI Solutions Inc, BASF SE, Industrias Peñoles, Fortune Minerals, Xianyang Yuehua Bismuth Co Ltd *List Not Exhaustive, Par Pharmaceutical (Endo International plc).
3. What are the main segments of the Bismuth Market?
The market segments include Derivatives, End-user Industry.
4. Can you provide details about the market size?
The market size is estimated to be USD 454.7 million as of 2022.
5. What are some drivers contributing to market growth?
Growing Use of Bismuth in Automobile Industry to Protect Brake Linings; Widespread Use of Bismuth in the Pharmaceutical Industry.
6. What are the notable trends driving market growth?
Pharmaceuticals Industry to Dominate the Market.
7. Are there any restraints impacting market growth?
Harm Done to the Human Body by Working with Bismuth; Limited Use of Bismuth due to Other Cost-effective Options.
8. Can you provide examples of recent developments in the market?
March 2023: Endo International plc announced that one of their operating companies, Par Pharmaceutical, Inc., began shipping the first generic version of Allergan's Pylera® (bismuth subcitrate potassium, metronidazole, tetracycline hydrochloride) 140 mg, 125 mg and 125 mg capsules in the United States, following final approval from the U.S. Food and Drug Administration of its Abbreviated New Drug Application.
9. What pricing options are available for accessing the report?
Pricing options include single-user, multi-user, and enterprise licenses priced at USD 4750, USD 5250, and USD 8750 respectively.
10. Is the market size provided in terms of value or volume?
The market size is provided in terms of value, measured in million.
11. Are there any specific market keywords associated with the report?
Yes, the market keyword associated with the report is "Bismuth Market," which aids in identifying and referencing the specific market segment covered.
12. How do I determine which pricing option suits my needs best?
The pricing options vary based on user requirements and access needs. Individual users may opt for single-user licenses, while businesses requiring broader access may choose multi-user or enterprise licenses for cost-effective access to the report.
13. Are there any additional resources or data provided in the Bismuth Market report?
While the report offers comprehensive insights, it's advisable to review the specific contents or supplementary materials provided to ascertain if additional resources or data are available.
14. How can I stay updated on further developments or reports in the Bismuth Market?
To stay informed about further developments, trends, and reports in the Bismuth Market, consider subscribing to industry newsletters, following relevant companies and organizations, or regularly checking reputable industry news sources and publications.
Methodology
Step 1 - Identification of Relevant Samples Size from Population Database


Step 2 - Approaches for Defining Global Market Size (Value, Volume* & Price*)

Note*: In applicable scenarios
Step 3 - Data Sources
Primary Research
- Web Analytics
- Survey Reports
- Research Institute
- Latest Research Reports
- Opinion Leaders
Secondary Research
- Annual Reports
- White Paper
- Latest Press Release
- Industry Association
- Paid Database
- Investor Presentations

Step 4 - Data Triangulation
Involves using different sources of information in order to increase the validity of a study
These sources are likely to be stakeholders in a program - participants, other researchers, program staff, other community members, and so on.
Then we put all data in single framework & apply various statistical tools to find out the dynamic on the market.
During the analysis stage, feedback from the stakeholder groups would be compared to determine areas of agreement as well as areas of divergence