
Key Insights
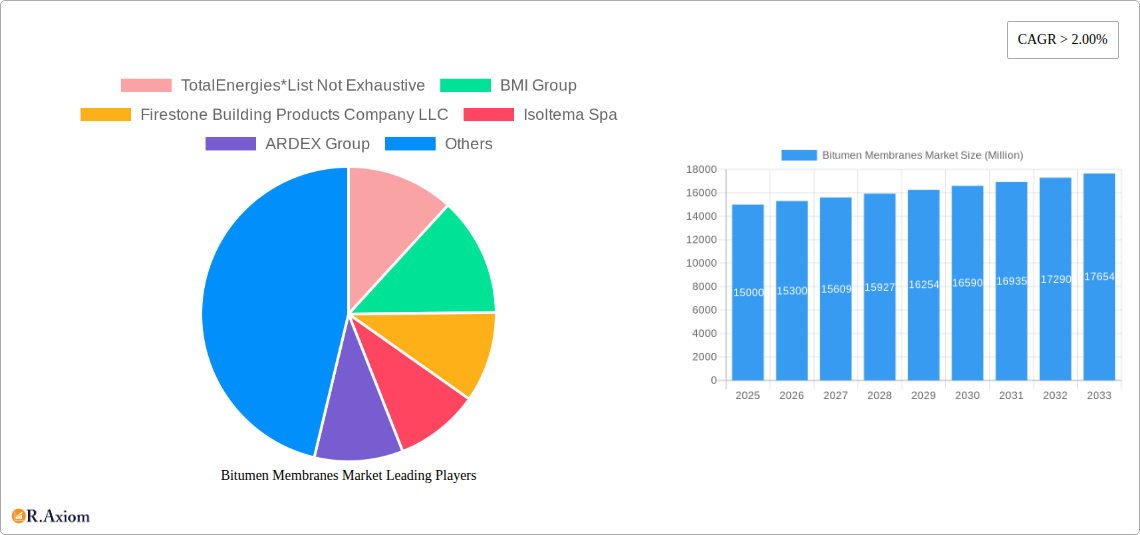
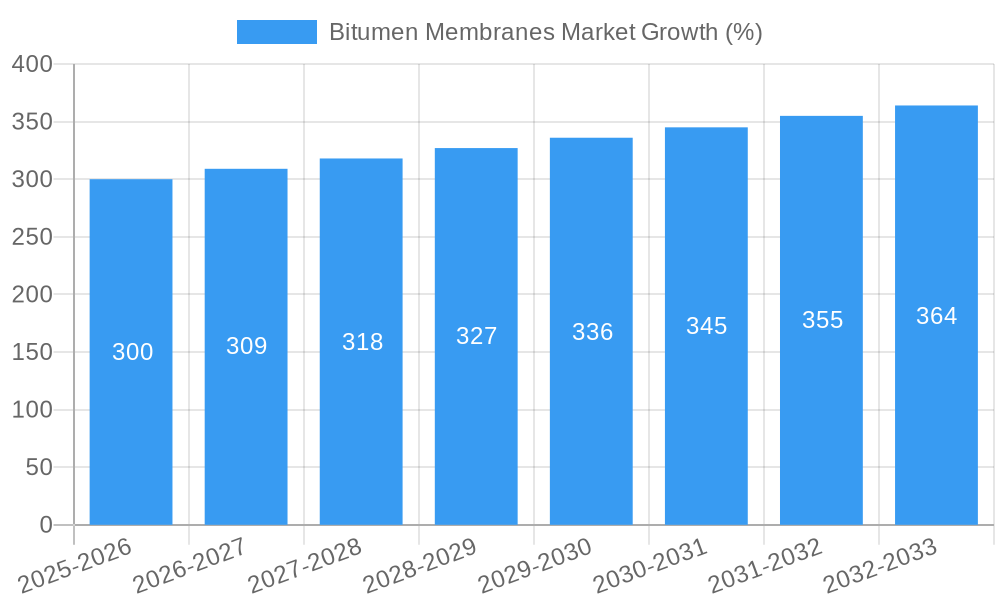
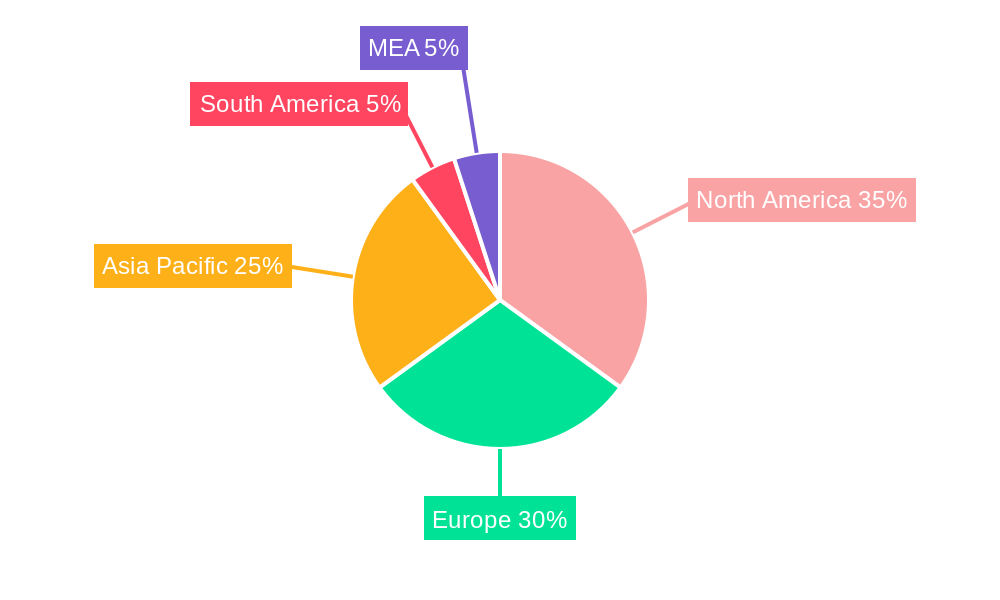
The Bitumen Membranes Market is experiencing robust growth, driven by the increasing demand for waterproofing solutions in the construction and automotive industries. The market's Compound Annual Growth Rate (CAGR) exceeding 2.0% indicates a steady expansion projected through 2033. Key drivers include the rising construction activities globally, particularly in developing economies experiencing rapid urbanization. Furthermore, the stringent building codes and regulations emphasizing energy efficiency and durability are boosting the adoption of bitumen membranes as a reliable waterproofing solution. Growth is further fueled by advancements in bitumen membrane technology, leading to improved performance characteristics like enhanced durability, flexibility, and resistance to extreme weather conditions. While the market faces challenges such as fluctuating bitumen prices and environmental concerns related to the material's carbon footprint, the overall outlook remains positive. The segmentation reveals that Atactic Polypropylene and Styrene-Butadiene-Styrene are significant contributors to the market, while sheets remain the dominant product type, driven by their ease of installation and application across diverse projects. Geographically, North America and Europe currently hold significant market shares, however, the Asia-Pacific region is expected to witness substantial growth due to escalating infrastructure development and industrialization. The competitive landscape includes both established players like TotalEnergies and BASF SE, and regional companies like Tiki Tar Industries India Ltd, indicating healthy competition and innovation within the market. Market projections suggest continued growth across all segments, with a potential shift towards more sustainable and environmentally friendly alternatives in the coming years.
The market's continued expansion relies on factors such as sustained infrastructure investments, evolving building technologies, and increasing awareness of the benefits of waterproofing solutions. Companies are likely to focus on product diversification, technological advancements, and strategic partnerships to maintain their competitive edge. While environmental concerns remain a challenge, the industry is actively exploring sustainable production processes and developing environmentally friendly bitumen alternatives, indicating a positive trend toward sustainability in the long term. Regional variations in growth will primarily reflect the pace of construction and infrastructural development in different parts of the world. Market analysis suggests a continued preference for high-performance bitumen membranes, particularly those providing superior durability and weather resistance, resulting in increased demand for specialized products across various end-user industries. The overall trajectory indicates a substantial growth opportunity within the Bitumen Membranes Market, promising significant expansion across various geographic regions and product segments.
Bitumen Membranes Market: A Comprehensive Analysis (2019-2033)
This in-depth report provides a comprehensive analysis of the global Bitumen Membranes Market, offering valuable insights for stakeholders across the value chain. The study covers the period 2019-2033, with 2025 serving as the base year and estimated year. The report segments the market by Grade (Atactic Polypropylene, Styrene-Butadiene-Styrene, Others), Product Type (Sheets, Liquids), and End-user Industry (Construction, Automotive, Others), offering granular data and forecasts for market size and growth. Key players like TotalEnergies, BMI Group, Firestone Building Products Company LLC, and others are profiled, providing a competitive landscape analysis.
Bitumen Membranes Market Concentration & Innovation
The Bitumen Membranes market exhibits a moderately consolidated structure, with a few major players holding significant market share. TotalEnergies, for example, commands an estimated xx% market share in 2025, reflecting its strong global presence and extensive product portfolio. However, the market also includes numerous smaller players, fostering a competitive landscape. Innovation is driven by the need for enhanced durability, waterproofing performance, and sustainability. This is evident in the increasing adoption of modified bitumen membranes incorporating polymers like atactic polypropylene and styrene-butadiene-styrene. Regulatory frameworks focusing on environmental impact and building codes significantly influence product development and market acceptance. The emergence of eco-friendly alternatives and substitutes, alongside fluctuating bitumen prices, shapes market dynamics. M&A activities have been moderate, with deal values totaling approximately xx Million in the last five years, primarily focused on expanding geographic reach and product portfolios. Key metrics for assessing market concentration include the Herfindahl-Hirschman Index (HHI) and the concentration ratio (CR4/CR8), with xx and xx respectively indicating moderate concentration in 2025.
Bitumen Membranes Market Industry Trends & Insights
The global Bitumen Membranes market is projected to experience a CAGR of xx% during the forecast period (2025-2033), driven by robust growth in the construction sector, particularly in emerging economies. Increasing urbanization and infrastructure development projects are major growth catalysts, boosting demand for waterproofing solutions. The market penetration of modified bitumen membranes, offering superior performance compared to traditional bitumen, is steadily rising, currently at xx% in 2025. Technological disruptions, such as the development of self-healing membranes and improved application techniques, are enhancing product efficiency and reducing installation costs. Consumer preferences are shifting toward sustainable and environmentally friendly products, prompting manufacturers to invest in research and development of eco-friendly alternatives. Competitive dynamics are characterized by pricing pressures, product differentiation, and efforts to expand distribution networks.
Dominant Markets & Segments in Bitumen Membranes Market
The Construction end-user segment dominates the Bitumen Membranes market, accounting for approximately xx% of the total market value in 2025. This is primarily attributed to the high demand for roofing, waterproofing, and infrastructure applications in the construction sector. Geographically, the Asia-Pacific region is the leading market, driven by rapid infrastructure development and urbanization in countries like China and India.
- Key Drivers in Asia-Pacific:
- Rapid urbanization and infrastructure development.
- Favorable government policies supporting construction activities.
- Rising disposable incomes leading to increased housing demand.
Among product types, Sheets hold a larger market share than liquids, primarily due to their ease of installation and suitability for various applications. In terms of grade, Styrene-Butadiene-Styrene (SBS) modified bitumen membranes are gaining popularity owing to their superior performance characteristics. The dominance of these segments is projected to continue throughout the forecast period, although the Others segment shows considerable growth potential driven by innovation and the introduction of new materials.
Bitumen Membranes Market Product Developments
Recent product innovations focus on enhanced durability, flexibility, and sustainability. Manufacturers are introducing modified bitumen membranes with improved resistance to UV radiation, weathering, and chemical attack. The integration of recycled materials and the development of bio-based bitumen alternatives are gaining traction, aligning with the growing focus on environmental sustainability. These advancements contribute to improved performance, extended lifespan, and reduced environmental impact, providing a competitive advantage in the market.
Report Scope & Segmentation Analysis
This report provides a detailed segmentation analysis of the Bitumen Membranes market based on grade, product type, and end-user industry. The Grade segment includes Atactic Polypropylene, Styrene-Butadiene-Styrene, and Others, each with distinct growth projections and competitive dynamics. Similarly, the Product Type segment covers Sheets and Liquids, while the End-user Industry segment comprises Construction, Automotive, and Others. Each segment's market size, growth rate, and key players are thoroughly analyzed, providing actionable insights for strategic decision-making.
Key Drivers of Bitumen Membranes Market Growth
The Bitumen Membranes market is driven by several factors, including the robust growth of the construction industry globally, particularly in developing economies. Government initiatives promoting infrastructure development and housing projects significantly contribute to market expansion. Furthermore, technological advancements leading to improved product performance and sustainability enhance market appeal. Stringent building codes and regulations emphasizing waterproofing solutions also drive market growth.
Challenges in the Bitumen Membranes Market Sector
The Bitumen Membranes market faces challenges such as price volatility of raw materials, particularly bitumen, impacting manufacturing costs and profitability. Supply chain disruptions and logistical complexities can affect the timely availability of products. Increased competition from alternative waterproofing materials, coupled with stringent environmental regulations, presents additional challenges. These factors can limit market growth if not effectively addressed.
Emerging Opportunities in Bitumen Membranes Market
Emerging opportunities lie in the development and adoption of sustainable and eco-friendly bitumen membranes. The growing focus on green building practices creates a demand for environmentally conscious solutions. Moreover, expansion into new and emerging markets, particularly in developing economies with robust infrastructure development plans, presents significant growth potential. The exploration of novel applications, such as in renewable energy infrastructure, offers further market expansion avenues.
Leading Players in the Bitumen Membranes Market Market
- TotalEnergies
- BMI Group
- Firestone Building Products Company LLC
- Isoltema Spa
- ARDEX Group
- BASF SE
- IKO PLC
- Sika AG
- Bondall
- Tiki Tar Industries India Ltd
- SOPREMA S A S
Key Developments in Bitumen Membranes Market Industry
- 2024 Q4: TotalEnergies launched a new range of sustainable bitumen membranes.
- 2023 Q3: BMI Group acquired a smaller waterproofing membrane manufacturer, expanding its market reach.
- 2022 Q2: Sika AG invested heavily in R&D for self-healing bitumen membranes. (Further developments to be added)
Strategic Outlook for Bitumen Membranes Market Market
The Bitumen Membranes market is poised for sustained growth over the forecast period, fueled by continuous urbanization and infrastructure development globally. Technological innovations driving improved performance and sustainability will further enhance market prospects. Strategic collaborations, mergers, and acquisitions are likely to shape the competitive landscape. Companies focused on innovation, sustainability, and efficient supply chain management are expected to gain a competitive advantage and capture significant market share in the years to come.
Bitumen Membranes Market Segmentation
-
1. Grade
- 1.1. Atactic Polypropylene
- 1.2. Styrene-Butadiene-Styrene
- 1.3. Others
-
2. Product Type
- 2.1. Sheets
- 2.2. Liquids
-
3. End-user Industry
- 3.1. Construction
- 3.2. Automotive
- 3.3. Others
Bitumen Membranes Market Segmentation By Geography
-
1. Asia Pacific
- 1.1. China
- 1.2. India
- 1.3. Japan
- 1.4. South Korea
- 1.5. Malaysia
- 1.6. Thailand
- 1.7. Indonesia
- 1.8. Vietnam
- 1.9. Rest of Asia Pacific
-
2. North America
- 2.1. United States
- 2.2. Canada
- 2.3. Mexico
-
3. Europe
- 3.1. Germany
- 3.2. United Kingdom
- 3.3. France
- 3.4. Italy
- 3.5. Spain
- 3.6. Nordic
- 3.7. Turkey
- 3.8. Russia
- 3.9. Rest of Europe
-
4. South America
- 4.1. Brazil
- 4.2. Argentina
- 4.3. Colombia
- 4.4. Rest of South America
- 5. Middle East
-
6. Saudi Arabia
- 6.1. South Africa
- 6.2. Nigeria
- 6.3. Qatar
- 6.4. Egypt
- 6.5. United Arab Emirates
- 6.6. Rest of Middle East
Bitumen Membranes Market REPORT HIGHLIGHTS
| Aspects | Details |
|---|---|
| Study Period | 2019-2033 |
| Base Year | 2024 |
| Estimated Year | 2025 |
| Forecast Period | 2025-2033 |
| Historical Period | 2019-2024 |
| Growth Rate | CAGR of > 2.00% from 2019-2033 |
| Segmentation |
|
Table of Contents
- 1. Introduction
- 1.1. Research Scope
- 1.2. Market Segmentation
- 1.3. Research Methodology
- 1.4. Definitions and Assumptions
- 2. Executive Summary
- 2.1. Introduction
- 3. Market Dynamics
- 3.1. Introduction
- 3.2. Market Drivers
- 3.2.1. Growing Construction Activities in Asia-Pacific Region; Versatility of Membrane Applications; Other Drivers
- 3.3. Market Restrains
- 3.3.1. Potential Health and Environmental Issues; Others
- 3.4. Market Trends
- 3.4.1. Construction Industry to Dominate the Demand
- 4. Market Factor Analysis
- 4.1. Porters Five Forces
- 4.2. Supply/Value Chain
- 4.3. PESTEL analysis
- 4.4. Market Entropy
- 4.5. Patent/Trademark Analysis
- 5. Global Bitumen Membranes Market Analysis, Insights and Forecast, 2019-2031
- 5.1. Market Analysis, Insights and Forecast - by Grade
- 5.1.1. Atactic Polypropylene
- 5.1.2. Styrene-Butadiene-Styrene
- 5.1.3. Others
- 5.2. Market Analysis, Insights and Forecast - by Product Type
- 5.2.1. Sheets
- 5.2.2. Liquids
- 5.3. Market Analysis, Insights and Forecast - by End-user Industry
- 5.3.1. Construction
- 5.3.2. Automotive
- 5.3.3. Others
- 5.4. Market Analysis, Insights and Forecast - by Region
- 5.4.1. Asia Pacific
- 5.4.2. North America
- 5.4.3. Europe
- 5.4.4. South America
- 5.4.5. Middle East
- 5.4.6. Saudi Arabia
- 5.1. Market Analysis, Insights and Forecast - by Grade
- 6. Asia Pacific Bitumen Membranes Market Analysis, Insights and Forecast, 2019-2031
- 6.1. Market Analysis, Insights and Forecast - by Grade
- 6.1.1. Atactic Polypropylene
- 6.1.2. Styrene-Butadiene-Styrene
- 6.1.3. Others
- 6.2. Market Analysis, Insights and Forecast - by Product Type
- 6.2.1. Sheets
- 6.2.2. Liquids
- 6.3. Market Analysis, Insights and Forecast - by End-user Industry
- 6.3.1. Construction
- 6.3.2. Automotive
- 6.3.3. Others
- 6.1. Market Analysis, Insights and Forecast - by Grade
- 7. North America Bitumen Membranes Market Analysis, Insights and Forecast, 2019-2031
- 7.1. Market Analysis, Insights and Forecast - by Grade
- 7.1.1. Atactic Polypropylene
- 7.1.2. Styrene-Butadiene-Styrene
- 7.1.3. Others
- 7.2. Market Analysis, Insights and Forecast - by Product Type
- 7.2.1. Sheets
- 7.2.2. Liquids
- 7.3. Market Analysis, Insights and Forecast - by End-user Industry
- 7.3.1. Construction
- 7.3.2. Automotive
- 7.3.3. Others
- 7.1. Market Analysis, Insights and Forecast - by Grade
- 8. Europe Bitumen Membranes Market Analysis, Insights and Forecast, 2019-2031
- 8.1. Market Analysis, Insights and Forecast - by Grade
- 8.1.1. Atactic Polypropylene
- 8.1.2. Styrene-Butadiene-Styrene
- 8.1.3. Others
- 8.2. Market Analysis, Insights and Forecast - by Product Type
- 8.2.1. Sheets
- 8.2.2. Liquids
- 8.3. Market Analysis, Insights and Forecast - by End-user Industry
- 8.3.1. Construction
- 8.3.2. Automotive
- 8.3.3. Others
- 8.1. Market Analysis, Insights and Forecast - by Grade
- 9. South America Bitumen Membranes Market Analysis, Insights and Forecast, 2019-2031
- 9.1. Market Analysis, Insights and Forecast - by Grade
- 9.1.1. Atactic Polypropylene
- 9.1.2. Styrene-Butadiene-Styrene
- 9.1.3. Others
- 9.2. Market Analysis, Insights and Forecast - by Product Type
- 9.2.1. Sheets
- 9.2.2. Liquids
- 9.3. Market Analysis, Insights and Forecast - by End-user Industry
- 9.3.1. Construction
- 9.3.2. Automotive
- 9.3.3. Others
- 9.1. Market Analysis, Insights and Forecast - by Grade
- 10. Middle East Bitumen Membranes Market Analysis, Insights and Forecast, 2019-2031
- 10.1. Market Analysis, Insights and Forecast - by Grade
- 10.1.1. Atactic Polypropylene
- 10.1.2. Styrene-Butadiene-Styrene
- 10.1.3. Others
- 10.2. Market Analysis, Insights and Forecast - by Product Type
- 10.2.1. Sheets
- 10.2.2. Liquids
- 10.3. Market Analysis, Insights and Forecast - by End-user Industry
- 10.3.1. Construction
- 10.3.2. Automotive
- 10.3.3. Others
- 10.1. Market Analysis, Insights and Forecast - by Grade
- 11. Saudi Arabia Bitumen Membranes Market Analysis, Insights and Forecast, 2019-2031
- 11.1. Market Analysis, Insights and Forecast - by Grade
- 11.1.1. Atactic Polypropylene
- 11.1.2. Styrene-Butadiene-Styrene
- 11.1.3. Others
- 11.2. Market Analysis, Insights and Forecast - by Product Type
- 11.2.1. Sheets
- 11.2.2. Liquids
- 11.3. Market Analysis, Insights and Forecast - by End-user Industry
- 11.3.1. Construction
- 11.3.2. Automotive
- 11.3.3. Others
- 11.1. Market Analysis, Insights and Forecast - by Grade
- 12. North America Bitumen Membranes Market Analysis, Insights and Forecast, 2019-2031
- 12.1. Market Analysis, Insights and Forecast - By Country/Sub-region
- 12.1.1 United States
- 12.1.2 Canada
- 12.1.3 Mexico
- 13. Europe Bitumen Membranes Market Analysis, Insights and Forecast, 2019-2031
- 13.1. Market Analysis, Insights and Forecast - By Country/Sub-region
- 13.1.1 Germany
- 13.1.2 United Kingdom
- 13.1.3 France
- 13.1.4 Spain
- 13.1.5 Italy
- 13.1.6 Spain
- 13.1.7 Belgium
- 13.1.8 Netherland
- 13.1.9 Nordics
- 13.1.10 Rest of Europe
- 14. Asia Pacific Bitumen Membranes Market Analysis, Insights and Forecast, 2019-2031
- 14.1. Market Analysis, Insights and Forecast - By Country/Sub-region
- 14.1.1 China
- 14.1.2 Japan
- 14.1.3 India
- 14.1.4 South Korea
- 14.1.5 Southeast Asia
- 14.1.6 Australia
- 14.1.7 Indonesia
- 14.1.8 Phillipes
- 14.1.9 Singapore
- 14.1.10 Thailandc
- 14.1.11 Rest of Asia Pacific
- 15. South America Bitumen Membranes Market Analysis, Insights and Forecast, 2019-2031
- 15.1. Market Analysis, Insights and Forecast - By Country/Sub-region
- 15.1.1 Brazil
- 15.1.2 Argentina
- 15.1.3 Peru
- 15.1.4 Chile
- 15.1.5 Colombia
- 15.1.6 Ecuador
- 15.1.7 Venezuela
- 15.1.8 Rest of South America
- 16. North America Bitumen Membranes Market Analysis, Insights and Forecast, 2019-2031
- 16.1. Market Analysis, Insights and Forecast - By Country/Sub-region
- 16.1.1 United States
- 16.1.2 Canada
- 16.1.3 Mexico
- 17. MEA Bitumen Membranes Market Analysis, Insights and Forecast, 2019-2031
- 17.1. Market Analysis, Insights and Forecast - By Country/Sub-region
- 17.1.1 United Arab Emirates
- 17.1.2 Saudi Arabia
- 17.1.3 South Africa
- 17.1.4 Rest of Middle East and Africa
- 18. Competitive Analysis
- 18.1. Global Market Share Analysis 2024
- 18.2. Company Profiles
- 18.2.1 TotalEnergies*List Not Exhaustive
- 18.2.1.1. Overview
- 18.2.1.2. Products
- 18.2.1.3. SWOT Analysis
- 18.2.1.4. Recent Developments
- 18.2.1.5. Financials (Based on Availability)
- 18.2.2 BMI Group
- 18.2.2.1. Overview
- 18.2.2.2. Products
- 18.2.2.3. SWOT Analysis
- 18.2.2.4. Recent Developments
- 18.2.2.5. Financials (Based on Availability)
- 18.2.3 Firestone Building Products Company LLC
- 18.2.3.1. Overview
- 18.2.3.2. Products
- 18.2.3.3. SWOT Analysis
- 18.2.3.4. Recent Developments
- 18.2.3.5. Financials (Based on Availability)
- 18.2.4 Isoltema Spa
- 18.2.4.1. Overview
- 18.2.4.2. Products
- 18.2.4.3. SWOT Analysis
- 18.2.4.4. Recent Developments
- 18.2.4.5. Financials (Based on Availability)
- 18.2.5 ARDEX Group
- 18.2.5.1. Overview
- 18.2.5.2. Products
- 18.2.5.3. SWOT Analysis
- 18.2.5.4. Recent Developments
- 18.2.5.5. Financials (Based on Availability)
- 18.2.6 BASF SE
- 18.2.6.1. Overview
- 18.2.6.2. Products
- 18.2.6.3. SWOT Analysis
- 18.2.6.4. Recent Developments
- 18.2.6.5. Financials (Based on Availability)
- 18.2.7 IKO PLC
- 18.2.7.1. Overview
- 18.2.7.2. Products
- 18.2.7.3. SWOT Analysis
- 18.2.7.4. Recent Developments
- 18.2.7.5. Financials (Based on Availability)
- 18.2.8 Sika AG
- 18.2.8.1. Overview
- 18.2.8.2. Products
- 18.2.8.3. SWOT Analysis
- 18.2.8.4. Recent Developments
- 18.2.8.5. Financials (Based on Availability)
- 18.2.9 Bondall
- 18.2.9.1. Overview
- 18.2.9.2. Products
- 18.2.9.3. SWOT Analysis
- 18.2.9.4. Recent Developments
- 18.2.9.5. Financials (Based on Availability)
- 18.2.10 Tiki Tar Industries India Ltd
- 18.2.10.1. Overview
- 18.2.10.2. Products
- 18.2.10.3. SWOT Analysis
- 18.2.10.4. Recent Developments
- 18.2.10.5. Financials (Based on Availability)
- 18.2.11 SOPREMA S A S
- 18.2.11.1. Overview
- 18.2.11.2. Products
- 18.2.11.3. SWOT Analysis
- 18.2.11.4. Recent Developments
- 18.2.11.5. Financials (Based on Availability)
- 18.2.1 TotalEnergies*List Not Exhaustive
List of Figures
- Figure 1: Global Bitumen Membranes Market Revenue Breakdown (Million, %) by Region 2024 & 2032
- Figure 2: Global Bitumen Membranes Market Volume Breakdown (Billion, %) by Region 2024 & 2032
- Figure 3: North America Bitumen Membranes Market Revenue (Million), by Country 2024 & 2032
- Figure 4: North America Bitumen Membranes Market Volume (Billion), by Country 2024 & 2032
- Figure 5: North America Bitumen Membranes Market Revenue Share (%), by Country 2024 & 2032
- Figure 6: North America Bitumen Membranes Market Volume Share (%), by Country 2024 & 2032
- Figure 7: Europe Bitumen Membranes Market Revenue (Million), by Country 2024 & 2032
- Figure 8: Europe Bitumen Membranes Market Volume (Billion), by Country 2024 & 2032
- Figure 9: Europe Bitumen Membranes Market Revenue Share (%), by Country 2024 & 2032
- Figure 10: Europe Bitumen Membranes Market Volume Share (%), by Country 2024 & 2032
- Figure 11: Asia Pacific Bitumen Membranes Market Revenue (Million), by Country 2024 & 2032
- Figure 12: Asia Pacific Bitumen Membranes Market Volume (Billion), by Country 2024 & 2032
- Figure 13: Asia Pacific Bitumen Membranes Market Revenue Share (%), by Country 2024 & 2032
- Figure 14: Asia Pacific Bitumen Membranes Market Volume Share (%), by Country 2024 & 2032
- Figure 15: South America Bitumen Membranes Market Revenue (Million), by Country 2024 & 2032
- Figure 16: South America Bitumen Membranes Market Volume (Billion), by Country 2024 & 2032
- Figure 17: South America Bitumen Membranes Market Revenue Share (%), by Country 2024 & 2032
- Figure 18: South America Bitumen Membranes Market Volume Share (%), by Country 2024 & 2032
- Figure 19: North America Bitumen Membranes Market Revenue (Million), by Country 2024 & 2032
- Figure 20: North America Bitumen Membranes Market Volume (Billion), by Country 2024 & 2032
- Figure 21: North America Bitumen Membranes Market Revenue Share (%), by Country 2024 & 2032
- Figure 22: North America Bitumen Membranes Market Volume Share (%), by Country 2024 & 2032
- Figure 23: MEA Bitumen Membranes Market Revenue (Million), by Country 2024 & 2032
- Figure 24: MEA Bitumen Membranes Market Volume (Billion), by Country 2024 & 2032
- Figure 25: MEA Bitumen Membranes Market Revenue Share (%), by Country 2024 & 2032
- Figure 26: MEA Bitumen Membranes Market Volume Share (%), by Country 2024 & 2032
- Figure 27: Asia Pacific Bitumen Membranes Market Revenue (Million), by Grade 2024 & 2032
- Figure 28: Asia Pacific Bitumen Membranes Market Volume (Billion), by Grade 2024 & 2032
- Figure 29: Asia Pacific Bitumen Membranes Market Revenue Share (%), by Grade 2024 & 2032
- Figure 30: Asia Pacific Bitumen Membranes Market Volume Share (%), by Grade 2024 & 2032
- Figure 31: Asia Pacific Bitumen Membranes Market Revenue (Million), by Product Type 2024 & 2032
- Figure 32: Asia Pacific Bitumen Membranes Market Volume (Billion), by Product Type 2024 & 2032
- Figure 33: Asia Pacific Bitumen Membranes Market Revenue Share (%), by Product Type 2024 & 2032
- Figure 34: Asia Pacific Bitumen Membranes Market Volume Share (%), by Product Type 2024 & 2032
- Figure 35: Asia Pacific Bitumen Membranes Market Revenue (Million), by End-user Industry 2024 & 2032
- Figure 36: Asia Pacific Bitumen Membranes Market Volume (Billion), by End-user Industry 2024 & 2032
- Figure 37: Asia Pacific Bitumen Membranes Market Revenue Share (%), by End-user Industry 2024 & 2032
- Figure 38: Asia Pacific Bitumen Membranes Market Volume Share (%), by End-user Industry 2024 & 2032
- Figure 39: Asia Pacific Bitumen Membranes Market Revenue (Million), by Country 2024 & 2032
- Figure 40: Asia Pacific Bitumen Membranes Market Volume (Billion), by Country 2024 & 2032
- Figure 41: Asia Pacific Bitumen Membranes Market Revenue Share (%), by Country 2024 & 2032
- Figure 42: Asia Pacific Bitumen Membranes Market Volume Share (%), by Country 2024 & 2032
- Figure 43: North America Bitumen Membranes Market Revenue (Million), by Grade 2024 & 2032
- Figure 44: North America Bitumen Membranes Market Volume (Billion), by Grade 2024 & 2032
- Figure 45: North America Bitumen Membranes Market Revenue Share (%), by Grade 2024 & 2032
- Figure 46: North America Bitumen Membranes Market Volume Share (%), by Grade 2024 & 2032
- Figure 47: North America Bitumen Membranes Market Revenue (Million), by Product Type 2024 & 2032
- Figure 48: North America Bitumen Membranes Market Volume (Billion), by Product Type 2024 & 2032
- Figure 49: North America Bitumen Membranes Market Revenue Share (%), by Product Type 2024 & 2032
- Figure 50: North America Bitumen Membranes Market Volume Share (%), by Product Type 2024 & 2032
- Figure 51: North America Bitumen Membranes Market Revenue (Million), by End-user Industry 2024 & 2032
- Figure 52: North America Bitumen Membranes Market Volume (Billion), by End-user Industry 2024 & 2032
- Figure 53: North America Bitumen Membranes Market Revenue Share (%), by End-user Industry 2024 & 2032
- Figure 54: North America Bitumen Membranes Market Volume Share (%), by End-user Industry 2024 & 2032
- Figure 55: North America Bitumen Membranes Market Revenue (Million), by Country 2024 & 2032
- Figure 56: North America Bitumen Membranes Market Volume (Billion), by Country 2024 & 2032
- Figure 57: North America Bitumen Membranes Market Revenue Share (%), by Country 2024 & 2032
- Figure 58: North America Bitumen Membranes Market Volume Share (%), by Country 2024 & 2032
- Figure 59: Europe Bitumen Membranes Market Revenue (Million), by Grade 2024 & 2032
- Figure 60: Europe Bitumen Membranes Market Volume (Billion), by Grade 2024 & 2032
- Figure 61: Europe Bitumen Membranes Market Revenue Share (%), by Grade 2024 & 2032
- Figure 62: Europe Bitumen Membranes Market Volume Share (%), by Grade 2024 & 2032
- Figure 63: Europe Bitumen Membranes Market Revenue (Million), by Product Type 2024 & 2032
- Figure 64: Europe Bitumen Membranes Market Volume (Billion), by Product Type 2024 & 2032
- Figure 65: Europe Bitumen Membranes Market Revenue Share (%), by Product Type 2024 & 2032
- Figure 66: Europe Bitumen Membranes Market Volume Share (%), by Product Type 2024 & 2032
- Figure 67: Europe Bitumen Membranes Market Revenue (Million), by End-user Industry 2024 & 2032
- Figure 68: Europe Bitumen Membranes Market Volume (Billion), by End-user Industry 2024 & 2032
- Figure 69: Europe Bitumen Membranes Market Revenue Share (%), by End-user Industry 2024 & 2032
- Figure 70: Europe Bitumen Membranes Market Volume Share (%), by End-user Industry 2024 & 2032
- Figure 71: Europe Bitumen Membranes Market Revenue (Million), by Country 2024 & 2032
- Figure 72: Europe Bitumen Membranes Market Volume (Billion), by Country 2024 & 2032
- Figure 73: Europe Bitumen Membranes Market Revenue Share (%), by Country 2024 & 2032
- Figure 74: Europe Bitumen Membranes Market Volume Share (%), by Country 2024 & 2032
- Figure 75: South America Bitumen Membranes Market Revenue (Million), by Grade 2024 & 2032
- Figure 76: South America Bitumen Membranes Market Volume (Billion), by Grade 2024 & 2032
- Figure 77: South America Bitumen Membranes Market Revenue Share (%), by Grade 2024 & 2032
- Figure 78: South America Bitumen Membranes Market Volume Share (%), by Grade 2024 & 2032
- Figure 79: South America Bitumen Membranes Market Revenue (Million), by Product Type 2024 & 2032
- Figure 80: South America Bitumen Membranes Market Volume (Billion), by Product Type 2024 & 2032
- Figure 81: South America Bitumen Membranes Market Revenue Share (%), by Product Type 2024 & 2032
- Figure 82: South America Bitumen Membranes Market Volume Share (%), by Product Type 2024 & 2032
- Figure 83: South America Bitumen Membranes Market Revenue (Million), by End-user Industry 2024 & 2032
- Figure 84: South America Bitumen Membranes Market Volume (Billion), by End-user Industry 2024 & 2032
- Figure 85: South America Bitumen Membranes Market Revenue Share (%), by End-user Industry 2024 & 2032
- Figure 86: South America Bitumen Membranes Market Volume Share (%), by End-user Industry 2024 & 2032
- Figure 87: South America Bitumen Membranes Market Revenue (Million), by Country 2024 & 2032
- Figure 88: South America Bitumen Membranes Market Volume (Billion), by Country 2024 & 2032
- Figure 89: South America Bitumen Membranes Market Revenue Share (%), by Country 2024 & 2032
- Figure 90: South America Bitumen Membranes Market Volume Share (%), by Country 2024 & 2032
- Figure 91: Middle East Bitumen Membranes Market Revenue (Million), by Grade 2024 & 2032
- Figure 92: Middle East Bitumen Membranes Market Volume (Billion), by Grade 2024 & 2032
- Figure 93: Middle East Bitumen Membranes Market Revenue Share (%), by Grade 2024 & 2032
- Figure 94: Middle East Bitumen Membranes Market Volume Share (%), by Grade 2024 & 2032
- Figure 95: Middle East Bitumen Membranes Market Revenue (Million), by Product Type 2024 & 2032
- Figure 96: Middle East Bitumen Membranes Market Volume (Billion), by Product Type 2024 & 2032
- Figure 97: Middle East Bitumen Membranes Market Revenue Share (%), by Product Type 2024 & 2032
- Figure 98: Middle East Bitumen Membranes Market Volume Share (%), by Product Type 2024 & 2032
- Figure 99: Middle East Bitumen Membranes Market Revenue (Million), by End-user Industry 2024 & 2032
- Figure 100: Middle East Bitumen Membranes Market Volume (Billion), by End-user Industry 2024 & 2032
- Figure 101: Middle East Bitumen Membranes Market Revenue Share (%), by End-user Industry 2024 & 2032
- Figure 102: Middle East Bitumen Membranes Market Volume Share (%), by End-user Industry 2024 & 2032
- Figure 103: Middle East Bitumen Membranes Market Revenue (Million), by Country 2024 & 2032
- Figure 104: Middle East Bitumen Membranes Market Volume (Billion), by Country 2024 & 2032
- Figure 105: Middle East Bitumen Membranes Market Revenue Share (%), by Country 2024 & 2032
- Figure 106: Middle East Bitumen Membranes Market Volume Share (%), by Country 2024 & 2032
- Figure 107: Saudi Arabia Bitumen Membranes Market Revenue (Million), by Grade 2024 & 2032
- Figure 108: Saudi Arabia Bitumen Membranes Market Volume (Billion), by Grade 2024 & 2032
- Figure 109: Saudi Arabia Bitumen Membranes Market Revenue Share (%), by Grade 2024 & 2032
- Figure 110: Saudi Arabia Bitumen Membranes Market Volume Share (%), by Grade 2024 & 2032
- Figure 111: Saudi Arabia Bitumen Membranes Market Revenue (Million), by Product Type 2024 & 2032
- Figure 112: Saudi Arabia Bitumen Membranes Market Volume (Billion), by Product Type 2024 & 2032
- Figure 113: Saudi Arabia Bitumen Membranes Market Revenue Share (%), by Product Type 2024 & 2032
- Figure 114: Saudi Arabia Bitumen Membranes Market Volume Share (%), by Product Type 2024 & 2032
- Figure 115: Saudi Arabia Bitumen Membranes Market Revenue (Million), by End-user Industry 2024 & 2032
- Figure 116: Saudi Arabia Bitumen Membranes Market Volume (Billion), by End-user Industry 2024 & 2032
- Figure 117: Saudi Arabia Bitumen Membranes Market Revenue Share (%), by End-user Industry 2024 & 2032
- Figure 118: Saudi Arabia Bitumen Membranes Market Volume Share (%), by End-user Industry 2024 & 2032
- Figure 119: Saudi Arabia Bitumen Membranes Market Revenue (Million), by Country 2024 & 2032
- Figure 120: Saudi Arabia Bitumen Membranes Market Volume (Billion), by Country 2024 & 2032
- Figure 121: Saudi Arabia Bitumen Membranes Market Revenue Share (%), by Country 2024 & 2032
- Figure 122: Saudi Arabia Bitumen Membranes Market Volume Share (%), by Country 2024 & 2032
List of Tables
- Table 1: Global Bitumen Membranes Market Revenue Million Forecast, by Region 2019 & 2032
- Table 2: Global Bitumen Membranes Market Volume Billion Forecast, by Region 2019 & 2032
- Table 3: Global Bitumen Membranes Market Revenue Million Forecast, by Grade 2019 & 2032
- Table 4: Global Bitumen Membranes Market Volume Billion Forecast, by Grade 2019 & 2032
- Table 5: Global Bitumen Membranes Market Revenue Million Forecast, by Product Type 2019 & 2032
- Table 6: Global Bitumen Membranes Market Volume Billion Forecast, by Product Type 2019 & 2032
- Table 7: Global Bitumen Membranes Market Revenue Million Forecast, by End-user Industry 2019 & 2032
- Table 8: Global Bitumen Membranes Market Volume Billion Forecast, by End-user Industry 2019 & 2032
- Table 9: Global Bitumen Membranes Market Revenue Million Forecast, by Region 2019 & 2032
- Table 10: Global Bitumen Membranes Market Volume Billion Forecast, by Region 2019 & 2032
- Table 11: Global Bitumen Membranes Market Revenue Million Forecast, by Country 2019 & 2032
- Table 12: Global Bitumen Membranes Market Volume Billion Forecast, by Country 2019 & 2032
- Table 13: United States Bitumen Membranes Market Revenue (Million) Forecast, by Application 2019 & 2032
- Table 14: United States Bitumen Membranes Market Volume (Billion) Forecast, by Application 2019 & 2032
- Table 15: Canada Bitumen Membranes Market Revenue (Million) Forecast, by Application 2019 & 2032
- Table 16: Canada Bitumen Membranes Market Volume (Billion) Forecast, by Application 2019 & 2032
- Table 17: Mexico Bitumen Membranes Market Revenue (Million) Forecast, by Application 2019 & 2032
- Table 18: Mexico Bitumen Membranes Market Volume (Billion) Forecast, by Application 2019 & 2032
- Table 19: Global Bitumen Membranes Market Revenue Million Forecast, by Country 2019 & 2032
- Table 20: Global Bitumen Membranes Market Volume Billion Forecast, by Country 2019 & 2032
- Table 21: Germany Bitumen Membranes Market Revenue (Million) Forecast, by Application 2019 & 2032
- Table 22: Germany Bitumen Membranes Market Volume (Billion) Forecast, by Application 2019 & 2032
- Table 23: United Kingdom Bitumen Membranes Market Revenue (Million) Forecast, by Application 2019 & 2032
- Table 24: United Kingdom Bitumen Membranes Market Volume (Billion) Forecast, by Application 2019 & 2032
- Table 25: France Bitumen Membranes Market Revenue (Million) Forecast, by Application 2019 & 2032
- Table 26: France Bitumen Membranes Market Volume (Billion) Forecast, by Application 2019 & 2032
- Table 27: Spain Bitumen Membranes Market Revenue (Million) Forecast, by Application 2019 & 2032
- Table 28: Spain Bitumen Membranes Market Volume (Billion) Forecast, by Application 2019 & 2032
- Table 29: Italy Bitumen Membranes Market Revenue (Million) Forecast, by Application 2019 & 2032
- Table 30: Italy Bitumen Membranes Market Volume (Billion) Forecast, by Application 2019 & 2032
- Table 31: Spain Bitumen Membranes Market Revenue (Million) Forecast, by Application 2019 & 2032
- Table 32: Spain Bitumen Membranes Market Volume (Billion) Forecast, by Application 2019 & 2032
- Table 33: Belgium Bitumen Membranes Market Revenue (Million) Forecast, by Application 2019 & 2032
- Table 34: Belgium Bitumen Membranes Market Volume (Billion) Forecast, by Application 2019 & 2032
- Table 35: Netherland Bitumen Membranes Market Revenue (Million) Forecast, by Application 2019 & 2032
- Table 36: Netherland Bitumen Membranes Market Volume (Billion) Forecast, by Application 2019 & 2032
- Table 37: Nordics Bitumen Membranes Market Revenue (Million) Forecast, by Application 2019 & 2032
- Table 38: Nordics Bitumen Membranes Market Volume (Billion) Forecast, by Application 2019 & 2032
- Table 39: Rest of Europe Bitumen Membranes Market Revenue (Million) Forecast, by Application 2019 & 2032
- Table 40: Rest of Europe Bitumen Membranes Market Volume (Billion) Forecast, by Application 2019 & 2032
- Table 41: Global Bitumen Membranes Market Revenue Million Forecast, by Country 2019 & 2032
- Table 42: Global Bitumen Membranes Market Volume Billion Forecast, by Country 2019 & 2032
- Table 43: China Bitumen Membranes Market Revenue (Million) Forecast, by Application 2019 & 2032
- Table 44: China Bitumen Membranes Market Volume (Billion) Forecast, by Application 2019 & 2032
- Table 45: Japan Bitumen Membranes Market Revenue (Million) Forecast, by Application 2019 & 2032
- Table 46: Japan Bitumen Membranes Market Volume (Billion) Forecast, by Application 2019 & 2032
- Table 47: India Bitumen Membranes Market Revenue (Million) Forecast, by Application 2019 & 2032
- Table 48: India Bitumen Membranes Market Volume (Billion) Forecast, by Application 2019 & 2032
- Table 49: South Korea Bitumen Membranes Market Revenue (Million) Forecast, by Application 2019 & 2032
- Table 50: South Korea Bitumen Membranes Market Volume (Billion) Forecast, by Application 2019 & 2032
- Table 51: Southeast Asia Bitumen Membranes Market Revenue (Million) Forecast, by Application 2019 & 2032
- Table 52: Southeast Asia Bitumen Membranes Market Volume (Billion) Forecast, by Application 2019 & 2032
- Table 53: Australia Bitumen Membranes Market Revenue (Million) Forecast, by Application 2019 & 2032
- Table 54: Australia Bitumen Membranes Market Volume (Billion) Forecast, by Application 2019 & 2032
- Table 55: Indonesia Bitumen Membranes Market Revenue (Million) Forecast, by Application 2019 & 2032
- Table 56: Indonesia Bitumen Membranes Market Volume (Billion) Forecast, by Application 2019 & 2032
- Table 57: Phillipes Bitumen Membranes Market Revenue (Million) Forecast, by Application 2019 & 2032
- Table 58: Phillipes Bitumen Membranes Market Volume (Billion) Forecast, by Application 2019 & 2032
- Table 59: Singapore Bitumen Membranes Market Revenue (Million) Forecast, by Application 2019 & 2032
- Table 60: Singapore Bitumen Membranes Market Volume (Billion) Forecast, by Application 2019 & 2032
- Table 61: Thailandc Bitumen Membranes Market Revenue (Million) Forecast, by Application 2019 & 2032
- Table 62: Thailandc Bitumen Membranes Market Volume (Billion) Forecast, by Application 2019 & 2032
- Table 63: Rest of Asia Pacific Bitumen Membranes Market Revenue (Million) Forecast, by Application 2019 & 2032
- Table 64: Rest of Asia Pacific Bitumen Membranes Market Volume (Billion) Forecast, by Application 2019 & 2032
- Table 65: Global Bitumen Membranes Market Revenue Million Forecast, by Country 2019 & 2032
- Table 66: Global Bitumen Membranes Market Volume Billion Forecast, by Country 2019 & 2032
- Table 67: Brazil Bitumen Membranes Market Revenue (Million) Forecast, by Application 2019 & 2032
- Table 68: Brazil Bitumen Membranes Market Volume (Billion) Forecast, by Application 2019 & 2032
- Table 69: Argentina Bitumen Membranes Market Revenue (Million) Forecast, by Application 2019 & 2032
- Table 70: Argentina Bitumen Membranes Market Volume (Billion) Forecast, by Application 2019 & 2032
- Table 71: Peru Bitumen Membranes Market Revenue (Million) Forecast, by Application 2019 & 2032
- Table 72: Peru Bitumen Membranes Market Volume (Billion) Forecast, by Application 2019 & 2032
- Table 73: Chile Bitumen Membranes Market Revenue (Million) Forecast, by Application 2019 & 2032
- Table 74: Chile Bitumen Membranes Market Volume (Billion) Forecast, by Application 2019 & 2032
- Table 75: Colombia Bitumen Membranes Market Revenue (Million) Forecast, by Application 2019 & 2032
- Table 76: Colombia Bitumen Membranes Market Volume (Billion) Forecast, by Application 2019 & 2032
- Table 77: Ecuador Bitumen Membranes Market Revenue (Million) Forecast, by Application 2019 & 2032
- Table 78: Ecuador Bitumen Membranes Market Volume (Billion) Forecast, by Application 2019 & 2032
- Table 79: Venezuela Bitumen Membranes Market Revenue (Million) Forecast, by Application 2019 & 2032
- Table 80: Venezuela Bitumen Membranes Market Volume (Billion) Forecast, by Application 2019 & 2032
- Table 81: Rest of South America Bitumen Membranes Market Revenue (Million) Forecast, by Application 2019 & 2032
- Table 82: Rest of South America Bitumen Membranes Market Volume (Billion) Forecast, by Application 2019 & 2032
- Table 83: Global Bitumen Membranes Market Revenue Million Forecast, by Country 2019 & 2032
- Table 84: Global Bitumen Membranes Market Volume Billion Forecast, by Country 2019 & 2032
- Table 85: United States Bitumen Membranes Market Revenue (Million) Forecast, by Application 2019 & 2032
- Table 86: United States Bitumen Membranes Market Volume (Billion) Forecast, by Application 2019 & 2032
- Table 87: Canada Bitumen Membranes Market Revenue (Million) Forecast, by Application 2019 & 2032
- Table 88: Canada Bitumen Membranes Market Volume (Billion) Forecast, by Application 2019 & 2032
- Table 89: Mexico Bitumen Membranes Market Revenue (Million) Forecast, by Application 2019 & 2032
- Table 90: Mexico Bitumen Membranes Market Volume (Billion) Forecast, by Application 2019 & 2032
- Table 91: Global Bitumen Membranes Market Revenue Million Forecast, by Country 2019 & 2032
- Table 92: Global Bitumen Membranes Market Volume Billion Forecast, by Country 2019 & 2032
- Table 93: United Arab Emirates Bitumen Membranes Market Revenue (Million) Forecast, by Application 2019 & 2032
- Table 94: United Arab Emirates Bitumen Membranes Market Volume (Billion) Forecast, by Application 2019 & 2032
- Table 95: Saudi Arabia Bitumen Membranes Market Revenue (Million) Forecast, by Application 2019 & 2032
- Table 96: Saudi Arabia Bitumen Membranes Market Volume (Billion) Forecast, by Application 2019 & 2032
- Table 97: South Africa Bitumen Membranes Market Revenue (Million) Forecast, by Application 2019 & 2032
- Table 98: South Africa Bitumen Membranes Market Volume (Billion) Forecast, by Application 2019 & 2032
- Table 99: Rest of Middle East and Africa Bitumen Membranes Market Revenue (Million) Forecast, by Application 2019 & 2032
- Table 100: Rest of Middle East and Africa Bitumen Membranes Market Volume (Billion) Forecast, by Application 2019 & 2032
- Table 101: Global Bitumen Membranes Market Revenue Million Forecast, by Grade 2019 & 2032
- Table 102: Global Bitumen Membranes Market Volume Billion Forecast, by Grade 2019 & 2032
- Table 103: Global Bitumen Membranes Market Revenue Million Forecast, by Product Type 2019 & 2032
- Table 104: Global Bitumen Membranes Market Volume Billion Forecast, by Product Type 2019 & 2032
- Table 105: Global Bitumen Membranes Market Revenue Million Forecast, by End-user Industry 2019 & 2032
- Table 106: Global Bitumen Membranes Market Volume Billion Forecast, by End-user Industry 2019 & 2032
- Table 107: Global Bitumen Membranes Market Revenue Million Forecast, by Country 2019 & 2032
- Table 108: Global Bitumen Membranes Market Volume Billion Forecast, by Country 2019 & 2032
- Table 109: China Bitumen Membranes Market Revenue (Million) Forecast, by Application 2019 & 2032
- Table 110: China Bitumen Membranes Market Volume (Billion) Forecast, by Application 2019 & 2032
- Table 111: India Bitumen Membranes Market Revenue (Million) Forecast, by Application 2019 & 2032
- Table 112: India Bitumen Membranes Market Volume (Billion) Forecast, by Application 2019 & 2032
- Table 113: Japan Bitumen Membranes Market Revenue (Million) Forecast, by Application 2019 & 2032
- Table 114: Japan Bitumen Membranes Market Volume (Billion) Forecast, by Application 2019 & 2032
- Table 115: South Korea Bitumen Membranes Market Revenue (Million) Forecast, by Application 2019 & 2032
- Table 116: South Korea Bitumen Membranes Market Volume (Billion) Forecast, by Application 2019 & 2032
- Table 117: Malaysia Bitumen Membranes Market Revenue (Million) Forecast, by Application 2019 & 2032
- Table 118: Malaysia Bitumen Membranes Market Volume (Billion) Forecast, by Application 2019 & 2032
- Table 119: Thailand Bitumen Membranes Market Revenue (Million) Forecast, by Application 2019 & 2032
- Table 120: Thailand Bitumen Membranes Market Volume (Billion) Forecast, by Application 2019 & 2032
- Table 121: Indonesia Bitumen Membranes Market Revenue (Million) Forecast, by Application 2019 & 2032
- Table 122: Indonesia Bitumen Membranes Market Volume (Billion) Forecast, by Application 2019 & 2032
- Table 123: Vietnam Bitumen Membranes Market Revenue (Million) Forecast, by Application 2019 & 2032
- Table 124: Vietnam Bitumen Membranes Market Volume (Billion) Forecast, by Application 2019 & 2032
- Table 125: Rest of Asia Pacific Bitumen Membranes Market Revenue (Million) Forecast, by Application 2019 & 2032
- Table 126: Rest of Asia Pacific Bitumen Membranes Market Volume (Billion) Forecast, by Application 2019 & 2032
- Table 127: Global Bitumen Membranes Market Revenue Million Forecast, by Grade 2019 & 2032
- Table 128: Global Bitumen Membranes Market Volume Billion Forecast, by Grade 2019 & 2032
- Table 129: Global Bitumen Membranes Market Revenue Million Forecast, by Product Type 2019 & 2032
- Table 130: Global Bitumen Membranes Market Volume Billion Forecast, by Product Type 2019 & 2032
- Table 131: Global Bitumen Membranes Market Revenue Million Forecast, by End-user Industry 2019 & 2032
- Table 132: Global Bitumen Membranes Market Volume Billion Forecast, by End-user Industry 2019 & 2032
- Table 133: Global Bitumen Membranes Market Revenue Million Forecast, by Country 2019 & 2032
- Table 134: Global Bitumen Membranes Market Volume Billion Forecast, by Country 2019 & 2032
- Table 135: United States Bitumen Membranes Market Revenue (Million) Forecast, by Application 2019 & 2032
- Table 136: United States Bitumen Membranes Market Volume (Billion) Forecast, by Application 2019 & 2032
- Table 137: Canada Bitumen Membranes Market Revenue (Million) Forecast, by Application 2019 & 2032
- Table 138: Canada Bitumen Membranes Market Volume (Billion) Forecast, by Application 2019 & 2032
- Table 139: Mexico Bitumen Membranes Market Revenue (Million) Forecast, by Application 2019 & 2032
- Table 140: Mexico Bitumen Membranes Market Volume (Billion) Forecast, by Application 2019 & 2032
- Table 141: Global Bitumen Membranes Market Revenue Million Forecast, by Grade 2019 & 2032
- Table 142: Global Bitumen Membranes Market Volume Billion Forecast, by Grade 2019 & 2032
- Table 143: Global Bitumen Membranes Market Revenue Million Forecast, by Product Type 2019 & 2032
- Table 144: Global Bitumen Membranes Market Volume Billion Forecast, by Product Type 2019 & 2032
- Table 145: Global Bitumen Membranes Market Revenue Million Forecast, by End-user Industry 2019 & 2032
- Table 146: Global Bitumen Membranes Market Volume Billion Forecast, by End-user Industry 2019 & 2032
- Table 147: Global Bitumen Membranes Market Revenue Million Forecast, by Country 2019 & 2032
- Table 148: Global Bitumen Membranes Market Volume Billion Forecast, by Country 2019 & 2032
- Table 149: Germany Bitumen Membranes Market Revenue (Million) Forecast, by Application 2019 & 2032
- Table 150: Germany Bitumen Membranes Market Volume (Billion) Forecast, by Application 2019 & 2032
- Table 151: United Kingdom Bitumen Membranes Market Revenue (Million) Forecast, by Application 2019 & 2032
- Table 152: United Kingdom Bitumen Membranes Market Volume (Billion) Forecast, by Application 2019 & 2032
- Table 153: France Bitumen Membranes Market Revenue (Million) Forecast, by Application 2019 & 2032
- Table 154: France Bitumen Membranes Market Volume (Billion) Forecast, by Application 2019 & 2032
- Table 155: Italy Bitumen Membranes Market Revenue (Million) Forecast, by Application 2019 & 2032
- Table 156: Italy Bitumen Membranes Market Volume (Billion) Forecast, by Application 2019 & 2032
- Table 157: Spain Bitumen Membranes Market Revenue (Million) Forecast, by Application 2019 & 2032
- Table 158: Spain Bitumen Membranes Market Volume (Billion) Forecast, by Application 2019 & 2032
- Table 159: Nordic Bitumen Membranes Market Revenue (Million) Forecast, by Application 2019 & 2032
- Table 160: Nordic Bitumen Membranes Market Volume (Billion) Forecast, by Application 2019 & 2032
- Table 161: Turkey Bitumen Membranes Market Revenue (Million) Forecast, by Application 2019 & 2032
- Table 162: Turkey Bitumen Membranes Market Volume (Billion) Forecast, by Application 2019 & 2032
- Table 163: Russia Bitumen Membranes Market Revenue (Million) Forecast, by Application 2019 & 2032
- Table 164: Russia Bitumen Membranes Market Volume (Billion) Forecast, by Application 2019 & 2032
- Table 165: Rest of Europe Bitumen Membranes Market Revenue (Million) Forecast, by Application 2019 & 2032
- Table 166: Rest of Europe Bitumen Membranes Market Volume (Billion) Forecast, by Application 2019 & 2032
- Table 167: Global Bitumen Membranes Market Revenue Million Forecast, by Grade 2019 & 2032
- Table 168: Global Bitumen Membranes Market Volume Billion Forecast, by Grade 2019 & 2032
- Table 169: Global Bitumen Membranes Market Revenue Million Forecast, by Product Type 2019 & 2032
- Table 170: Global Bitumen Membranes Market Volume Billion Forecast, by Product Type 2019 & 2032
- Table 171: Global Bitumen Membranes Market Revenue Million Forecast, by End-user Industry 2019 & 2032
- Table 172: Global Bitumen Membranes Market Volume Billion Forecast, by End-user Industry 2019 & 2032
- Table 173: Global Bitumen Membranes Market Revenue Million Forecast, by Country 2019 & 2032
- Table 174: Global Bitumen Membranes Market Volume Billion Forecast, by Country 2019 & 2032
- Table 175: Brazil Bitumen Membranes Market Revenue (Million) Forecast, by Application 2019 & 2032
- Table 176: Brazil Bitumen Membranes Market Volume (Billion) Forecast, by Application 2019 & 2032
- Table 177: Argentina Bitumen Membranes Market Revenue (Million) Forecast, by Application 2019 & 2032
- Table 178: Argentina Bitumen Membranes Market Volume (Billion) Forecast, by Application 2019 & 2032
- Table 179: Colombia Bitumen Membranes Market Revenue (Million) Forecast, by Application 2019 & 2032
- Table 180: Colombia Bitumen Membranes Market Volume (Billion) Forecast, by Application 2019 & 2032
- Table 181: Rest of South America Bitumen Membranes Market Revenue (Million) Forecast, by Application 2019 & 2032
- Table 182: Rest of South America Bitumen Membranes Market Volume (Billion) Forecast, by Application 2019 & 2032
- Table 183: Global Bitumen Membranes Market Revenue Million Forecast, by Grade 2019 & 2032
- Table 184: Global Bitumen Membranes Market Volume Billion Forecast, by Grade 2019 & 2032
- Table 185: Global Bitumen Membranes Market Revenue Million Forecast, by Product Type 2019 & 2032
- Table 186: Global Bitumen Membranes Market Volume Billion Forecast, by Product Type 2019 & 2032
- Table 187: Global Bitumen Membranes Market Revenue Million Forecast, by End-user Industry 2019 & 2032
- Table 188: Global Bitumen Membranes Market Volume Billion Forecast, by End-user Industry 2019 & 2032
- Table 189: Global Bitumen Membranes Market Revenue Million Forecast, by Country 2019 & 2032
- Table 190: Global Bitumen Membranes Market Volume Billion Forecast, by Country 2019 & 2032
- Table 191: Global Bitumen Membranes Market Revenue Million Forecast, by Grade 2019 & 2032
- Table 192: Global Bitumen Membranes Market Volume Billion Forecast, by Grade 2019 & 2032
- Table 193: Global Bitumen Membranes Market Revenue Million Forecast, by Product Type 2019 & 2032
- Table 194: Global Bitumen Membranes Market Volume Billion Forecast, by Product Type 2019 & 2032
- Table 195: Global Bitumen Membranes Market Revenue Million Forecast, by End-user Industry 2019 & 2032
- Table 196: Global Bitumen Membranes Market Volume Billion Forecast, by End-user Industry 2019 & 2032
- Table 197: Global Bitumen Membranes Market Revenue Million Forecast, by Country 2019 & 2032
- Table 198: Global Bitumen Membranes Market Volume Billion Forecast, by Country 2019 & 2032
- Table 199: South Africa Bitumen Membranes Market Revenue (Million) Forecast, by Application 2019 & 2032
- Table 200: South Africa Bitumen Membranes Market Volume (Billion) Forecast, by Application 2019 & 2032
- Table 201: Nigeria Bitumen Membranes Market Revenue (Million) Forecast, by Application 2019 & 2032
- Table 202: Nigeria Bitumen Membranes Market Volume (Billion) Forecast, by Application 2019 & 2032
- Table 203: Qatar Bitumen Membranes Market Revenue (Million) Forecast, by Application 2019 & 2032
- Table 204: Qatar Bitumen Membranes Market Volume (Billion) Forecast, by Application 2019 & 2032
- Table 205: Egypt Bitumen Membranes Market Revenue (Million) Forecast, by Application 2019 & 2032
- Table 206: Egypt Bitumen Membranes Market Volume (Billion) Forecast, by Application 2019 & 2032
- Table 207: United Arab Emirates Bitumen Membranes Market Revenue (Million) Forecast, by Application 2019 & 2032
- Table 208: United Arab Emirates Bitumen Membranes Market Volume (Billion) Forecast, by Application 2019 & 2032
- Table 209: Rest of Middle East Bitumen Membranes Market Revenue (Million) Forecast, by Application 2019 & 2032
- Table 210: Rest of Middle East Bitumen Membranes Market Volume (Billion) Forecast, by Application 2019 & 2032
Frequently Asked Questions
1. What is the projected Compound Annual Growth Rate (CAGR) of the Bitumen Membranes Market?
The projected CAGR is approximately > 2.00%.
2. Which companies are prominent players in the Bitumen Membranes Market?
Key companies in the market include TotalEnergies*List Not Exhaustive, BMI Group, Firestone Building Products Company LLC, Isoltema Spa, ARDEX Group, BASF SE, IKO PLC, Sika AG, Bondall, Tiki Tar Industries India Ltd, SOPREMA S A S.
3. What are the main segments of the Bitumen Membranes Market?
The market segments include Grade, Product Type, End-user Industry.
4. Can you provide details about the market size?
The market size is estimated to be USD XX Million as of 2022.
5. What are some drivers contributing to market growth?
Growing Construction Activities in Asia-Pacific Region; Versatility of Membrane Applications; Other Drivers.
6. What are the notable trends driving market growth?
Construction Industry to Dominate the Demand.
7. Are there any restraints impacting market growth?
Potential Health and Environmental Issues; Others.
8. Can you provide examples of recent developments in the market?
N/A
9. What pricing options are available for accessing the report?
Pricing options include single-user, multi-user, and enterprise licenses priced at USD 4750, USD 5250, and USD 8750 respectively.
10. Is the market size provided in terms of value or volume?
The market size is provided in terms of value, measured in Million and volume, measured in Billion.
11. Are there any specific market keywords associated with the report?
Yes, the market keyword associated with the report is "Bitumen Membranes Market," which aids in identifying and referencing the specific market segment covered.
12. How do I determine which pricing option suits my needs best?
The pricing options vary based on user requirements and access needs. Individual users may opt for single-user licenses, while businesses requiring broader access may choose multi-user or enterprise licenses for cost-effective access to the report.
13. Are there any additional resources or data provided in the Bitumen Membranes Market report?
While the report offers comprehensive insights, it's advisable to review the specific contents or supplementary materials provided to ascertain if additional resources or data are available.
14. How can I stay updated on further developments or reports in the Bitumen Membranes Market?
To stay informed about further developments, trends, and reports in the Bitumen Membranes Market, consider subscribing to industry newsletters, following relevant companies and organizations, or regularly checking reputable industry news sources and publications.
Methodology
Step 1 - Identification of Relevant Samples Size from Population Database


Step 2 - Approaches for Defining Global Market Size (Value, Volume* & Price*)

Note*: In applicable scenarios
Step 3 - Data Sources
Primary Research
- Web Analytics
- Survey Reports
- Research Institute
- Latest Research Reports
- Opinion Leaders
Secondary Research
- Annual Reports
- White Paper
- Latest Press Release
- Industry Association
- Paid Database
- Investor Presentations

Step 4 - Data Triangulation
Involves using different sources of information in order to increase the validity of a study
These sources are likely to be stakeholders in a program - participants, other researchers, program staff, other community members, and so on.
Then we put all data in single framework & apply various statistical tools to find out the dynamic on the market.
During the analysis stage, feedback from the stakeholder groups would be compared to determine areas of agreement as well as areas of divergence


