Key Insights
The global bleaching clay market, valued at approximately $1.7 billion in 2025, is projected to experience robust growth, exhibiting a Compound Annual Growth Rate (CAGR) of 5.5% from 2025 to 2033. This expansion is propelled by increasing demand for refined vegetable oils and animal fats in the food and beverage industry, alongside the growing cosmetics and personal care sectors. The chemical industry's reliance on bleaching clays for various processes further fuels consumption. Activated bauxite and clays are experiencing high demand due to their superior bleaching efficiency and cost-effectiveness. The Asia-Pacific region, led by China and India, dominates the market due to its extensive food processing and manufacturing industries. However, stringent environmental regulations and fluctuating raw material prices present challenges. Emerging trends in sustainable bleaching agents and novel clay-based technologies offer growth opportunities. Companies are focusing on innovative product development, strategic partnerships, and geographic expansion. The North American market, driven by the United States, is expected to see steady growth, while Europe shows a moderate trajectory. South America and the Middle East & Africa present considerable untapped potential.
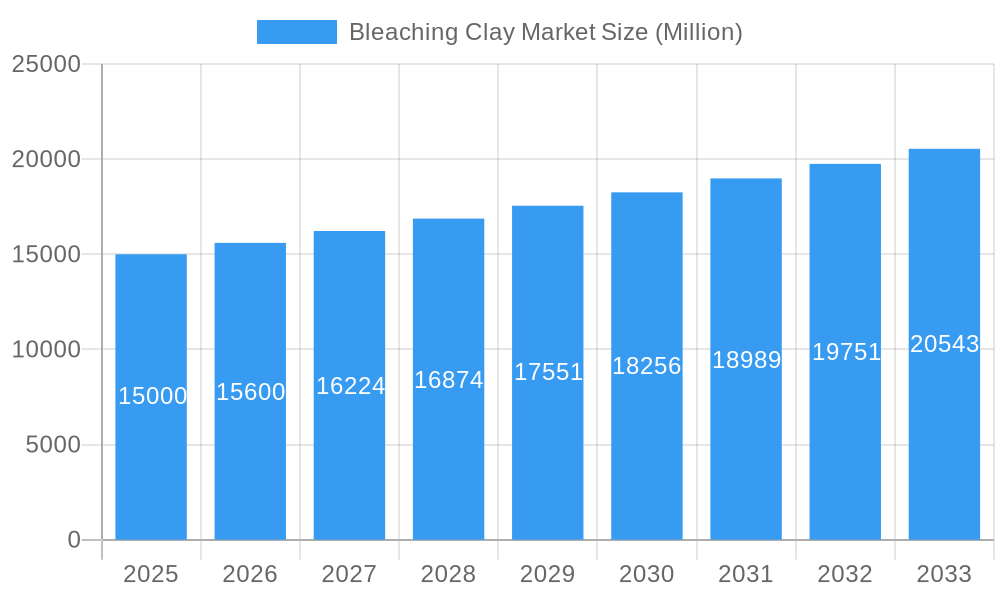
Bleaching Clay Market Market Size (In Billion)
Market segmentation reveals significant opportunities, with the activated bauxite segment holding a notable share due to its superior performance. The industrial oil application segment leads application-based segmentation, driven by high-volume oil refining. Major players like Clariant, Mineral Technologies Inc., and EP Minerals are investing in research and development. The competitive landscape is dynamic, characterized by multinational corporations and regional players, fostering both price competition and innovation. The food and beverage sector is the primary consumer of bleaching clays, followed by cosmetics and personal care. Future growth will be shaped by technological advancements in clay processing, the rise of sustainable practices, and the evolving regulatory landscape.
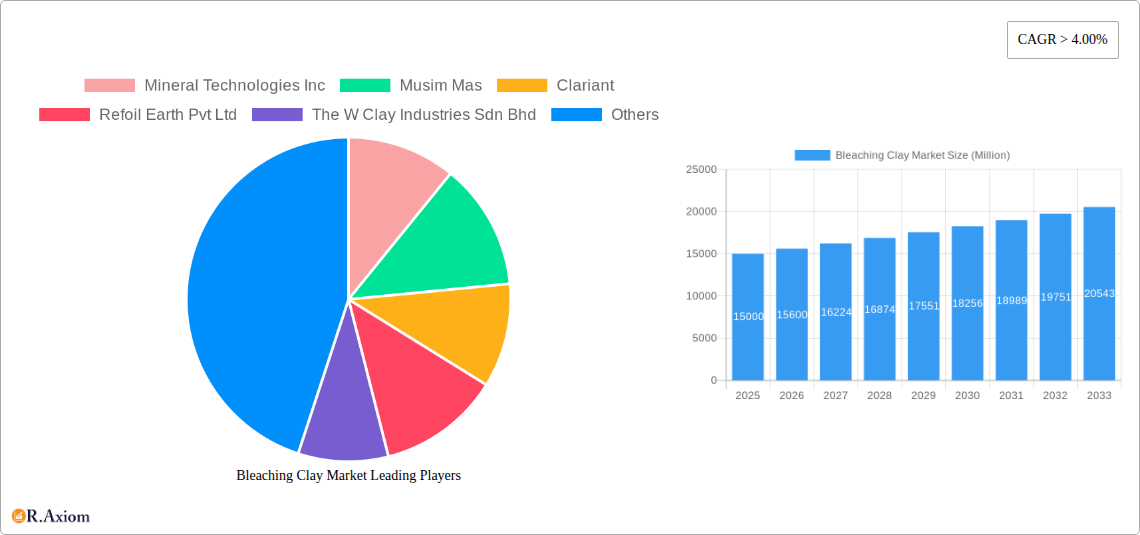
Bleaching Clay Market Company Market Share
Bleaching Clay Market Analysis: 2019-2033 Forecast
This comprehensive report offers an in-depth analysis of the global Bleaching Clay market, providing valuable insights for stakeholders, investors, and new entrants. The study covers the period from 2019 to 2033, with 2025 as the base and estimated year. It meticulously analyzes market dynamics, competitive landscape, and future growth prospects, delivering actionable intelligence. The market is segmented by type (Activated Bauxite, Activated Clays, Fuller's Earth), application (Industrial Oil, Mineral Oil and Waxes, Vegetable Oil and Animal Fats), and end-user industry (Food and Beverage, Cosmetics and Personal Care, Chemicals, Other End-user Industries). Key players include Mineral Technologies Inc, Musim Mas, Clariant, Refoil Earth Pvt Ltd, The W Clay Industries Sdn Bhd, HRP Industries, Ashapura Group, Oil-Dri Corporation of America, EP Minerals, and Taiko Clay Marketing Sdn Bhd. The report projects a market value of xx Million by 2033, exhibiting a CAGR of xx% during the forecast period (2025-2033).
Bleaching Clay Market Concentration & Innovation
The Bleaching Clay market exhibits a moderately consolidated structure, with the top five players holding an estimated xx% market share in 2025. Market concentration is influenced by factors such as economies of scale in production, access to raw materials, and established distribution networks. Innovation plays a pivotal role, driven by the need for higher efficiency, improved selectivity, and environmentally friendly bleaching solutions. Ongoing research focuses on developing clays with enhanced adsorption capacities, tailored pore structures, and reduced environmental impact. Regulatory frameworks, particularly concerning environmental regulations and safety standards for food and cosmetic applications, significantly impact market dynamics. Product substitutes, such as activated carbon and synthetic adsorbents, pose competitive pressure, although the unique properties of bleaching clay maintain its market relevance. End-user trends toward natural and sustainable products fuel demand for organically sourced and sustainably produced bleaching clays. Mergers and acquisitions (M&A) activity within the sector remains moderate, with deal values averaging xx Million in recent years. Notable M&A activities include [Insert specific examples of M&A activities with values if available, otherwise state "No significant M&A activities reported during the study period"].
Bleaching Clay Market Industry Trends & Insights
The Bleaching Clay market is experiencing significant growth, driven by robust demand from various end-use sectors, including food processing, cosmetics, and pharmaceuticals. The market is projected to reach xx Million by 2033, exhibiting a CAGR of xx% during the forecast period. Key growth drivers include the increasing demand for refined oils and fats, stringent quality standards in the food and beverage industry, and the growing popularity of natural and organic cosmetics. Technological disruptions, such as advancements in clay processing and modification techniques, are improving product performance and efficiency. Consumer preferences for natural and sustainable products are favoring organically sourced bleaching clays. Competitive dynamics are characterized by both price competition and differentiation based on product quality, performance, and sustainability. Market penetration of advanced bleaching clays, such as those with enhanced selectivity or tailored pore structures, is steadily increasing, reaching xx% in 2025.
Dominant Markets & Segments in Bleaching Clay Market
Leading Region: Asia Pacific is projected to remain the dominant region in the Bleaching Clay market throughout the forecast period, driven by robust growth in the food processing and cosmetics industries, coupled with increasing investments in infrastructure and economic development.
Leading Country: China is the leading country in the Asia Pacific region due to its large population, increasing disposable incomes, and burgeoning food and beverage sector.
Dominant Type Segment: Activated clays dominate the market owing to their superior adsorption capabilities and versatility across various applications.
Dominant Application Segment: The vegetable oil and animal fats application segment holds a significant market share owing to the large-scale demand from the food processing industry.
Dominant End-user Industry: The food and beverage industry is the primary end-user segment due to the strict purity standards in food products.
Key Drivers for Regional Dominance: Rapid industrialization, rising disposable incomes, and the strong presence of major players are driving the growth of the bleaching clay market in the Asia Pacific region, specifically in China. Government policies supporting food safety and quality further boost market expansion.
Bleaching Clay Market Product Developments
Recent product developments in the bleaching clay market focus on enhancing adsorption capacity, selectivity, and sustainability. Innovations include the development of modified clays with tailored pore structures for improved efficiency in specific applications. Companies are also focusing on the development of environmentally friendly bleaching clays with reduced environmental footprint. These advancements improve the market fit by meeting the increasing demand for high-quality, efficient, and sustainable bleaching solutions across diverse industries.
Report Scope & Segmentation Analysis
Type: The report segments the market by type into Activated Bauxite, Activated Clays, and Fuller's Earth. Activated Clays are projected to maintain the largest market share due to their versatility.
Application: The report categorizes the market by application into Industrial Oil, Mineral Oil and Waxes, and Vegetable Oil and Animal Fats. Vegetable Oil and Animal Fats are anticipated to witness faster growth.
End-user Industry: The market is further segmented by end-user industry into Food and Beverage, Cosmetics and Personal Care, Chemicals, and Other End-user Industries. The Food and Beverage sector is projected to dominate throughout the forecast period.
Key Drivers of Bleaching Clay Market Growth
The Bleaching Clay market's growth is propelled by several factors: rising demand for refined oils and fats in the food and beverage industry; increasing use in cosmetics and personal care due to consumer preference for natural products; stringent food safety regulations driving adoption; and advancements in clay processing technologies leading to enhanced performance.
Challenges in the Bleaching Clay Market Sector
Challenges include price volatility of raw materials; intense competition from alternative bleaching agents; stringent environmental regulations impacting production costs; and fluctuations in global oil and fat prices directly impacting the demand for bleaching clays. These factors can collectively impede market growth by xx% annually if not effectively addressed.
Emerging Opportunities in Bleaching Clay Market
Emerging opportunities lie in the exploration of novel applications in emerging economies; development of specialized clays for specific applications; increasing adoption of sustainable and environmentally friendly processing techniques; and growing demand for natural and organic products in cosmetics and food processing, creating new market segments and revenue streams.
Leading Players in the Bleaching Clay Market Market
- Mineral Technologies Inc
- Musim Mas
- Clariant
- Refoil Earth Pvt Ltd
- The W Clay Industries Sdn Bhd
- HRP Industries
- Ashapura Group
- Oil-Dri Corporation of America
- EP Minerals
- Taiko Clay Marketing Sdn Bhd
Key Developments in Bleaching Clay Market Industry
- 2022 Q3: Clariant launched a new line of sustainable bleaching clays.
- 2023 Q1: Mineral Technologies Inc. announced a strategic partnership to expand its distribution network.
- [Add more developments with dates and brief descriptions if available. If not, replace this section with "No significant developments reported during the study period."]
Strategic Outlook for Bleaching Clay Market Market
The Bleaching Clay market is poised for sustained growth, driven by increasing demand from key end-use sectors and technological advancements. Opportunities exist in expanding into new geographical markets, developing innovative products with enhanced performance and sustainability attributes, and leveraging strategic partnerships to strengthen market presence. Focus on sustainability and compliance with environmental regulations will be key to future success.
Bleaching Clay Market Segmentation
-
1. Type
- 1.1. Activated Bauxite
- 1.2. Activated Clays
- 1.3. Fuller's Earth
-
2. Application
- 2.1. Industrial Oil
- 2.2. Mineral Oil and Waxes
- 2.3. Vegetable Oil and Animal Fats
-
3. End-user Industry
- 3.1. Food and Beverage
- 3.2. Cosmetics and Personal Care
- 3.3. Chemicals
- 3.4. Other End-user Industries
Bleaching Clay Market Segmentation By Geography
-
1. Asia Pacific
- 1.1. China
- 1.2. India
- 1.3. Japan
- 1.4. South Korea
- 1.5. Rest of Asia Pacific
-
2. North America
- 2.1. United States
- 2.2. Canada
- 2.3. Mexico
-
3. Europe
- 3.1. Germany
- 3.2. United Kingdom
- 3.3. Italy
- 3.4. France
- 3.5. Rest of Europe
-
4. South America
- 4.1. Brazil
- 4.2. Argentina
- 4.3. Rest of South America
-
5. Middle East and Africa
- 5.1. Saudi Arabia
- 5.2. South Africa
- 5.3. Rest of Middle East and Africa
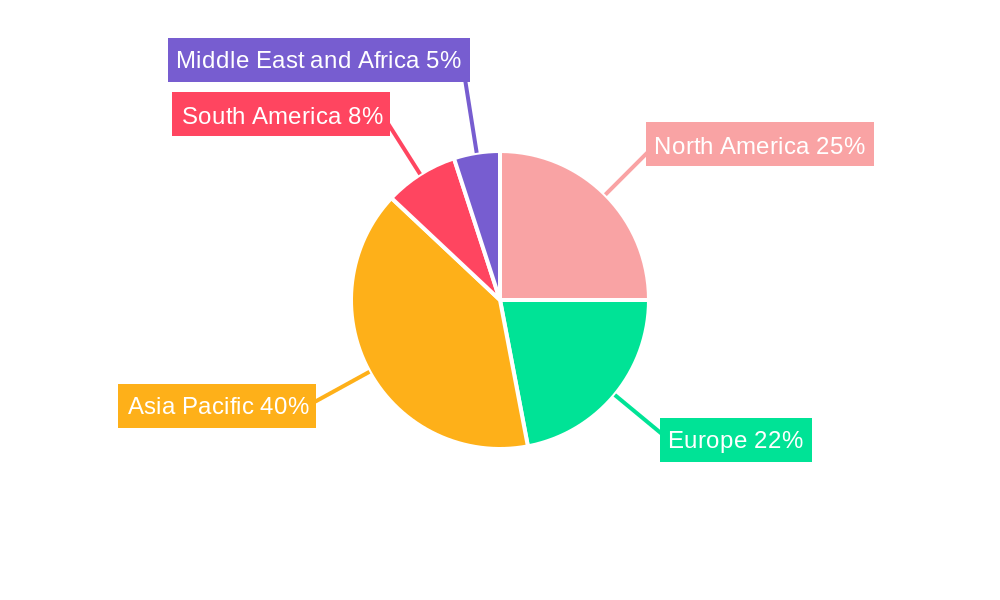
Bleaching Clay Market Regional Market Share
Geographic Coverage of Bleaching Clay Market
Bleaching Clay Market REPORT HIGHLIGHTS
| Aspects | Details |
|---|---|
| Study Period | 2020-2034 |
| Base Year | 2025 |
| Estimated Year | 2026 |
| Forecast Period | 2026-2034 |
| Historical Period | 2020-2025 |
| Growth Rate | CAGR of 5.5% from 2020-2034 |
| Segmentation |
|
Table of Contents
- 1. Introduction
- 1.1. Research Scope
- 1.2. Market Segmentation
- 1.3. Research Objective
- 1.4. Definitions and Assumptions
- 2. Executive Summary
- 2.1. Market Snapshot
- 3. Market Dynamics
- 3.1. Market Drivers
- 3.2. Market Restrains
- 3.3. Market Trends
- 3.4. Market Opportunities
- 4. Market Factor Analysis
- 4.1. Porters Five Forces
- 4.1.1. Bargaining Power of Suppliers
- 4.1.2. Bargaining Power of Buyers
- 4.1.3. Threat of New Entrants
- 4.1.4. Threat of Substitutes
- 4.1.5. Competitive Rivalry
- 4.2. PESTEL analysis
- 4.3. BCG Analysis
- 4.3.1. Stars (High Growth, High Market Share)
- 4.3.2. Cash Cows (Low Growth, High Market Share)
- 4.3.3. Question Mark (High Growth, Low Market Share)
- 4.3.4. Dogs (Low Growth, Low Market Share)
- 4.4. Ansoff Matrix Analysis
- 4.5. Supply Chain Analysis
- 4.6. Regulatory Landscape
- 4.7. Current Market Potential and Opportunity Assessment (TAM–SAM–SOM Framework)
- 4.8. RAX Analyst Note
- 4.1. Porters Five Forces
- 5. Market Analysis, Insights and Forecast 2021-2033
- 5.1. Market Analysis, Insights and Forecast - by Type
- 5.1.1. Activated Bauxite
- 5.1.2. Activated Clays
- 5.1.3. Fuller's Earth
- 5.2. Market Analysis, Insights and Forecast - by Application
- 5.2.1. Industrial Oil
- 5.2.2. Mineral Oil and Waxes
- 5.2.3. Vegetable Oil and Animal Fats
- 5.3. Market Analysis, Insights and Forecast - by End-user Industry
- 5.3.1. Food and Beverage
- 5.3.2. Cosmetics and Personal Care
- 5.3.3. Chemicals
- 5.3.4. Other End-user Industries
- 5.4. Market Analysis, Insights and Forecast - by Region
- 5.4.1. Asia Pacific
- 5.4.2. North America
- 5.4.3. Europe
- 5.4.4. South America
- 5.4.5. Middle East and Africa
- 5.1. Market Analysis, Insights and Forecast - by Type
- 6. Global Bleaching Clay Market Analysis, Insights and Forecast, 2021-2033
- 6.1. Market Analysis, Insights and Forecast - by Type
- 6.1.1. Activated Bauxite
- 6.1.2. Activated Clays
- 6.1.3. Fuller's Earth
- 6.2. Market Analysis, Insights and Forecast - by Application
- 6.2.1. Industrial Oil
- 6.2.2. Mineral Oil and Waxes
- 6.2.3. Vegetable Oil and Animal Fats
- 6.3. Market Analysis, Insights and Forecast - by End-user Industry
- 6.3.1. Food and Beverage
- 6.3.2. Cosmetics and Personal Care
- 6.3.3. Chemicals
- 6.3.4. Other End-user Industries
- 6.1. Market Analysis, Insights and Forecast - by Type
- 7. Asia Pacific Bleaching Clay Market Analysis, Insights and Forecast, 2020-2032
- 7.1. Market Analysis, Insights and Forecast - by Type
- 7.1.1. Activated Bauxite
- 7.1.2. Activated Clays
- 7.1.3. Fuller's Earth
- 7.2. Market Analysis, Insights and Forecast - by Application
- 7.2.1. Industrial Oil
- 7.2.2. Mineral Oil and Waxes
- 7.2.3. Vegetable Oil and Animal Fats
- 7.3. Market Analysis, Insights and Forecast - by End-user Industry
- 7.3.1. Food and Beverage
- 7.3.2. Cosmetics and Personal Care
- 7.3.3. Chemicals
- 7.3.4. Other End-user Industries
- 7.1. Market Analysis, Insights and Forecast - by Type
- 8. North America Bleaching Clay Market Analysis, Insights and Forecast, 2020-2032
- 8.1. Market Analysis, Insights and Forecast - by Type
- 8.1.1. Activated Bauxite
- 8.1.2. Activated Clays
- 8.1.3. Fuller's Earth
- 8.2. Market Analysis, Insights and Forecast - by Application
- 8.2.1. Industrial Oil
- 8.2.2. Mineral Oil and Waxes
- 8.2.3. Vegetable Oil and Animal Fats
- 8.3. Market Analysis, Insights and Forecast - by End-user Industry
- 8.3.1. Food and Beverage
- 8.3.2. Cosmetics and Personal Care
- 8.3.3. Chemicals
- 8.3.4. Other End-user Industries
- 8.1. Market Analysis, Insights and Forecast - by Type
- 9. Europe Bleaching Clay Market Analysis, Insights and Forecast, 2020-2032
- 9.1. Market Analysis, Insights and Forecast - by Type
- 9.1.1. Activated Bauxite
- 9.1.2. Activated Clays
- 9.1.3. Fuller's Earth
- 9.2. Market Analysis, Insights and Forecast - by Application
- 9.2.1. Industrial Oil
- 9.2.2. Mineral Oil and Waxes
- 9.2.3. Vegetable Oil and Animal Fats
- 9.3. Market Analysis, Insights and Forecast - by End-user Industry
- 9.3.1. Food and Beverage
- 9.3.2. Cosmetics and Personal Care
- 9.3.3. Chemicals
- 9.3.4. Other End-user Industries
- 9.1. Market Analysis, Insights and Forecast - by Type
- 10. South America Bleaching Clay Market Analysis, Insights and Forecast, 2020-2032
- 10.1. Market Analysis, Insights and Forecast - by Type
- 10.1.1. Activated Bauxite
- 10.1.2. Activated Clays
- 10.1.3. Fuller's Earth
- 10.2. Market Analysis, Insights and Forecast - by Application
- 10.2.1. Industrial Oil
- 10.2.2. Mineral Oil and Waxes
- 10.2.3. Vegetable Oil and Animal Fats
- 10.3. Market Analysis, Insights and Forecast - by End-user Industry
- 10.3.1. Food and Beverage
- 10.3.2. Cosmetics and Personal Care
- 10.3.3. Chemicals
- 10.3.4. Other End-user Industries
- 10.1. Market Analysis, Insights and Forecast - by Type
- 11. Middle East and Africa Bleaching Clay Market Analysis, Insights and Forecast, 2020-2032
- 11.1. Market Analysis, Insights and Forecast - by Type
- 11.1.1. Activated Bauxite
- 11.1.2. Activated Clays
- 11.1.3. Fuller's Earth
- 11.2. Market Analysis, Insights and Forecast - by Application
- 11.2.1. Industrial Oil
- 11.2.2. Mineral Oil and Waxes
- 11.2.3. Vegetable Oil and Animal Fats
- 11.3. Market Analysis, Insights and Forecast - by End-user Industry
- 11.3.1. Food and Beverage
- 11.3.2. Cosmetics and Personal Care
- 11.3.3. Chemicals
- 11.3.4. Other End-user Industries
- 11.1. Market Analysis, Insights and Forecast - by Type
- 12. Competitive Analysis
- 12.1. Company Profiles
- 12.1.1 Mineral Technologies Inc
- 12.1.1.1. Company Overview
- 12.1.1.2. Products
- 12.1.1.3. Company Financials
- 12.1.1.4. SWOT Analysis
- 12.1.2 Musim Mas
- 12.1.2.1. Company Overview
- 12.1.2.2. Products
- 12.1.2.3. Company Financials
- 12.1.2.4. SWOT Analysis
- 12.1.3 Clariant
- 12.1.3.1. Company Overview
- 12.1.3.2. Products
- 12.1.3.3. Company Financials
- 12.1.3.4. SWOT Analysis
- 12.1.4 Refoil Earth Pvt Ltd
- 12.1.4.1. Company Overview
- 12.1.4.2. Products
- 12.1.4.3. Company Financials
- 12.1.4.4. SWOT Analysis
- 12.1.5 The W Clay Industries Sdn Bhd
- 12.1.5.1. Company Overview
- 12.1.5.2. Products
- 12.1.5.3. Company Financials
- 12.1.5.4. SWOT Analysis
- 12.1.6 HRP Industries
- 12.1.6.1. Company Overview
- 12.1.6.2. Products
- 12.1.6.3. Company Financials
- 12.1.6.4. SWOT Analysis
- 12.1.7 Ashapura Group
- 12.1.7.1. Company Overview
- 12.1.7.2. Products
- 12.1.7.3. Company Financials
- 12.1.7.4. SWOT Analysis
- 12.1.8 Oil-Dri Corporation of America
- 12.1.8.1. Company Overview
- 12.1.8.2. Products
- 12.1.8.3. Company Financials
- 12.1.8.4. SWOT Analysis
- 12.1.9 EP Minerals
- 12.1.9.1. Company Overview
- 12.1.9.2. Products
- 12.1.9.3. Company Financials
- 12.1.9.4. SWOT Analysis
- 12.1.10 Taiko Clay Marketing Sdn Bhd
- 12.1.10.1. Company Overview
- 12.1.10.2. Products
- 12.1.10.3. Company Financials
- 12.1.10.4. SWOT Analysis
- 12.1.1 Mineral Technologies Inc
- 12.2. Market Entropy
- 12.2.1 Company's Key Areas Served
- 12.2.2 Recent Developments
- 12.3. Company Market Share Analysis 2025
- 12.3.1 Top 5 Companies Market Share Analysis
- 12.3.2 Top 3 Companies Market Share Analysis
- 12.4. List of Potential Customers
- 13. Research Methodology
List of Figures
- Figure 1: Global Bleaching Clay Market Revenue Breakdown (billion, %) by Region 2025 & 2033
- Figure 2: Global Bleaching Clay Market Volume Breakdown (K Tons, %) by Region 2025 & 2033
- Figure 3: Asia Pacific Bleaching Clay Market Revenue (billion), by Type 2025 & 2033
- Figure 4: Asia Pacific Bleaching Clay Market Volume (K Tons), by Type 2025 & 2033
- Figure 5: Asia Pacific Bleaching Clay Market Revenue Share (%), by Type 2025 & 2033
- Figure 6: Asia Pacific Bleaching Clay Market Volume Share (%), by Type 2025 & 2033
- Figure 7: Asia Pacific Bleaching Clay Market Revenue (billion), by Application 2025 & 2033
- Figure 8: Asia Pacific Bleaching Clay Market Volume (K Tons), by Application 2025 & 2033
- Figure 9: Asia Pacific Bleaching Clay Market Revenue Share (%), by Application 2025 & 2033
- Figure 10: Asia Pacific Bleaching Clay Market Volume Share (%), by Application 2025 & 2033
- Figure 11: Asia Pacific Bleaching Clay Market Revenue (billion), by End-user Industry 2025 & 2033
- Figure 12: Asia Pacific Bleaching Clay Market Volume (K Tons), by End-user Industry 2025 & 2033
- Figure 13: Asia Pacific Bleaching Clay Market Revenue Share (%), by End-user Industry 2025 & 2033
- Figure 14: Asia Pacific Bleaching Clay Market Volume Share (%), by End-user Industry 2025 & 2033
- Figure 15: Asia Pacific Bleaching Clay Market Revenue (billion), by Country 2025 & 2033
- Figure 16: Asia Pacific Bleaching Clay Market Volume (K Tons), by Country 2025 & 2033
- Figure 17: Asia Pacific Bleaching Clay Market Revenue Share (%), by Country 2025 & 2033
- Figure 18: Asia Pacific Bleaching Clay Market Volume Share (%), by Country 2025 & 2033
- Figure 19: North America Bleaching Clay Market Revenue (billion), by Type 2025 & 2033
- Figure 20: North America Bleaching Clay Market Volume (K Tons), by Type 2025 & 2033
- Figure 21: North America Bleaching Clay Market Revenue Share (%), by Type 2025 & 2033
- Figure 22: North America Bleaching Clay Market Volume Share (%), by Type 2025 & 2033
- Figure 23: North America Bleaching Clay Market Revenue (billion), by Application 2025 & 2033
- Figure 24: North America Bleaching Clay Market Volume (K Tons), by Application 2025 & 2033
- Figure 25: North America Bleaching Clay Market Revenue Share (%), by Application 2025 & 2033
- Figure 26: North America Bleaching Clay Market Volume Share (%), by Application 2025 & 2033
- Figure 27: North America Bleaching Clay Market Revenue (billion), by End-user Industry 2025 & 2033
- Figure 28: North America Bleaching Clay Market Volume (K Tons), by End-user Industry 2025 & 2033
- Figure 29: North America Bleaching Clay Market Revenue Share (%), by End-user Industry 2025 & 2033
- Figure 30: North America Bleaching Clay Market Volume Share (%), by End-user Industry 2025 & 2033
- Figure 31: North America Bleaching Clay Market Revenue (billion), by Country 2025 & 2033
- Figure 32: North America Bleaching Clay Market Volume (K Tons), by Country 2025 & 2033
- Figure 33: North America Bleaching Clay Market Revenue Share (%), by Country 2025 & 2033
- Figure 34: North America Bleaching Clay Market Volume Share (%), by Country 2025 & 2033
- Figure 35: Europe Bleaching Clay Market Revenue (billion), by Type 2025 & 2033
- Figure 36: Europe Bleaching Clay Market Volume (K Tons), by Type 2025 & 2033
- Figure 37: Europe Bleaching Clay Market Revenue Share (%), by Type 2025 & 2033
- Figure 38: Europe Bleaching Clay Market Volume Share (%), by Type 2025 & 2033
- Figure 39: Europe Bleaching Clay Market Revenue (billion), by Application 2025 & 2033
- Figure 40: Europe Bleaching Clay Market Volume (K Tons), by Application 2025 & 2033
- Figure 41: Europe Bleaching Clay Market Revenue Share (%), by Application 2025 & 2033
- Figure 42: Europe Bleaching Clay Market Volume Share (%), by Application 2025 & 2033
- Figure 43: Europe Bleaching Clay Market Revenue (billion), by End-user Industry 2025 & 2033
- Figure 44: Europe Bleaching Clay Market Volume (K Tons), by End-user Industry 2025 & 2033
- Figure 45: Europe Bleaching Clay Market Revenue Share (%), by End-user Industry 2025 & 2033
- Figure 46: Europe Bleaching Clay Market Volume Share (%), by End-user Industry 2025 & 2033
- Figure 47: Europe Bleaching Clay Market Revenue (billion), by Country 2025 & 2033
- Figure 48: Europe Bleaching Clay Market Volume (K Tons), by Country 2025 & 2033
- Figure 49: Europe Bleaching Clay Market Revenue Share (%), by Country 2025 & 2033
- Figure 50: Europe Bleaching Clay Market Volume Share (%), by Country 2025 & 2033
- Figure 51: South America Bleaching Clay Market Revenue (billion), by Type 2025 & 2033
- Figure 52: South America Bleaching Clay Market Volume (K Tons), by Type 2025 & 2033
- Figure 53: South America Bleaching Clay Market Revenue Share (%), by Type 2025 & 2033
- Figure 54: South America Bleaching Clay Market Volume Share (%), by Type 2025 & 2033
- Figure 55: South America Bleaching Clay Market Revenue (billion), by Application 2025 & 2033
- Figure 56: South America Bleaching Clay Market Volume (K Tons), by Application 2025 & 2033
- Figure 57: South America Bleaching Clay Market Revenue Share (%), by Application 2025 & 2033
- Figure 58: South America Bleaching Clay Market Volume Share (%), by Application 2025 & 2033
- Figure 59: South America Bleaching Clay Market Revenue (billion), by End-user Industry 2025 & 2033
- Figure 60: South America Bleaching Clay Market Volume (K Tons), by End-user Industry 2025 & 2033
- Figure 61: South America Bleaching Clay Market Revenue Share (%), by End-user Industry 2025 & 2033
- Figure 62: South America Bleaching Clay Market Volume Share (%), by End-user Industry 2025 & 2033
- Figure 63: South America Bleaching Clay Market Revenue (billion), by Country 2025 & 2033
- Figure 64: South America Bleaching Clay Market Volume (K Tons), by Country 2025 & 2033
- Figure 65: South America Bleaching Clay Market Revenue Share (%), by Country 2025 & 2033
- Figure 66: South America Bleaching Clay Market Volume Share (%), by Country 2025 & 2033
- Figure 67: Middle East and Africa Bleaching Clay Market Revenue (billion), by Type 2025 & 2033
- Figure 68: Middle East and Africa Bleaching Clay Market Volume (K Tons), by Type 2025 & 2033
- Figure 69: Middle East and Africa Bleaching Clay Market Revenue Share (%), by Type 2025 & 2033
- Figure 70: Middle East and Africa Bleaching Clay Market Volume Share (%), by Type 2025 & 2033
- Figure 71: Middle East and Africa Bleaching Clay Market Revenue (billion), by Application 2025 & 2033
- Figure 72: Middle East and Africa Bleaching Clay Market Volume (K Tons), by Application 2025 & 2033
- Figure 73: Middle East and Africa Bleaching Clay Market Revenue Share (%), by Application 2025 & 2033
- Figure 74: Middle East and Africa Bleaching Clay Market Volume Share (%), by Application 2025 & 2033
- Figure 75: Middle East and Africa Bleaching Clay Market Revenue (billion), by End-user Industry 2025 & 2033
- Figure 76: Middle East and Africa Bleaching Clay Market Volume (K Tons), by End-user Industry 2025 & 2033
- Figure 77: Middle East and Africa Bleaching Clay Market Revenue Share (%), by End-user Industry 2025 & 2033
- Figure 78: Middle East and Africa Bleaching Clay Market Volume Share (%), by End-user Industry 2025 & 2033
- Figure 79: Middle East and Africa Bleaching Clay Market Revenue (billion), by Country 2025 & 2033
- Figure 80: Middle East and Africa Bleaching Clay Market Volume (K Tons), by Country 2025 & 2033
- Figure 81: Middle East and Africa Bleaching Clay Market Revenue Share (%), by Country 2025 & 2033
- Figure 82: Middle East and Africa Bleaching Clay Market Volume Share (%), by Country 2025 & 2033
List of Tables
- Table 1: Global Bleaching Clay Market Revenue billion Forecast, by Type 2020 & 2033
- Table 2: Global Bleaching Clay Market Volume K Tons Forecast, by Type 2020 & 2033
- Table 3: Global Bleaching Clay Market Revenue billion Forecast, by Application 2020 & 2033
- Table 4: Global Bleaching Clay Market Volume K Tons Forecast, by Application 2020 & 2033
- Table 5: Global Bleaching Clay Market Revenue billion Forecast, by End-user Industry 2020 & 2033
- Table 6: Global Bleaching Clay Market Volume K Tons Forecast, by End-user Industry 2020 & 2033
- Table 7: Global Bleaching Clay Market Revenue billion Forecast, by Region 2020 & 2033
- Table 8: Global Bleaching Clay Market Volume K Tons Forecast, by Region 2020 & 2033
- Table 9: Global Bleaching Clay Market Revenue billion Forecast, by Type 2020 & 2033
- Table 10: Global Bleaching Clay Market Volume K Tons Forecast, by Type 2020 & 2033
- Table 11: Global Bleaching Clay Market Revenue billion Forecast, by Application 2020 & 2033
- Table 12: Global Bleaching Clay Market Volume K Tons Forecast, by Application 2020 & 2033
- Table 13: Global Bleaching Clay Market Revenue billion Forecast, by End-user Industry 2020 & 2033
- Table 14: Global Bleaching Clay Market Volume K Tons Forecast, by End-user Industry 2020 & 2033
- Table 15: Global Bleaching Clay Market Revenue billion Forecast, by Country 2020 & 2033
- Table 16: Global Bleaching Clay Market Volume K Tons Forecast, by Country 2020 & 2033
- Table 17: China Bleaching Clay Market Revenue (billion) Forecast, by Application 2020 & 2033
- Table 18: China Bleaching Clay Market Volume (K Tons) Forecast, by Application 2020 & 2033
- Table 19: India Bleaching Clay Market Revenue (billion) Forecast, by Application 2020 & 2033
- Table 20: India Bleaching Clay Market Volume (K Tons) Forecast, by Application 2020 & 2033
- Table 21: Japan Bleaching Clay Market Revenue (billion) Forecast, by Application 2020 & 2033
- Table 22: Japan Bleaching Clay Market Volume (K Tons) Forecast, by Application 2020 & 2033
- Table 23: South Korea Bleaching Clay Market Revenue (billion) Forecast, by Application 2020 & 2033
- Table 24: South Korea Bleaching Clay Market Volume (K Tons) Forecast, by Application 2020 & 2033
- Table 25: Rest of Asia Pacific Bleaching Clay Market Revenue (billion) Forecast, by Application 2020 & 2033
- Table 26: Rest of Asia Pacific Bleaching Clay Market Volume (K Tons) Forecast, by Application 2020 & 2033
- Table 27: Global Bleaching Clay Market Revenue billion Forecast, by Type 2020 & 2033
- Table 28: Global Bleaching Clay Market Volume K Tons Forecast, by Type 2020 & 2033
- Table 29: Global Bleaching Clay Market Revenue billion Forecast, by Application 2020 & 2033
- Table 30: Global Bleaching Clay Market Volume K Tons Forecast, by Application 2020 & 2033
- Table 31: Global Bleaching Clay Market Revenue billion Forecast, by End-user Industry 2020 & 2033
- Table 32: Global Bleaching Clay Market Volume K Tons Forecast, by End-user Industry 2020 & 2033
- Table 33: Global Bleaching Clay Market Revenue billion Forecast, by Country 2020 & 2033
- Table 34: Global Bleaching Clay Market Volume K Tons Forecast, by Country 2020 & 2033
- Table 35: United States Bleaching Clay Market Revenue (billion) Forecast, by Application 2020 & 2033
- Table 36: United States Bleaching Clay Market Volume (K Tons) Forecast, by Application 2020 & 2033
- Table 37: Canada Bleaching Clay Market Revenue (billion) Forecast, by Application 2020 & 2033
- Table 38: Canada Bleaching Clay Market Volume (K Tons) Forecast, by Application 2020 & 2033
- Table 39: Mexico Bleaching Clay Market Revenue (billion) Forecast, by Application 2020 & 2033
- Table 40: Mexico Bleaching Clay Market Volume (K Tons) Forecast, by Application 2020 & 2033
- Table 41: Global Bleaching Clay Market Revenue billion Forecast, by Type 2020 & 2033
- Table 42: Global Bleaching Clay Market Volume K Tons Forecast, by Type 2020 & 2033
- Table 43: Global Bleaching Clay Market Revenue billion Forecast, by Application 2020 & 2033
- Table 44: Global Bleaching Clay Market Volume K Tons Forecast, by Application 2020 & 2033
- Table 45: Global Bleaching Clay Market Revenue billion Forecast, by End-user Industry 2020 & 2033
- Table 46: Global Bleaching Clay Market Volume K Tons Forecast, by End-user Industry 2020 & 2033
- Table 47: Global Bleaching Clay Market Revenue billion Forecast, by Country 2020 & 2033
- Table 48: Global Bleaching Clay Market Volume K Tons Forecast, by Country 2020 & 2033
- Table 49: Germany Bleaching Clay Market Revenue (billion) Forecast, by Application 2020 & 2033
- Table 50: Germany Bleaching Clay Market Volume (K Tons) Forecast, by Application 2020 & 2033
- Table 51: United Kingdom Bleaching Clay Market Revenue (billion) Forecast, by Application 2020 & 2033
- Table 52: United Kingdom Bleaching Clay Market Volume (K Tons) Forecast, by Application 2020 & 2033
- Table 53: Italy Bleaching Clay Market Revenue (billion) Forecast, by Application 2020 & 2033
- Table 54: Italy Bleaching Clay Market Volume (K Tons) Forecast, by Application 2020 & 2033
- Table 55: France Bleaching Clay Market Revenue (billion) Forecast, by Application 2020 & 2033
- Table 56: France Bleaching Clay Market Volume (K Tons) Forecast, by Application 2020 & 2033
- Table 57: Rest of Europe Bleaching Clay Market Revenue (billion) Forecast, by Application 2020 & 2033
- Table 58: Rest of Europe Bleaching Clay Market Volume (K Tons) Forecast, by Application 2020 & 2033
- Table 59: Global Bleaching Clay Market Revenue billion Forecast, by Type 2020 & 2033
- Table 60: Global Bleaching Clay Market Volume K Tons Forecast, by Type 2020 & 2033
- Table 61: Global Bleaching Clay Market Revenue billion Forecast, by Application 2020 & 2033
- Table 62: Global Bleaching Clay Market Volume K Tons Forecast, by Application 2020 & 2033
- Table 63: Global Bleaching Clay Market Revenue billion Forecast, by End-user Industry 2020 & 2033
- Table 64: Global Bleaching Clay Market Volume K Tons Forecast, by End-user Industry 2020 & 2033
- Table 65: Global Bleaching Clay Market Revenue billion Forecast, by Country 2020 & 2033
- Table 66: Global Bleaching Clay Market Volume K Tons Forecast, by Country 2020 & 2033
- Table 67: Brazil Bleaching Clay Market Revenue (billion) Forecast, by Application 2020 & 2033
- Table 68: Brazil Bleaching Clay Market Volume (K Tons) Forecast, by Application 2020 & 2033
- Table 69: Argentina Bleaching Clay Market Revenue (billion) Forecast, by Application 2020 & 2033
- Table 70: Argentina Bleaching Clay Market Volume (K Tons) Forecast, by Application 2020 & 2033
- Table 71: Rest of South America Bleaching Clay Market Revenue (billion) Forecast, by Application 2020 & 2033
- Table 72: Rest of South America Bleaching Clay Market Volume (K Tons) Forecast, by Application 2020 & 2033
- Table 73: Global Bleaching Clay Market Revenue billion Forecast, by Type 2020 & 2033
- Table 74: Global Bleaching Clay Market Volume K Tons Forecast, by Type 2020 & 2033
- Table 75: Global Bleaching Clay Market Revenue billion Forecast, by Application 2020 & 2033
- Table 76: Global Bleaching Clay Market Volume K Tons Forecast, by Application 2020 & 2033
- Table 77: Global Bleaching Clay Market Revenue billion Forecast, by End-user Industry 2020 & 2033
- Table 78: Global Bleaching Clay Market Volume K Tons Forecast, by End-user Industry 2020 & 2033
- Table 79: Global Bleaching Clay Market Revenue billion Forecast, by Country 2020 & 2033
- Table 80: Global Bleaching Clay Market Volume K Tons Forecast, by Country 2020 & 2033
- Table 81: Saudi Arabia Bleaching Clay Market Revenue (billion) Forecast, by Application 2020 & 2033
- Table 82: Saudi Arabia Bleaching Clay Market Volume (K Tons) Forecast, by Application 2020 & 2033
- Table 83: South Africa Bleaching Clay Market Revenue (billion) Forecast, by Application 2020 & 2033
- Table 84: South Africa Bleaching Clay Market Volume (K Tons) Forecast, by Application 2020 & 2033
- Table 85: Rest of Middle East and Africa Bleaching Clay Market Revenue (billion) Forecast, by Application 2020 & 2033
- Table 86: Rest of Middle East and Africa Bleaching Clay Market Volume (K Tons) Forecast, by Application 2020 & 2033
Frequently Asked Questions
1. What is the projected Compound Annual Growth Rate (CAGR) of the Bleaching Clay Market?
The projected CAGR is approximately 5.5%.
2. Which companies are prominent players in the Bleaching Clay Market?
Key companies in the market include Mineral Technologies Inc, Musim Mas, Clariant, Refoil Earth Pvt Ltd, The W Clay Industries Sdn Bhd, HRP Industries, Ashapura Group, Oil-Dri Corporation of America, EP Minerals, Taiko Clay Marketing Sdn Bhd.
3. What are the main segments of the Bleaching Clay Market?
The market segments include Type, Application, End-user Industry.
4. Can you provide details about the market size?
The market size is estimated to be USD 1.7 billion as of 2022.
5. What are some drivers contributing to market growth?
; Growing Demand for Refined Vegetable Oil; Increasing Demand from the Cosmetics and Personal Care Market.
6. What are the notable trends driving market growth?
Increasing Demand from the Food and Beverage Industry.
7. Are there any restraints impacting market growth?
; Stringent Safety Legislations; Negative Impact of the COVID-19 Pandemic.
8. Can you provide examples of recent developments in the market?
N/A
9. What pricing options are available for accessing the report?
Pricing options include single-user, multi-user, and enterprise licenses priced at USD 4750, USD 5250, and USD 8750 respectively.
10. Is the market size provided in terms of value or volume?
The market size is provided in terms of value, measured in billion and volume, measured in K Tons.
11. Are there any specific market keywords associated with the report?
Yes, the market keyword associated with the report is "Bleaching Clay Market," which aids in identifying and referencing the specific market segment covered.
12. How do I determine which pricing option suits my needs best?
The pricing options vary based on user requirements and access needs. Individual users may opt for single-user licenses, while businesses requiring broader access may choose multi-user or enterprise licenses for cost-effective access to the report.
13. Are there any additional resources or data provided in the Bleaching Clay Market report?
While the report offers comprehensive insights, it's advisable to review the specific contents or supplementary materials provided to ascertain if additional resources or data are available.
14. How can I stay updated on further developments or reports in the Bleaching Clay Market?
To stay informed about further developments, trends, and reports in the Bleaching Clay Market, consider subscribing to industry newsletters, following relevant companies and organizations, or regularly checking reputable industry news sources and publications.
Methodology
Step 1 - Identification of Relevant Samples Size from Population Database


Step 2 - Approaches for Defining Global Market Size (Value, Volume* & Price*)

Note*: In applicable scenarios
Step 3 - Data Sources
Primary Research
- Web Analytics
- Survey Reports
- Research Institute
- Latest Research Reports
- Opinion Leaders
Secondary Research
- Annual Reports
- White Paper
- Latest Press Release
- Industry Association
- Paid Database
- Investor Presentations

Step 4 - Data Triangulation
Involves using different sources of information in order to increase the validity of a study
These sources are likely to be stakeholders in a program - participants, other researchers, program staff, other community members, and so on.
Then we put all data in single framework & apply various statistical tools to find out the dynamic on the market.
During the analysis stage, feedback from the stakeholder groups would be compared to determine areas of agreement as well as areas of divergence

