
Key Insights
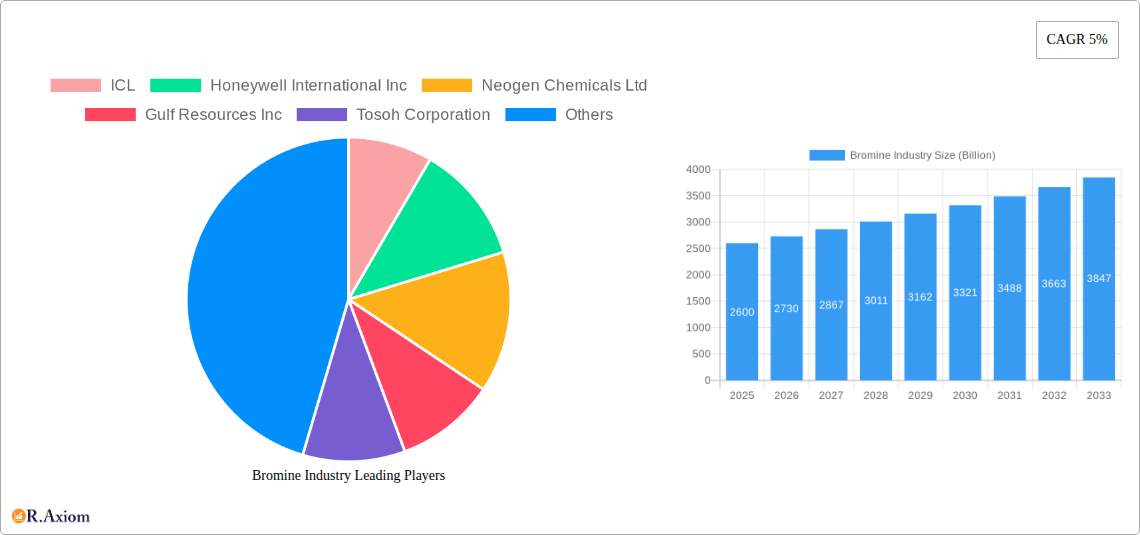
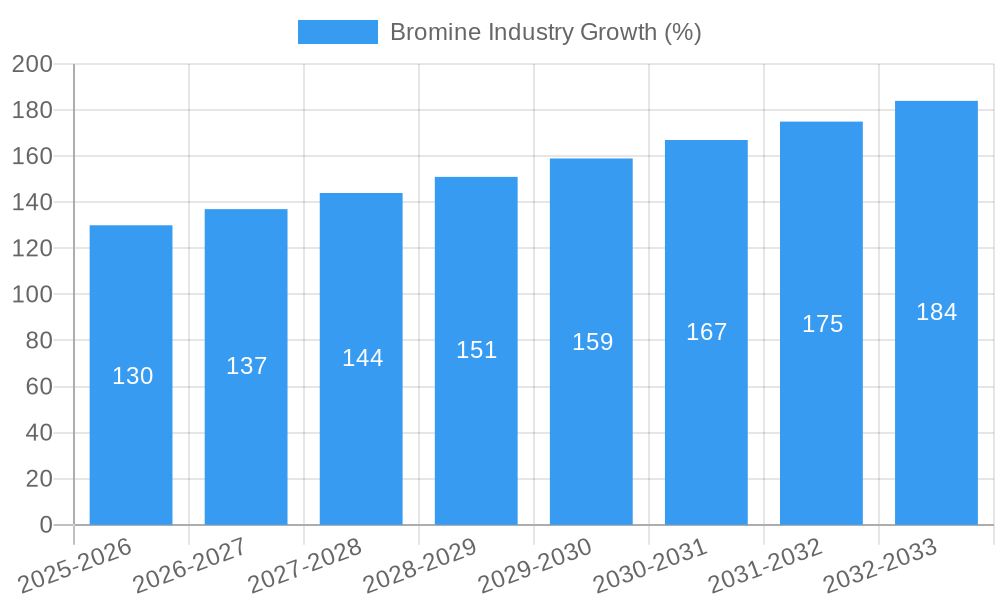
The global bromine market, valued at $2.6 billion in 2025, is projected to experience robust growth, driven by increasing demand across diverse applications. A compound annual growth rate (CAGR) of 5% from 2025 to 2033 indicates a significant market expansion. Key drivers include the burgeoning need for flame retardants in electronics and construction, the growth of bromine-based batteries in the renewable energy sector, and the expanding use of biocides in water treatment and agriculture. The rising adoption of sustainable practices and stringent environmental regulations are also shaping market dynamics. Organobromines and bromide salts are major derivative segments, contributing significantly to overall market value. Geographically, North America and Asia-Pacific are expected to dominate, fueled by significant industrial activity and robust economic growth in these regions. However, increasing concerns regarding the environmental impact of certain bromine compounds and the availability of alternative materials pose potential restraints to market growth. Companies like ICL, Honeywell, and Albemarle are key players, constantly innovating and expanding their product portfolios to capitalize on the market opportunities. Future growth will be influenced by technological advancements, regulatory changes, and the emergence of new applications for bromine compounds. The forecast period will witness strategic mergers and acquisitions, coupled with continuous R&D investments to develop eco-friendly bromine-based products.
The market segmentation highlights diverse applications including flame retardants (dominating due to rising safety regulations across various sectors), biocides (driven by increasing concerns about microbial contamination), and bromine-based batteries (fueled by the growing renewable energy sector). Competition among established players is intense, leading to price fluctuations and strategic partnerships. The market is influenced by the price volatility of bromine itself, impacting overall profitability. Furthermore, the focus on sustainable chemistry and environmentally benign alternatives is creating opportunities for innovative companies developing eco-friendly bromine-based solutions. Regional variations in growth are expected, with developing economies in Asia-Pacific showing strong potential, while mature markets in North America and Europe focus on optimizing production processes and reducing environmental impact. The long-term outlook for the bromine market remains positive, contingent upon successful navigation of regulatory hurdles and continuous technological advancements.
Bromine Industry Market Report: 2019-2033
This comprehensive report provides a detailed analysis of the global Bromine industry, offering invaluable insights for stakeholders across the value chain. Covering the period from 2019 to 2033, with a base year of 2025 and a forecast period of 2025-2033, this report analyzes market dynamics, growth drivers, challenges, and opportunities. The report values are expressed in Billions of dollars.
Bromine Industry Market Concentration & Innovation
The bromine industry exhibits moderate market concentration, with several major players controlling a significant portion of global production and sales. While precise market share data for each company fluctuates yearly, ICL, Albemarle Corporation, and Lanxess consistently rank among the leading producers. Recent years have seen increased M&A activity, with deal values reaching xx Billion in the past five years, driven by a desire to expand market share and access new technologies. Innovation is primarily focused on developing higher-performance bromine derivatives for specialized applications, driven by increasing demand in sectors such as flame retardants and biocides. Regulatory frameworks, varying across different regions, significantly impact production and application. Stringent environmental regulations necessitate the development of more sustainable and environmentally friendly bromine-based products. The industry faces competition from alternative chemicals in specific applications; however, bromine’s unique properties maintain its dominance in several key segments. End-user trends, particularly a growing focus on safety and sustainability, influence product development and market growth.
- Key Market Players: ICL, Albemarle Corporation, Lanxess, Honeywell International Inc, Tosoh Corporation.
- M&A Activity (2019-2024): xx Billion in deal value.
- Key Innovation Drivers: Demand for high-performance derivatives, stringent environmental regulations, and competition from alternative chemicals.
Bromine Industry Industry Trends & Insights
The global bromine market is experiencing steady growth, projected at a CAGR of xx% during the forecast period (2025-2033). This growth is primarily driven by increasing demand across various downstream applications, notably in flame retardants for electronics and construction materials, biocides for water treatment and agriculture, and oil and gas applications like Clear Brine Fluids (CBF). Technological advancements in bromine derivative synthesis and application are improving product efficiency and expanding usage across diverse sectors. Consumer preferences for safer and more sustainable products are compelling manufacturers to develop environmentally friendly alternatives. Competitive dynamics remain intense, with key players focusing on innovation, cost optimization, and strategic partnerships to maintain market leadership. Market penetration in emerging economies remains significant growth opportunities, largely due to expanding infrastructure development.
Dominant Markets & Segments in Bromine Industry
The Asia-Pacific region dominates the global bromine market, driven by rapid industrialization and significant construction activities. China, India, and other Southeast Asian nations exhibit high growth potential, owing to substantial investments in infrastructure and increasing demand for bromine-based products across various industries. Within segments, flame retardants represent the largest application area, followed by biocides. Organo bromines comprise the largest derivative segment.
Key Drivers for Asia-Pacific Dominance:
- Rapid industrialization
- Increased infrastructure development
- Growing demand across diverse industries
Dominant Segments:
- Application: Flame Retardants (FR) > Biocides > CBF
- Derivative: Organo Bromines > Bromide Salts > Hydrogen Bromide
Bromine Industry Product Developments
Recent innovations in the bromine industry focus on developing higher-performance and more environmentally friendly products. This includes the development of novel flame retardants with enhanced thermal stability and reduced toxicity, along with biocides offering improved efficacy and reduced environmental impact. Companies are also exploring new applications for bromine-based materials, such as in energy storage technologies and advanced materials. These developments leverage technological advances in synthesis and characterization techniques to create tailored products offering specific advantages over competitors.
Report Scope & Segmentation Analysis
This report segments the bromine market by derivative (Organo Bromines, Bromide Salts, Hydrogen Bromide) and application (Biocides, Flame Retardants (FR), Bromine-based Batteries, Clear Brine Fluids (CBF), Other Applications). Each segment's growth projections, market sizes, and competitive dynamics are comprehensively analyzed. The report provides detailed insights into market size and growth potential for each segment during the forecast period (2025-2033).
Key Drivers of Bromine Industry Growth
Several factors contribute to the bromine industry's growth. The increasing demand for flame retardants in various industries, driven by stringent safety regulations, is a significant driver. The expanding use of bromine-based biocides in water treatment and agriculture, particularly in developing countries, contributes substantially. Technological advancements in bromine derivative synthesis lead to more efficient and effective products, further stimulating growth. Finally, robust economic growth in several regions fuels higher demand across numerous applications.
Challenges in the Bromine Industry Sector
The bromine industry faces challenges such as fluctuating raw material prices, stringent environmental regulations leading to increased production costs, and potential supply chain disruptions. Competition from alternative chemicals in certain applications and the need for continuous innovation to maintain market share also pose significant challenges. The impact of these factors on profitability and growth requires continuous adaptation and strategic planning by industry players. The estimated impact on revenue due to these challenges is xx Billion annually.
Emerging Opportunities in Bromine Industry
Emerging opportunities exist in the development of next-generation flame retardants with improved performance and reduced environmental impact. The expanding use of bromine-based materials in energy storage and advanced manufacturing processes presents significant growth potential. Penetration into new markets, particularly in developing economies, offers substantial opportunities for industry expansion. Finally, the development of sustainable bromine extraction and production techniques aligns with growing environmental concerns.
Leading Players in the Bromine Industry Market
- ICL
- Honeywell International Inc
- Neogen Chemicals Ltd
- Gulf Resources Inc
- Tosoh Corporation
- Jordan Bromine Company
- TETRA Technologies Inc
- Tata Chemicals Ltd
- Shandong Haiwang Chemical Co
- Lanxess
- Sujay Chemicals
- Albemarle Corporation
Key Developments in Bromine Industry Industry
- January 2022: ICL launched BromoQuel, a patented solution for bromine leakage incidents, enhancing safety and expanding its bromine business.
- August 2022: Albemarle Corporation restructured its bromine and lithium GBUs to better meet growing customer demand and enhance competitiveness.
Strategic Outlook for Bromine Industry Market
The bromine industry’s future is promising, fueled by ongoing innovation, growing demand across various sectors, and the development of sustainable production methods. Continued investment in R&D to enhance product performance and environmental compatibility will shape future growth. Expanding into new applications, particularly in advanced materials and energy storage, will be crucial for sustained market expansion. Strategic partnerships and collaborations will enhance competitiveness and accelerate market penetration in emerging economies.
Bromine Industry Segmentation
-
1. Derivative
- 1.1. Organo Bromines
- 1.2. Bromide Salts
- 1.3. Hydrogen Bromide
-
2. Application
- 2.1. Biocides
- 2.2. Flame Retardants (FR)
- 2.3. Bromine-based Batteries
- 2.4. Clear Brine Fluids (CBF)
- 2.5. Other Applications
Bromine Industry Segmentation By Geography
-
1. Asia Pacific
- 1.1. China
- 1.2. India
- 1.3. Japan
- 1.4. South Korea
- 1.5. Rest of Asia Pacific
-
2. North America
- 2.1. United States
- 2.2. Canada
- 2.3. Mexico
-
3. Europe
- 3.1. Germany
- 3.2. United Kingdom
- 3.3. Italy
- 3.4. France
- 3.5. Rest of Europe
-
4. South America
- 4.1. Brazil
- 4.2. Argentina
- 4.3. Rest of South America
-
5. Middle East and Africa
- 5.1. Saudi Arabia
- 5.2. South Africa
- 5.3. Rest of Middle East and Africa

Bromine Industry REPORT HIGHLIGHTS
| Aspects | Details |
|---|---|
| Study Period | 2019-2033 |
| Base Year | 2024 |
| Estimated Year | 2025 |
| Forecast Period | 2025-2033 |
| Historical Period | 2019-2024 |
| Growth Rate | CAGR of 5% from 2019-2033 |
| Segmentation |
|
Table of Contents
- 1. Introduction
- 1.1. Research Scope
- 1.2. Market Segmentation
- 1.3. Research Methodology
- 1.4. Definitions and Assumptions
- 2. Executive Summary
- 2.1. Introduction
- 3. Market Dynamics
- 3.1. Introduction
- 3.2. Market Drivers
- 3.2.1. The Increasing Demand of Bromine in Water Treatment Applications; Other Drivers
- 3.3. Market Restrains
- 3.3.1. Emergence of Non-halogenated Flame Retardants; Other Restraints
- 3.4. Market Trends
- 3.4.1. Increasing Demand for Flame Retardants
- 4. Market Factor Analysis
- 4.1. Porters Five Forces
- 4.2. Supply/Value Chain
- 4.3. PESTEL analysis
- 4.4. Market Entropy
- 4.5. Patent/Trademark Analysis
- 5. Global Bromine Industry Analysis, Insights and Forecast, 2019-2031
- 5.1. Market Analysis, Insights and Forecast - by Derivative
- 5.1.1. Organo Bromines
- 5.1.2. Bromide Salts
- 5.1.3. Hydrogen Bromide
- 5.2. Market Analysis, Insights and Forecast - by Application
- 5.2.1. Biocides
- 5.2.2. Flame Retardants (FR)
- 5.2.3. Bromine-based Batteries
- 5.2.4. Clear Brine Fluids (CBF)
- 5.2.5. Other Applications
- 5.3. Market Analysis, Insights and Forecast - by Region
- 5.3.1. Asia Pacific
- 5.3.2. North America
- 5.3.3. Europe
- 5.3.4. South America
- 5.3.5. Middle East and Africa
- 5.1. Market Analysis, Insights and Forecast - by Derivative
- 6. Asia Pacific Bromine Industry Analysis, Insights and Forecast, 2019-2031
- 6.1. Market Analysis, Insights and Forecast - by Derivative
- 6.1.1. Organo Bromines
- 6.1.2. Bromide Salts
- 6.1.3. Hydrogen Bromide
- 6.2. Market Analysis, Insights and Forecast - by Application
- 6.2.1. Biocides
- 6.2.2. Flame Retardants (FR)
- 6.2.3. Bromine-based Batteries
- 6.2.4. Clear Brine Fluids (CBF)
- 6.2.5. Other Applications
- 6.1. Market Analysis, Insights and Forecast - by Derivative
- 7. North America Bromine Industry Analysis, Insights and Forecast, 2019-2031
- 7.1. Market Analysis, Insights and Forecast - by Derivative
- 7.1.1. Organo Bromines
- 7.1.2. Bromide Salts
- 7.1.3. Hydrogen Bromide
- 7.2. Market Analysis, Insights and Forecast - by Application
- 7.2.1. Biocides
- 7.2.2. Flame Retardants (FR)
- 7.2.3. Bromine-based Batteries
- 7.2.4. Clear Brine Fluids (CBF)
- 7.2.5. Other Applications
- 7.1. Market Analysis, Insights and Forecast - by Derivative
- 8. Europe Bromine Industry Analysis, Insights and Forecast, 2019-2031
- 8.1. Market Analysis, Insights and Forecast - by Derivative
- 8.1.1. Organo Bromines
- 8.1.2. Bromide Salts
- 8.1.3. Hydrogen Bromide
- 8.2. Market Analysis, Insights and Forecast - by Application
- 8.2.1. Biocides
- 8.2.2. Flame Retardants (FR)
- 8.2.3. Bromine-based Batteries
- 8.2.4. Clear Brine Fluids (CBF)
- 8.2.5. Other Applications
- 8.1. Market Analysis, Insights and Forecast - by Derivative
- 9. South America Bromine Industry Analysis, Insights and Forecast, 2019-2031
- 9.1. Market Analysis, Insights and Forecast - by Derivative
- 9.1.1. Organo Bromines
- 9.1.2. Bromide Salts
- 9.1.3. Hydrogen Bromide
- 9.2. Market Analysis, Insights and Forecast - by Application
- 9.2.1. Biocides
- 9.2.2. Flame Retardants (FR)
- 9.2.3. Bromine-based Batteries
- 9.2.4. Clear Brine Fluids (CBF)
- 9.2.5. Other Applications
- 9.1. Market Analysis, Insights and Forecast - by Derivative
- 10. Middle East and Africa Bromine Industry Analysis, Insights and Forecast, 2019-2031
- 10.1. Market Analysis, Insights and Forecast - by Derivative
- 10.1.1. Organo Bromines
- 10.1.2. Bromide Salts
- 10.1.3. Hydrogen Bromide
- 10.2. Market Analysis, Insights and Forecast - by Application
- 10.2.1. Biocides
- 10.2.2. Flame Retardants (FR)
- 10.2.3. Bromine-based Batteries
- 10.2.4. Clear Brine Fluids (CBF)
- 10.2.5. Other Applications
- 10.1. Market Analysis, Insights and Forecast - by Derivative
- 11. North America Bromine Industry Analysis, Insights and Forecast, 2019-2031
- 11.1. Market Analysis, Insights and Forecast - By Country/Sub-region
- 11.1.1 United States
- 11.1.2 Canada
- 11.1.3 Mexico
- 12. Europe Bromine Industry Analysis, Insights and Forecast, 2019-2031
- 12.1. Market Analysis, Insights and Forecast - By Country/Sub-region
- 12.1.1 Germany
- 12.1.2 France
- 12.1.3 Italy
- 12.1.4 United Kingdom
- 12.1.5 Netherlands
- 12.1.6 Rest of Europe
- 13. Asia Pacific Bromine Industry Analysis, Insights and Forecast, 2019-2031
- 13.1. Market Analysis, Insights and Forecast - By Country/Sub-region
- 13.1.1 China
- 13.1.2 Japan
- 13.1.3 India
- 13.1.4 South Korea
- 13.1.5 Taiwan
- 13.1.6 Australia
- 13.1.7 Rest of Asia-Pacific
- 14. South America Bromine Industry Analysis, Insights and Forecast, 2019-2031
- 14.1. Market Analysis, Insights and Forecast - By Country/Sub-region
- 14.1.1 Brazil
- 14.1.2 Argentina
- 14.1.3 Rest of South America
- 15. MEA Bromine Industry Analysis, Insights and Forecast, 2019-2031
- 15.1. Market Analysis, Insights and Forecast - By Country/Sub-region
- 15.1.1 Middle East
- 15.1.2 Africa
- 16. Competitive Analysis
- 16.1. Global Market Share Analysis 2024
- 16.2. Company Profiles
- 16.2.1 ICL
- 16.2.1.1. Overview
- 16.2.1.2. Products
- 16.2.1.3. SWOT Analysis
- 16.2.1.4. Recent Developments
- 16.2.1.5. Financials (Based on Availability)
- 16.2.2 Honeywell International Inc
- 16.2.2.1. Overview
- 16.2.2.2. Products
- 16.2.2.3. SWOT Analysis
- 16.2.2.4. Recent Developments
- 16.2.2.5. Financials (Based on Availability)
- 16.2.3 Neogen Chemicals Ltd
- 16.2.3.1. Overview
- 16.2.3.2. Products
- 16.2.3.3. SWOT Analysis
- 16.2.3.4. Recent Developments
- 16.2.3.5. Financials (Based on Availability)
- 16.2.4 Gulf Resources Inc
- 16.2.4.1. Overview
- 16.2.4.2. Products
- 16.2.4.3. SWOT Analysis
- 16.2.4.4. Recent Developments
- 16.2.4.5. Financials (Based on Availability)
- 16.2.5 Tosoh Corporation
- 16.2.5.1. Overview
- 16.2.5.2. Products
- 16.2.5.3. SWOT Analysis
- 16.2.5.4. Recent Developments
- 16.2.5.5. Financials (Based on Availability)
- 16.2.6 Jordan Bromine Company
- 16.2.6.1. Overview
- 16.2.6.2. Products
- 16.2.6.3. SWOT Analysis
- 16.2.6.4. Recent Developments
- 16.2.6.5. Financials (Based on Availability)
- 16.2.7 TETRA Technologies Inc
- 16.2.7.1. Overview
- 16.2.7.2. Products
- 16.2.7.3. SWOT Analysis
- 16.2.7.4. Recent Developments
- 16.2.7.5. Financials (Based on Availability)
- 16.2.8 Tata Chemicals Ltd
- 16.2.8.1. Overview
- 16.2.8.2. Products
- 16.2.8.3. SWOT Analysis
- 16.2.8.4. Recent Developments
- 16.2.8.5. Financials (Based on Availability)
- 16.2.9 Shandong Haiwang Chemical Co
- 16.2.9.1. Overview
- 16.2.9.2. Products
- 16.2.9.3. SWOT Analysis
- 16.2.9.4. Recent Developments
- 16.2.9.5. Financials (Based on Availability)
- 16.2.10 Lanxess
- 16.2.10.1. Overview
- 16.2.10.2. Products
- 16.2.10.3. SWOT Analysis
- 16.2.10.4. Recent Developments
- 16.2.10.5. Financials (Based on Availability)
- 16.2.11 Sujay Chemicals
- 16.2.11.1. Overview
- 16.2.11.2. Products
- 16.2.11.3. SWOT Analysis
- 16.2.11.4. Recent Developments
- 16.2.11.5. Financials (Based on Availability)
- 16.2.12 Albemarle Corporation
- 16.2.12.1. Overview
- 16.2.12.2. Products
- 16.2.12.3. SWOT Analysis
- 16.2.12.4. Recent Developments
- 16.2.12.5. Financials (Based on Availability)
- 16.2.1 ICL
List of Figures
- Figure 1: Global Bromine Industry Revenue Breakdown (Billion, %) by Region 2024 & 2032
- Figure 2: Global Bromine Industry Volume Breakdown (K Tons, %) by Region 2024 & 2032
- Figure 3: North America Bromine Industry Revenue (Billion), by Country 2024 & 2032
- Figure 4: North America Bromine Industry Volume (K Tons), by Country 2024 & 2032
- Figure 5: North America Bromine Industry Revenue Share (%), by Country 2024 & 2032
- Figure 6: North America Bromine Industry Volume Share (%), by Country 2024 & 2032
- Figure 7: Europe Bromine Industry Revenue (Billion), by Country 2024 & 2032
- Figure 8: Europe Bromine Industry Volume (K Tons), by Country 2024 & 2032
- Figure 9: Europe Bromine Industry Revenue Share (%), by Country 2024 & 2032
- Figure 10: Europe Bromine Industry Volume Share (%), by Country 2024 & 2032
- Figure 11: Asia Pacific Bromine Industry Revenue (Billion), by Country 2024 & 2032
- Figure 12: Asia Pacific Bromine Industry Volume (K Tons), by Country 2024 & 2032
- Figure 13: Asia Pacific Bromine Industry Revenue Share (%), by Country 2024 & 2032
- Figure 14: Asia Pacific Bromine Industry Volume Share (%), by Country 2024 & 2032
- Figure 15: South America Bromine Industry Revenue (Billion), by Country 2024 & 2032
- Figure 16: South America Bromine Industry Volume (K Tons), by Country 2024 & 2032
- Figure 17: South America Bromine Industry Revenue Share (%), by Country 2024 & 2032
- Figure 18: South America Bromine Industry Volume Share (%), by Country 2024 & 2032
- Figure 19: MEA Bromine Industry Revenue (Billion), by Country 2024 & 2032
- Figure 20: MEA Bromine Industry Volume (K Tons), by Country 2024 & 2032
- Figure 21: MEA Bromine Industry Revenue Share (%), by Country 2024 & 2032
- Figure 22: MEA Bromine Industry Volume Share (%), by Country 2024 & 2032
- Figure 23: Asia Pacific Bromine Industry Revenue (Billion), by Derivative 2024 & 2032
- Figure 24: Asia Pacific Bromine Industry Volume (K Tons), by Derivative 2024 & 2032
- Figure 25: Asia Pacific Bromine Industry Revenue Share (%), by Derivative 2024 & 2032
- Figure 26: Asia Pacific Bromine Industry Volume Share (%), by Derivative 2024 & 2032
- Figure 27: Asia Pacific Bromine Industry Revenue (Billion), by Application 2024 & 2032
- Figure 28: Asia Pacific Bromine Industry Volume (K Tons), by Application 2024 & 2032
- Figure 29: Asia Pacific Bromine Industry Revenue Share (%), by Application 2024 & 2032
- Figure 30: Asia Pacific Bromine Industry Volume Share (%), by Application 2024 & 2032
- Figure 31: Asia Pacific Bromine Industry Revenue (Billion), by Country 2024 & 2032
- Figure 32: Asia Pacific Bromine Industry Volume (K Tons), by Country 2024 & 2032
- Figure 33: Asia Pacific Bromine Industry Revenue Share (%), by Country 2024 & 2032
- Figure 34: Asia Pacific Bromine Industry Volume Share (%), by Country 2024 & 2032
- Figure 35: North America Bromine Industry Revenue (Billion), by Derivative 2024 & 2032
- Figure 36: North America Bromine Industry Volume (K Tons), by Derivative 2024 & 2032
- Figure 37: North America Bromine Industry Revenue Share (%), by Derivative 2024 & 2032
- Figure 38: North America Bromine Industry Volume Share (%), by Derivative 2024 & 2032
- Figure 39: North America Bromine Industry Revenue (Billion), by Application 2024 & 2032
- Figure 40: North America Bromine Industry Volume (K Tons), by Application 2024 & 2032
- Figure 41: North America Bromine Industry Revenue Share (%), by Application 2024 & 2032
- Figure 42: North America Bromine Industry Volume Share (%), by Application 2024 & 2032
- Figure 43: North America Bromine Industry Revenue (Billion), by Country 2024 & 2032
- Figure 44: North America Bromine Industry Volume (K Tons), by Country 2024 & 2032
- Figure 45: North America Bromine Industry Revenue Share (%), by Country 2024 & 2032
- Figure 46: North America Bromine Industry Volume Share (%), by Country 2024 & 2032
- Figure 47: Europe Bromine Industry Revenue (Billion), by Derivative 2024 & 2032
- Figure 48: Europe Bromine Industry Volume (K Tons), by Derivative 2024 & 2032
- Figure 49: Europe Bromine Industry Revenue Share (%), by Derivative 2024 & 2032
- Figure 50: Europe Bromine Industry Volume Share (%), by Derivative 2024 & 2032
- Figure 51: Europe Bromine Industry Revenue (Billion), by Application 2024 & 2032
- Figure 52: Europe Bromine Industry Volume (K Tons), by Application 2024 & 2032
- Figure 53: Europe Bromine Industry Revenue Share (%), by Application 2024 & 2032
- Figure 54: Europe Bromine Industry Volume Share (%), by Application 2024 & 2032
- Figure 55: Europe Bromine Industry Revenue (Billion), by Country 2024 & 2032
- Figure 56: Europe Bromine Industry Volume (K Tons), by Country 2024 & 2032
- Figure 57: Europe Bromine Industry Revenue Share (%), by Country 2024 & 2032
- Figure 58: Europe Bromine Industry Volume Share (%), by Country 2024 & 2032
- Figure 59: South America Bromine Industry Revenue (Billion), by Derivative 2024 & 2032
- Figure 60: South America Bromine Industry Volume (K Tons), by Derivative 2024 & 2032
- Figure 61: South America Bromine Industry Revenue Share (%), by Derivative 2024 & 2032
- Figure 62: South America Bromine Industry Volume Share (%), by Derivative 2024 & 2032
- Figure 63: South America Bromine Industry Revenue (Billion), by Application 2024 & 2032
- Figure 64: South America Bromine Industry Volume (K Tons), by Application 2024 & 2032
- Figure 65: South America Bromine Industry Revenue Share (%), by Application 2024 & 2032
- Figure 66: South America Bromine Industry Volume Share (%), by Application 2024 & 2032
- Figure 67: South America Bromine Industry Revenue (Billion), by Country 2024 & 2032
- Figure 68: South America Bromine Industry Volume (K Tons), by Country 2024 & 2032
- Figure 69: South America Bromine Industry Revenue Share (%), by Country 2024 & 2032
- Figure 70: South America Bromine Industry Volume Share (%), by Country 2024 & 2032
- Figure 71: Middle East and Africa Bromine Industry Revenue (Billion), by Derivative 2024 & 2032
- Figure 72: Middle East and Africa Bromine Industry Volume (K Tons), by Derivative 2024 & 2032
- Figure 73: Middle East and Africa Bromine Industry Revenue Share (%), by Derivative 2024 & 2032
- Figure 74: Middle East and Africa Bromine Industry Volume Share (%), by Derivative 2024 & 2032
- Figure 75: Middle East and Africa Bromine Industry Revenue (Billion), by Application 2024 & 2032
- Figure 76: Middle East and Africa Bromine Industry Volume (K Tons), by Application 2024 & 2032
- Figure 77: Middle East and Africa Bromine Industry Revenue Share (%), by Application 2024 & 2032
- Figure 78: Middle East and Africa Bromine Industry Volume Share (%), by Application 2024 & 2032
- Figure 79: Middle East and Africa Bromine Industry Revenue (Billion), by Country 2024 & 2032
- Figure 80: Middle East and Africa Bromine Industry Volume (K Tons), by Country 2024 & 2032
- Figure 81: Middle East and Africa Bromine Industry Revenue Share (%), by Country 2024 & 2032
- Figure 82: Middle East and Africa Bromine Industry Volume Share (%), by Country 2024 & 2032
List of Tables
- Table 1: Global Bromine Industry Revenue Billion Forecast, by Region 2019 & 2032
- Table 2: Global Bromine Industry Volume K Tons Forecast, by Region 2019 & 2032
- Table 3: Global Bromine Industry Revenue Billion Forecast, by Derivative 2019 & 2032
- Table 4: Global Bromine Industry Volume K Tons Forecast, by Derivative 2019 & 2032
- Table 5: Global Bromine Industry Revenue Billion Forecast, by Application 2019 & 2032
- Table 6: Global Bromine Industry Volume K Tons Forecast, by Application 2019 & 2032
- Table 7: Global Bromine Industry Revenue Billion Forecast, by Region 2019 & 2032
- Table 8: Global Bromine Industry Volume K Tons Forecast, by Region 2019 & 2032
- Table 9: Global Bromine Industry Revenue Billion Forecast, by Country 2019 & 2032
- Table 10: Global Bromine Industry Volume K Tons Forecast, by Country 2019 & 2032
- Table 11: United States Bromine Industry Revenue (Billion) Forecast, by Application 2019 & 2032
- Table 12: United States Bromine Industry Volume (K Tons) Forecast, by Application 2019 & 2032
- Table 13: Canada Bromine Industry Revenue (Billion) Forecast, by Application 2019 & 2032
- Table 14: Canada Bromine Industry Volume (K Tons) Forecast, by Application 2019 & 2032
- Table 15: Mexico Bromine Industry Revenue (Billion) Forecast, by Application 2019 & 2032
- Table 16: Mexico Bromine Industry Volume (K Tons) Forecast, by Application 2019 & 2032
- Table 17: Global Bromine Industry Revenue Billion Forecast, by Country 2019 & 2032
- Table 18: Global Bromine Industry Volume K Tons Forecast, by Country 2019 & 2032
- Table 19: Germany Bromine Industry Revenue (Billion) Forecast, by Application 2019 & 2032
- Table 20: Germany Bromine Industry Volume (K Tons) Forecast, by Application 2019 & 2032
- Table 21: France Bromine Industry Revenue (Billion) Forecast, by Application 2019 & 2032
- Table 22: France Bromine Industry Volume (K Tons) Forecast, by Application 2019 & 2032
- Table 23: Italy Bromine Industry Revenue (Billion) Forecast, by Application 2019 & 2032
- Table 24: Italy Bromine Industry Volume (K Tons) Forecast, by Application 2019 & 2032
- Table 25: United Kingdom Bromine Industry Revenue (Billion) Forecast, by Application 2019 & 2032
- Table 26: United Kingdom Bromine Industry Volume (K Tons) Forecast, by Application 2019 & 2032
- Table 27: Netherlands Bromine Industry Revenue (Billion) Forecast, by Application 2019 & 2032
- Table 28: Netherlands Bromine Industry Volume (K Tons) Forecast, by Application 2019 & 2032
- Table 29: Rest of Europe Bromine Industry Revenue (Billion) Forecast, by Application 2019 & 2032
- Table 30: Rest of Europe Bromine Industry Volume (K Tons) Forecast, by Application 2019 & 2032
- Table 31: Global Bromine Industry Revenue Billion Forecast, by Country 2019 & 2032
- Table 32: Global Bromine Industry Volume K Tons Forecast, by Country 2019 & 2032
- Table 33: China Bromine Industry Revenue (Billion) Forecast, by Application 2019 & 2032
- Table 34: China Bromine Industry Volume (K Tons) Forecast, by Application 2019 & 2032
- Table 35: Japan Bromine Industry Revenue (Billion) Forecast, by Application 2019 & 2032
- Table 36: Japan Bromine Industry Volume (K Tons) Forecast, by Application 2019 & 2032
- Table 37: India Bromine Industry Revenue (Billion) Forecast, by Application 2019 & 2032
- Table 38: India Bromine Industry Volume (K Tons) Forecast, by Application 2019 & 2032
- Table 39: South Korea Bromine Industry Revenue (Billion) Forecast, by Application 2019 & 2032
- Table 40: South Korea Bromine Industry Volume (K Tons) Forecast, by Application 2019 & 2032
- Table 41: Taiwan Bromine Industry Revenue (Billion) Forecast, by Application 2019 & 2032
- Table 42: Taiwan Bromine Industry Volume (K Tons) Forecast, by Application 2019 & 2032
- Table 43: Australia Bromine Industry Revenue (Billion) Forecast, by Application 2019 & 2032
- Table 44: Australia Bromine Industry Volume (K Tons) Forecast, by Application 2019 & 2032
- Table 45: Rest of Asia-Pacific Bromine Industry Revenue (Billion) Forecast, by Application 2019 & 2032
- Table 46: Rest of Asia-Pacific Bromine Industry Volume (K Tons) Forecast, by Application 2019 & 2032
- Table 47: Global Bromine Industry Revenue Billion Forecast, by Country 2019 & 2032
- Table 48: Global Bromine Industry Volume K Tons Forecast, by Country 2019 & 2032
- Table 49: Brazil Bromine Industry Revenue (Billion) Forecast, by Application 2019 & 2032
- Table 50: Brazil Bromine Industry Volume (K Tons) Forecast, by Application 2019 & 2032
- Table 51: Argentina Bromine Industry Revenue (Billion) Forecast, by Application 2019 & 2032
- Table 52: Argentina Bromine Industry Volume (K Tons) Forecast, by Application 2019 & 2032
- Table 53: Rest of South America Bromine Industry Revenue (Billion) Forecast, by Application 2019 & 2032
- Table 54: Rest of South America Bromine Industry Volume (K Tons) Forecast, by Application 2019 & 2032
- Table 55: Global Bromine Industry Revenue Billion Forecast, by Country 2019 & 2032
- Table 56: Global Bromine Industry Volume K Tons Forecast, by Country 2019 & 2032
- Table 57: Middle East Bromine Industry Revenue (Billion) Forecast, by Application 2019 & 2032
- Table 58: Middle East Bromine Industry Volume (K Tons) Forecast, by Application 2019 & 2032
- Table 59: Africa Bromine Industry Revenue (Billion) Forecast, by Application 2019 & 2032
- Table 60: Africa Bromine Industry Volume (K Tons) Forecast, by Application 2019 & 2032
- Table 61: Global Bromine Industry Revenue Billion Forecast, by Derivative 2019 & 2032
- Table 62: Global Bromine Industry Volume K Tons Forecast, by Derivative 2019 & 2032
- Table 63: Global Bromine Industry Revenue Billion Forecast, by Application 2019 & 2032
- Table 64: Global Bromine Industry Volume K Tons Forecast, by Application 2019 & 2032
- Table 65: Global Bromine Industry Revenue Billion Forecast, by Country 2019 & 2032
- Table 66: Global Bromine Industry Volume K Tons Forecast, by Country 2019 & 2032
- Table 67: China Bromine Industry Revenue (Billion) Forecast, by Application 2019 & 2032
- Table 68: China Bromine Industry Volume (K Tons) Forecast, by Application 2019 & 2032
- Table 69: India Bromine Industry Revenue (Billion) Forecast, by Application 2019 & 2032
- Table 70: India Bromine Industry Volume (K Tons) Forecast, by Application 2019 & 2032
- Table 71: Japan Bromine Industry Revenue (Billion) Forecast, by Application 2019 & 2032
- Table 72: Japan Bromine Industry Volume (K Tons) Forecast, by Application 2019 & 2032
- Table 73: South Korea Bromine Industry Revenue (Billion) Forecast, by Application 2019 & 2032
- Table 74: South Korea Bromine Industry Volume (K Tons) Forecast, by Application 2019 & 2032
- Table 75: Rest of Asia Pacific Bromine Industry Revenue (Billion) Forecast, by Application 2019 & 2032
- Table 76: Rest of Asia Pacific Bromine Industry Volume (K Tons) Forecast, by Application 2019 & 2032
- Table 77: Global Bromine Industry Revenue Billion Forecast, by Derivative 2019 & 2032
- Table 78: Global Bromine Industry Volume K Tons Forecast, by Derivative 2019 & 2032
- Table 79: Global Bromine Industry Revenue Billion Forecast, by Application 2019 & 2032
- Table 80: Global Bromine Industry Volume K Tons Forecast, by Application 2019 & 2032
- Table 81: Global Bromine Industry Revenue Billion Forecast, by Country 2019 & 2032
- Table 82: Global Bromine Industry Volume K Tons Forecast, by Country 2019 & 2032
- Table 83: United States Bromine Industry Revenue (Billion) Forecast, by Application 2019 & 2032
- Table 84: United States Bromine Industry Volume (K Tons) Forecast, by Application 2019 & 2032
- Table 85: Canada Bromine Industry Revenue (Billion) Forecast, by Application 2019 & 2032
- Table 86: Canada Bromine Industry Volume (K Tons) Forecast, by Application 2019 & 2032
- Table 87: Mexico Bromine Industry Revenue (Billion) Forecast, by Application 2019 & 2032
- Table 88: Mexico Bromine Industry Volume (K Tons) Forecast, by Application 2019 & 2032
- Table 89: Global Bromine Industry Revenue Billion Forecast, by Derivative 2019 & 2032
- Table 90: Global Bromine Industry Volume K Tons Forecast, by Derivative 2019 & 2032
- Table 91: Global Bromine Industry Revenue Billion Forecast, by Application 2019 & 2032
- Table 92: Global Bromine Industry Volume K Tons Forecast, by Application 2019 & 2032
- Table 93: Global Bromine Industry Revenue Billion Forecast, by Country 2019 & 2032
- Table 94: Global Bromine Industry Volume K Tons Forecast, by Country 2019 & 2032
- Table 95: Germany Bromine Industry Revenue (Billion) Forecast, by Application 2019 & 2032
- Table 96: Germany Bromine Industry Volume (K Tons) Forecast, by Application 2019 & 2032
- Table 97: United Kingdom Bromine Industry Revenue (Billion) Forecast, by Application 2019 & 2032
- Table 98: United Kingdom Bromine Industry Volume (K Tons) Forecast, by Application 2019 & 2032
- Table 99: Italy Bromine Industry Revenue (Billion) Forecast, by Application 2019 & 2032
- Table 100: Italy Bromine Industry Volume (K Tons) Forecast, by Application 2019 & 2032
- Table 101: France Bromine Industry Revenue (Billion) Forecast, by Application 2019 & 2032
- Table 102: France Bromine Industry Volume (K Tons) Forecast, by Application 2019 & 2032
- Table 103: Rest of Europe Bromine Industry Revenue (Billion) Forecast, by Application 2019 & 2032
- Table 104: Rest of Europe Bromine Industry Volume (K Tons) Forecast, by Application 2019 & 2032
- Table 105: Global Bromine Industry Revenue Billion Forecast, by Derivative 2019 & 2032
- Table 106: Global Bromine Industry Volume K Tons Forecast, by Derivative 2019 & 2032
- Table 107: Global Bromine Industry Revenue Billion Forecast, by Application 2019 & 2032
- Table 108: Global Bromine Industry Volume K Tons Forecast, by Application 2019 & 2032
- Table 109: Global Bromine Industry Revenue Billion Forecast, by Country 2019 & 2032
- Table 110: Global Bromine Industry Volume K Tons Forecast, by Country 2019 & 2032
- Table 111: Brazil Bromine Industry Revenue (Billion) Forecast, by Application 2019 & 2032
- Table 112: Brazil Bromine Industry Volume (K Tons) Forecast, by Application 2019 & 2032
- Table 113: Argentina Bromine Industry Revenue (Billion) Forecast, by Application 2019 & 2032
- Table 114: Argentina Bromine Industry Volume (K Tons) Forecast, by Application 2019 & 2032
- Table 115: Rest of South America Bromine Industry Revenue (Billion) Forecast, by Application 2019 & 2032
- Table 116: Rest of South America Bromine Industry Volume (K Tons) Forecast, by Application 2019 & 2032
- Table 117: Global Bromine Industry Revenue Billion Forecast, by Derivative 2019 & 2032
- Table 118: Global Bromine Industry Volume K Tons Forecast, by Derivative 2019 & 2032
- Table 119: Global Bromine Industry Revenue Billion Forecast, by Application 2019 & 2032
- Table 120: Global Bromine Industry Volume K Tons Forecast, by Application 2019 & 2032
- Table 121: Global Bromine Industry Revenue Billion Forecast, by Country 2019 & 2032
- Table 122: Global Bromine Industry Volume K Tons Forecast, by Country 2019 & 2032
- Table 123: Saudi Arabia Bromine Industry Revenue (Billion) Forecast, by Application 2019 & 2032
- Table 124: Saudi Arabia Bromine Industry Volume (K Tons) Forecast, by Application 2019 & 2032
- Table 125: South Africa Bromine Industry Revenue (Billion) Forecast, by Application 2019 & 2032
- Table 126: South Africa Bromine Industry Volume (K Tons) Forecast, by Application 2019 & 2032
- Table 127: Rest of Middle East and Africa Bromine Industry Revenue (Billion) Forecast, by Application 2019 & 2032
- Table 128: Rest of Middle East and Africa Bromine Industry Volume (K Tons) Forecast, by Application 2019 & 2032
Frequently Asked Questions
1. What is the projected Compound Annual Growth Rate (CAGR) of the Bromine Industry?
The projected CAGR is approximately 5%.
2. Which companies are prominent players in the Bromine Industry?
Key companies in the market include ICL, Honeywell International Inc, Neogen Chemicals Ltd, Gulf Resources Inc, Tosoh Corporation, Jordan Bromine Company, TETRA Technologies Inc, Tata Chemicals Ltd, Shandong Haiwang Chemical Co, Lanxess, Sujay Chemicals, Albemarle Corporation.
3. What are the main segments of the Bromine Industry?
The market segments include Derivative, Application.
4. Can you provide details about the market size?
The market size is estimated to be USD 2.6 Billion as of 2022.
5. What are some drivers contributing to market growth?
The Increasing Demand of Bromine in Water Treatment Applications; Other Drivers.
6. What are the notable trends driving market growth?
Increasing Demand for Flame Retardants.
7. Are there any restraints impacting market growth?
Emergence of Non-halogenated Flame Retardants; Other Restraints.
8. Can you provide examples of recent developments in the market?
January 2022: ICL introduced the new BromoQuel, a patented solution that redefines bromine leakage incident treatment to expand its bromine business with safety.
9. What pricing options are available for accessing the report?
Pricing options include single-user, multi-user, and enterprise licenses priced at USD 3,950, USD 4,950, and USD 6,950 respectively.
10. Is the market size provided in terms of value or volume?
The market size is provided in terms of value, measured in Billion and volume, measured in K Tons.
11. Are there any specific market keywords associated with the report?
Yes, the market keyword associated with the report is "Bromine Industry," which aids in identifying and referencing the specific market segment covered.
12. How do I determine which pricing option suits my needs best?
The pricing options vary based on user requirements and access needs. Individual users may opt for single-user licenses, while businesses requiring broader access may choose multi-user or enterprise licenses for cost-effective access to the report.
13. Are there any additional resources or data provided in the Bromine Industry report?
While the report offers comprehensive insights, it's advisable to review the specific contents or supplementary materials provided to ascertain if additional resources or data are available.
14. How can I stay updated on further developments or reports in the Bromine Industry?
To stay informed about further developments, trends, and reports in the Bromine Industry, consider subscribing to industry newsletters, following relevant companies and organizations, or regularly checking reputable industry news sources and publications.
Methodology
Step 1 - Identification of Relevant Samples Size from Population Database


Step 2 - Approaches for Defining Global Market Size (Value, Volume* & Price*)

Note*: In applicable scenarios
Step 3 - Data Sources
Primary Research
- Web Analytics
- Survey Reports
- Research Institute
- Latest Research Reports
- Opinion Leaders
Secondary Research
- Annual Reports
- White Paper
- Latest Press Release
- Industry Association
- Paid Database
- Investor Presentations

Step 4 - Data Triangulation
Involves using different sources of information in order to increase the validity of a study
These sources are likely to be stakeholders in a program - participants, other researchers, program staff, other community members, and so on.
Then we put all data in single framework & apply various statistical tools to find out the dynamic on the market.
During the analysis stage, feedback from the stakeholder groups would be compared to determine areas of agreement as well as areas of divergence


